*Swedish National Road and Transport Research Institute (VTI) Box 920, 781 29 Borlänge.
sara.arvidsson@vti.se
**Centre for Transport Studies, Royal Institute of Technology Teknikringen 78 B, 100 44 Stockholm.
Acknowledgement: I wish to thank Länsförsäkringar AB for insurance data; Lage Niemann and Björn Johansson for helpful discussions about the data, the company and its market. I also whish to thank the Swedish Police and the Swedish National Council of Crime Prevention for data on traffic violations. Thanks to Jan-Eric Nilsson, Lars Hultkrantz, Daniela Andrén, Henrik Andersson and participants at
Does private information affect the insurance risk?
Evidence from the automobile insurance market.
Sara Arvidsson
VTI*/CTS**Abstract: This paper empirically investigates the effect of policyholders’ private information about risky traffic behavior on automobile insurance coverage and ex post risk. It combines insurance company information with the policyholders’ private information on risky traffic behavior (traffic violations) that is not accessible to the insurance company. It is demon-strated that being unable to reject the null of zero correlation is not consis-tent with symmetric information in the automobile insurance market. A positive significant correlation for three out of ten groups of new policy-holders is found, consistent with the adverse selection/moral hazard predic-tion. Besides, private information about risky traffic behavior increases ex post risk while it both increases and reduces the demand for extensive in-surance. Our conclusion is that the ambiguity of previous findings in the automobile insurance market may be explained by that high risks have different demand for extensive insurance coverage.
1. Introduction
Asymmetric information has for long been alleged to cause inefficiencies in insurance markets. However, the empirical findings regarding the automo-bile insurance markets have been ambiguous as to whether or not to sup-port the core prediction that individuals with extensive coverage are more likely to be high risks for the insurer. Most previous papers have inter-preted the absence of a significant coverage-risk correlation to mean that the contract-relevant information asymmetry is successfully handled by the principal. Other explanations such as absence of useful private information and policyholder inability to act on private information have also been suggested. In addition researchers have noted that there may exist positive and negative correlation simultaneously such that the correlations cancel out and that the market can suffer from inefficiencies, despite a significant coverage-risk correlation.
Based on theoretical analyses adverse selection and moral hazard theory impregnates many areas with important implications for policy decisions. Empirical research in this area is therefore highly relevant, not only to economists. Cohen and Siegelman (2010) argue that rather than trying to resolve the question of the existence of information asymmetries once and for all, future work should try to identify circumstances under which one may expect to find evidence of relevant information asymmetry. Since market heterogeneity may play an important role, it may be difficult to generalize across insurance markets and between countries. It is further-more reasonable that the correlation structure differs across subsets of policyholders. One reason is that the information asymmetry between the insurer and the policyholder is not constant and may therefore differ across groups, an example is between new and long-term policyholders.
This paper seeks to contribute to the empirical risk-coverage literature by testing information asymmetries in a less generalized setting. It differs in some major ways from previous studies. First, we include policyholders’ private information about risky behavior (traffic violations) in the analysis. Because Swedish insurers are not allowed to share claim history and other pricing characteristics this supplementary information is relevant, since it is known to be an important accident predictor. Furthermore, several of the pricing variables are based on self-reports, the implication being that the information asymmetry may be larger in the beginning when the insurer has no previous observations of the policyholders. In the same way as Cohen (2005) the present study makes use of a sample of new policyhold-ers. Second, we use several subgroups of new policyholders that corre-spond to the insurer’s group classification on age and gender, which pro-vide more homogenous subgroups compared to the previous literature. Third, we put a restriction on vehicle age since it may be an important determinant of choice of coverage and how the vehicle is used. Fourth, conditional on a close replication of the insurer’s risk classification, made possible by access to the insurers actuarial predicted risk classification, we test whether the existence of private information confirms the positive (or negative) correlation between risk and coverage predicted by theory.
The analysis is based on a rich data set of automobile insurance policies, provided by one of Sweden's largest insurance companies. Private informa-tion is represented by observed traffic safety violainforma-tions in terms of on-the-spot-fines and convictions for traffic offences.1 The advantage of this data
is that we are able to directly observe the effect of private information on risky behavior in this particular market, which implies that our conclusions are not all dependent on the existence of a risk-coverage correlation. The
1 Note that private information may also be related to good risks, i.e. absence of convictions or on-the-spot fines.
risk-coverage correlation calls for a remark: a positive and significant cor-relation is a central prediction of both adverse selection and moral hazard and only suggests that the presence of adverse selection or moral hazard cannot be rejected. Similarly a negative significant correlation suggests that the presence of propitious (favorable) selection or preventive actions can-not be rejected. However, disentangling adverse selection and moral hazard as well as propitious selection and preventive actions from each other is beyond the scope of the present paper.
Two approaches are used. The first is the widely used correlation test sug-gested by Chiappori & Salanié (2000). If there exist a significant correla-tion between risk and coverage, the null of no residual asymmetric infor-mation is rejected. Second, we use an approach similar to that suggested by Finkelstein and McGarry (2006), where the effect of private informa-tion on traffic violainforma-tions (risky behavior) is directly observed.
The results indicate the presence of residual asymmetric information that predicts the risk. This residual private information is positive and statisti-cally significant for three groups; females in age group 18-21, females in age group 30-39, and policyholders of both sexes in age group 50+. These results point at the presence of adverse selection and/or moral hazard. We find that risky policyholders are more likely to report an at-fault claim, which is consistent with previous research that has established that viola-tions have a significant effect on crash rate (see Åberg; 1996, 1998 for a review). This implies that the policyholders have information, unobserv-able to the insurer, that predicts the ex post risk.
Private information about risky behavior and insurance coverage are more open for discussion since traffic violations are both positively and nega-tively related to having extensive coverage. Speeding is posinega-tively related to
coverage, except for policyholders aged 40 and over while traffic offences and convictions essentially are negatively related to extensive coverage. This pattern remains consistent both where the correlation test suggests adverse selection and where the null of symmetric information cannot be rejected.
Our observed difference of the effects of traffic safety violations on the demand for insurance may explain why there previously has been an ambi-guity in whether or not to support the presence of adverse selection and/or moral hazard in the automobile insurance market. If high risk drivers es-sentially are less prone to have extensive insurance we cannot expect to find a positive correlation predicted by theory.
The rest of the paper is organized as follows. Section 2 provides a summary of prior theoretical and empirical research with a focus on insurance mar-kets. The section also contains information about the insurance coverage and risk classification in the Swedish automobile insurance market. Section 3 describes the empirical approach in terms of data and econometrics in more detail. Section 4 presents the results and Section 5 concludes the pa-per.
2. Background
A. Previous work
Ever since the 1970s the theoretical research regarding asymmetric infor-mation has developed at a quick pace. The prediction is that asymmetric information is a fundamental problem in most insurance markets: Policy-holders are heterogeneous in risk and this risk level is private (hidden) formation that is important for the contract but unobservable to the in-surer. According to the standard interpretation, the asymmetry results in a situation where high risk individuals buy extensive insurance coverage. This predicts a positive correlation between ex post risk and extensive cov-erage and implies that those with insurance constitute an adverse (bad) selection of risks (Rotschild and Stiglitz 1976; Akerlof 1970; Bolton & Dewatripont 2005 & Salanié 2005). In addition, the insured may under-take private (hidden) actions that affect the risk and thereby the contract. An individual with insurance is then less cautious since s/he does not fully carry the financial risk of an accident. This is known as moral hazard. Both adverse selection and moral hazard produce a positive correlation, disen-tangling them empirically is generally viewed as difficult and is beyond the scope of this paper.
Several studies, both theoretical and empirical, have suggested the possibil-ity of propitious (favorable) selection. Policyholders are heterogeneous not only in their probability of loss (as in the adverse selection model) but also in their aversion to risk. Along the same line of reasoning, the policyholder may perform preventive actions that reduce the risk in the contract. These individuals have a high demand for insurance and are good risks ex post. From the perspective of the insurance company, these types represent a propitious selection of risks (Hemenway; 1990, DeMeza & Webb 2001;
Finkelstein & McGarry; 2006, Fang et al.; 2008). DeDonder and Hindriks (2009), however, show that, under some mild regularity assumptions, this prediction still does not imply a negative correlation between risk and in-surance coverage in equilibrium. The reason is that there is a moral hazard effect: after obtaining insurance the policyholder becomes less risk averse since most of the economic risk is transferred to the insurer.
Empirical research regarding asymmetric information has lagged behind and did not significantly evolve until the 1990s. As discussed by Chiappori and Salanié (1997), data from insurers is well suited for studies of asym-metric information, because it records choice of coverage and outcome (claim or not), as well as many characteristics of the policyholders. Empiri-cal studies have used data from different insurance markets and found evidence of a coverage-risk correlation (See for example Cutler; 2000 and Finkelstein and Poterba; 2004).
Still, empirical tests on property/liability insurance, where automobile in-surance data has been used, do not provide any strong evidence of infor-mation asymmetries that affect the level of risk in the contract (see Chiap-pori and Salanié (2003) for a review). Three early studies suggested the presence of a positive correlation, but these were later criticized as unreli-able. The first and second, Dahlby (1983, 1992) found evidence in favor of adverse selection in the Canadian automobile market, but these studies did not have information on individual coverage. The third, of Puelz and Snow (1994), used data on individual policies from the US automobile market. Their result has since been questioned, one reason being that they did not have information about some of the variables affecting risk type that the insurer had. That is, they applied their analysis to an insufficient informa-tion set, which may have resulted in a spurious correlainforma-tion driven by omit-ted variables. Dionne, Gouriéroux and Vanasse (2001) do not find any
evidence of information asymmetries using French automobile insurance data. They suggest that the insurers’ information set is sufficient if non-linear effects, not considered by Puelz and Snow, are taken into account. A sufficient risk classification implies that there is no residual adverse selec-tion in each risk class, since groups are homogenous in risk.
Although these studies have built a bridge between theory and practice, the findings are not consistent with the theoretical predictions in the insurance market. To overcome previous difficulties, Chiappori and Salanié (2000) (hereafter C&S) suggest a simple and general test of the presence of asym-metric information. Using French individual data covering one year (1989) with information on 1 120 000 contracts and 120 000 accidents, they fo-cused on a subset of 20 716 drivers with less than three years of driving experience.2 This group was assumed to consist mainly of young drivers.3
To test the adverse selection/moral hazard prediction they suggested a cor-relation test between coverage and ex post risk, and they concluded that the market did not suffer from information asymmetries since they could not reject the null of symmetric information.
Cohen (2005) argues that young drivers may not have private information since they have not learned their own risk type. The hypothesis is that there is a learning effect involved; when the policyholders learn their risk type they develop private information. The study takes several implications of the previous critique into account and uses a rich data set of the first five years of one start up insurer in Israel. The data covers 216 524 policies
2 Data was provided by the French federation of insurers (FFSA), which groups 21 companies and constitutes 70 percent of the automobile market. In 1990 they con-ducted a survey of its members. The sampling rate was 1/20 and the resulting data included 41 variables for 1 120 000 contracts and 25 variables for 120 000 claims. 3 One reason why they focus on a young sample is that they believe the heteroske-dasticity problem is less severe than in a sample with a mixture of more senior drivers.
where a subset of new policyholders with 104 639 policies is used in the analysis. When applying the C&S correlation test on policyholders with less than three years of driving experience, the results are confirmed since no significant correlation is found. However, for a group with more than three years of driving experience, Cohen finds a significant negative corre-lation that rejects the null of symmetric information. The main conclusion, as drawn from results that indicate that low deductible contracts are asso-ciated with more claims, is that the market is characterized by the positive correlation predicted by the classical adverse selection theory.
Cohen and Einav (2007), using Israeli automobile insurance data, provide evidence that, conditional on observables, risk and risk aversion are posi-tively correlated (0.86). Their conclusion is that such a correlation makes it even more likely to find evidence of adverse selection and/or moral hazard in the automobile insurance market. They argue that risk in this market differs compared to other markets. Taking precautions, like driving slow or (too) carefully, may expose the policyholder to greater risk.4 They
fur-thermore argue that the correlation coefficient may be highly sensitive to what measure of risk and risk aversion one is using since there may be omitted factors that may be related to both dimensions.5 The policy
ana-lyzed does not cover at-fault accidents. However, it may be interesting to separate out this category of claims, since a risk-averse individual may report accidents where s/he was not at all to blame. This implies that a
4 With regards to speed distribution, Solomon (1964) showed that most accidents on main rural highways involve drivers who are either driving much faster or much slower than the mean traffic speed. This means that the relationship between acci-dent involvement rate and the deviation from the mean traffic speed is U-shaped. However, according to the review by Aarts and van Schagen (2005) none of the relatively new studies show that vehicles that move (much) slower than the sur-rounding traffic has an increased crash rate.
5 They provide examples like the intensity of vehicle use; risk-averse individuals may be more exposed to accident risk because they drive more per year, which could explain the positive correlation.
measure that considers a wider range of claims may not truly reflect the level of risk of the policyholder, which can affect the correlation between risk and risk aversion. Hence, claims where the policyholder was at fault, as studied in this paper, may not have a correlation structure similar to the one found by Cohen and Einav.6
Finkelstein and McGarry (2006) consider the policyholder’s private infor-mation about risk in the long-term medical care insurance market. They examine the effect of the policyholders’ private beliefs of their chances of ending up in long-term medical care in the next five years. This informa-tion is unobserved by the insurer. Their findings indicate that two types of individuals buy insurance; those with private beliefs that they are high risks and those with a strong taste for insurance. Ex post the former is a higher risk and the latter a lower risk to the insurer. One explanation of the in-ability to reject the null of zero correlation may therefore be that several risk types demand more insurance. In such a market the correlation struc-ture can look different from what we expect according to theory. An ab-sence of significant correlation might therefore not imply abab-sence of asymmetric information relevant for the risk in the contract.
B. Social norms and traffic safety violations
Research by psychologists has been able to demonstrate that road crashes are largely attributable to driving violations, such as drunken driving and speeding studied in this paper (see Forward; 2008 for a review). Åberg and Rimmö (1998) survey drivers’ self-reported behavior and find that drinking and driving was the violation that was reported least frequently, while speeding was reported as the most frequent violation. Even though
viola-6 They find that the individuals classified as “good driver” by the insurer have a
lower risk, while they appear to have lower risk aversion. The exact functional form for the classification good driver is unknown.
tions have a significant effect on crash rates the risk acceptance between violations differs, which may be attributed to the social norm. Forward (2006) reports that drivers usually find speeding acceptable. Further, For-ward et al (2000) find that immigrants are less inclined to exceed speed limits than Swedish residents. The longer the respondents lived in Sweden, the more likely they were to exceed speed limits. The general opinion of immigrant respondents in this study is that there are fewer drunken drivers in Sweden than in their home country. Furthermore, Guppy (1993) found that British drivers with prior convictions for speeding or drunk driving in general perceived themselves as less likely to have an accident compared to individuals with no offences.
C. Automobile Insurance and premium pricing in
Sweden
Swedish law requires all vehicle owners to have a Traffic Insurance, which is a liability insurance that covers accident damage inflicted to other drivers and their cars. This is the minimum possible coverage offered. In addition the insurance companies offer Limited Damage Insurance and All Risk Insurance, the later being the most extensive coverage on offer since it also indemnifies damages to the insured's own car when the policyholder is at fault in the claim. All Risk Insurance is typically differentiated by the value of the deductible, our particular insurer offering a lower (3000 SEK) and a higher deductible (5000 SEK). Thus, All Risk Insurance with the lower deductible provides the most extensive coverage. It is also possible to pur-chase a complementary coverage called Additional Insurance, which pro-vides extra service such as a replacement car if something happens to the insured car. The most typical comprehensive coverage in Sweden is All Risk Insurance, which we focus on in this paper.
Swedish automobile insurance companies base their premium classification on three main categories: risk characteristics related to the driver, the vehi-cle and the residential area. To establish pricing, information that statisti-cally affects the expected cost of offering insurance is used. In this way insurers develop a risk classification that is associated with observable characteristics. The insurance contracts are thereafter divided into ho-mogenous groups of risk according to observable characteristics. Individu-als in the same group are charged the same insurance premium since they are considered homogenous in risk. Since the 1990’s each Swedish insurer use their own formula for determining insurance premiums.
The insurers are not allowed to share information about previous claims, so the market structure is similar in that respect to the Israeli market stud-ied by Cohen (2005). The implication of not sharing claims is that policy-holders may underreport their claim history when joining a new insurer in order to receive a lower premium. Other information asymmetries in the Swedish insurance market are that some pricing variables are based on the policyholders’ self reports, such as residential area, and the owner (main user) of the vehicle. This implies that policyholders generally have incen-tives to report untruthfully to receive a lower premium. A latent threat, though, is the reduced indemnity the policyholder may receive if an un-truthful reporting is detected. This threat may not be credible to the poli-cyholder since the possibilities for insurance companies to prove this op-portunistic behavior are limited.7 These are examples of practical
conse-quences of asymmetric information that obstruct the construction of ho-mogenous groups and thereby premium pricing. The implication is that the insurance industry may have difficulties in constructing homogenous risk
7 The incentive to report untruthfully is equivalent to theoretical non-binding
groups, which therefore may produce the correlation structure predicted by theory.
3. The empirical framework
To investigate the nature of private information we use a rich data set that contains both the individuals’ (partially) observable traffic risk and the ex post risk. Since automobile insurance is a property/liability insurance the contracts rather than the policyholders are considered.8 The insurer makes
three main assumptions regarding the contracts. First, there is independ-ence between contracts, the outcome for different insurance policies being independent. Second, there is time independence in that the outcomes in two separate time intervals are independent. Third, homogeneity is as-sumed: an outcome with the same exposure has the same distribution within a risk group. 9 We therefore consider a repeated contract as a new
8 Note that a policyholder may have several contracts that are viewed as different risks by the insurer. An example is a policyholder who insures vehicles of different brands.
9 There exist several examples when these conditions are violated. One example, already discussed, is untruthful reports of the policyholders, which violates homo-geneity. Furthermore, if two vehicles insured by the same insurer are involved in a collision with each other, the independence between contracts could be violated.
observation and do not consider dependency between periods and between contracts owned by the same individual.10
A. Data
The automobile insurance data used in this study comes from an automo-bile insurance provider in Sweden with 24 regional subsidiaries located in all the counties in Sweden; its market share is approximately 32 percent of the property insurance market. All in all the data set contains information of 2 424 525 policy-id’s and 584 425 claims and covers three years (2006-2008). Most of the contracts are repeated and the number of observations when including those are 9 274 116.11 Each observation includes all the
information that the insurer has about the policyholder, vehicle and con-tract characteristics.
10 An individual (or contract) may appear as several observations if he or she owns several cars, make more than one claim or if any changes is made in the contract. About 25% of our sample of new policyholders used in the analysis appear as two or more observations, and 11% have three observations or more. We performed a sensitivity analysis of dependency between individuals in unreported regressions. First, including only the first observation (first contract) of the individual and sec-ond, we cluster adjusted the standard errors with respect to the policyholder-id and the results seem robust. In this paper we however consider the insurance contracts rather than the policyholder and 22% of the contracts appear as two or more ob-servations, 5% as two observations or more. Note that if a change is made the contract will have a new duration and is thus a repeated contract. This implies that the only time a contract with the same date will appear as more than one observa-tion is when more than one accident occurs (approximately 0.7% ). We therefore not consider dependency between time periods, contracts and individuals.
11 A note on the number of observations: data is not truncated, which implies that we can observe policyholders back in time. Besides, there is not always only one observation per contract and year since it is possible to change the contract during the period. If the policyholder (for instance) moves, or de-register the vehicle, the risk changes and there will be a renewed (repeated) contract, and hence another observation. This implies that the total number of observations will not correspond to the number of policy-id’s multiplied with the number of years (2006-2008).
We also add data on the policyholders risky traffic behavior (traffic viola-tions), which we can access as researchers but is not available to the in-surer. This data represents the policyholder’s private information. Data on the number of convictions for traffic safety violations are registered by the Swedish National Council for Crime Prevention (BRÅ). These are cases where sanctions are carried out by an attorney. Examples include convic-tions for driving while intoxicated and driving carelessly: that is, traffic violations that lead to more serious sanctions than on-the-spot-fines. Data on on-the-spot fines comes from the RIOB register of the Swedish National Police Board (RPS). The fines are divided into speeding and other traffic offences such as running red lights, overtaking at crossings, and other of-fences due to risky behavior or vehicle flaws. Since RIOB is cleared peri-odically, it is possible to receive at most five years from the current year.
Data in respect of on-the-spot fines and convictions has been merged with the insurance and claim files by BRÅ for our project. Finally we have merged the insurance and claim files and cleaned the data. Each observa-tion includes the following informaobserva-tion:
1. Demographic characteristics of the policyholder: individual id-number, year of birth, gender, home district and self-reported number of kilometers driven per year.
2. Residential area risk classification: the actuarial predicted risk in the neighborhood where the policyholder lives. Each type of insur-ance coverage (Traffic Insurinsur-ance, Limited Damage Insurinsur-ance and All Risk Insurance) has a classification. All policyholder has each classification regardless of coverage.
3. Car characteristics: vehicle model, brand, construction year, size of engine and vehicle-id.
4. Vehicle risk classification: the actuarial risk classification regarding the vehicle. As with residential area risk classification, each type of insurance coverage has a risk classification regarding the vehicle. 5. Private information: The number of on-the-spot fines for speeding
or other traffic offences of the policyholder during 2004-2007, and the number of convictions a policyholder had during 1973-2007. 6. The type of policy purchased: Traffic Insurance (required if the car
is in use but not if it is deregistered), Limited Damage Insurance, All Risk Insurance (not generally required for new cars since most manufacturers provide insurance) and Additional insurance. 7. Deductible Choice: The only contract providing deductible choice
(high or low deductible) is All Risk Insurance. 8. Premium: The price of the insurance policy.
9. Period covered: From date and to date for each period in the con-tracts. The number of days with insurance is 1-365 days during one period.
10. Realization of risk: Claims submitted by the policyholder and in-formation on which insurance covers the claim. It is also possible to identify the level of at-fault in the claim (none, partial or fully responsible).
11. Driver information: The insurer’s information on the identity of the reported driver in an accident (not necessarily the policy-holder), age, gender and personal identity number and private in-formation according to (5). Note that additional drivers are pri-vate information to the policyholder since the premium is not de-pendent on drivers other than the vehicle owner.
12. Other variables: Household identity, two or more policyholders in the same household share the same household-id.
B. The subsample and descriptive statistics
As with Cohen (2005) our focus is on new customers, this provides us with a smaller subsample of 295 846 observations. As already mention the rea-son why we use a subsample of new policyholders is that the information asymmetry is likely to be larger between the insurer and new policyholders, compared to long-term customers who may have demonstrated their type to the insurer. We further divide the policyholders into homogenous age and gender groups that correspond to the actuarial model used during 2006-2008. This gives us ten groups on which we perform the analysis.
We consider coverage and ex post risk for individuals who joined the in-surer in 2007 and 2008 and include all contracts signed by new policy-holders in 2007 and observe these contracts until they expire. For new policyholders in 2008, we observe all contracts signed in 2008 until they expire or until the end of 2008 when data was collected. This implies that data is censored for 2008 since we cannot observe the outcome in all con-tracts.12
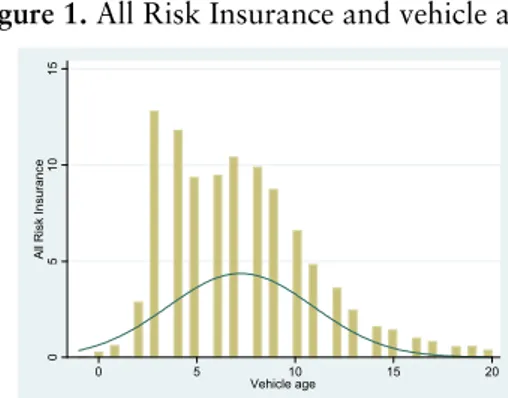
We restrict our analysis to vehicles of age 3-20. The restriction on vehicle age is due to new vehicles generally having a motor vehicle damage war-ranty that corresponds to All Risk Insurance. This affects the choice of purchasing more extensive coverage.13 We also expect that All Risk
Insur-ance is less likely for older vehicles due to a lower economic value. As can be seen in Figure 1 the data confirms that the number of vehicles with All Risk Insurance increases when the vehicle is three years old and decreases
12 We performed a sensitivity analysis of the correlation test by using only new policyholders 2007 for whom we observe the whole lifespan of the contracts, the results can be found in Table 1 in Appendix B.
13 Approximately 15 percent of the policyholders tend to have All Risk Insurance on vehicles below three years of age. One reason is that the deductible for the war-ranty is very high for some vehicle makes and some brands do not come with a warranty.
as the vehicle gets older. We also perform a sensitivity analysis on this re-striction.
Figure 1. All Risk Insurance and vehicle age.
0 5 10 15 A ll R isk I n sur ance 0 5 10 15 20 Vehicle age
Note: Vehicle age is -1 to 20, a negative age is possible in cases where the policyholder owns a vehicle of the latest ve-hicle year model.
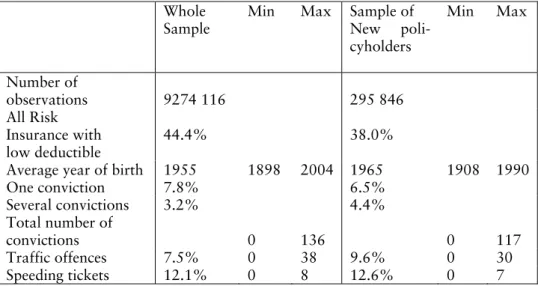
Table 1 provides some descriptive statistics of some of the variables for the whole sample and the subset of all new policyholders 2007 and 2008 used in the analysis.
Table 1. Descriptives of the whole sample and the subsample used (new
policy-holders) in the analysis.
Whole Sample
Min Max Sample of
New poli-cyholders Min Max Number of observations 9274 116 295 846 All Risk Insurance with low deductible 44.4% 38.0%
Average year of birth 1955 1898 2004 1965 1908 1990
One conviction 7.8% 6.5% Several convictions 3.2% 4.4% Total number of convictions 0 136 0 117 Traffic offences 7.5% 0 38 9.6% 0 30 Speeding tickets 12.1% 0 8 12.6% 0 7
In general young individuals have a higher share of on-the-spot-fines for traffic offences compared to the older groups. This indicates that younger individuals are riskier.14 On the other hand older individuals have a higher
share of convictions compared to young individuals. This is likely ex-plained by seniority since higher exposure increases the probability of be-ing observed, and convicted, for a traffic safety violation. Furthermore, males constitute a higher share of vehicle owners compared to women, and women tend to have a lower share of convictions and at fault claims. This implies that women and young individuals have lower frequencies, espe-cially for convictions, compared to males.
14 Note that fines come from RIOB with time period 2004-2007, while convictions come from BRÅ and time period 1973-2007. This implies that it is likely that younger groups have a higher share of fines compared to the older groups. The probability of having one or several convictions, however, increases with age.
C. Econometrical approach
Our first step in the data analysis is to examine the relationship between insurance coverage and ex post risk where the policyholder is held fully and partially responsible in the reported claim. Since the purpose is to in-vestigate if risky traffic behavior tends to affect the probability of risk ex post, at-fault is an informative indicator. One reason is that a pure "bad luck" accident happens at random and is not likely to be affected by the policyholder in the same way as at-fault claims.
We first apply the bivariate probit model suggested by C&S to test for residual asymmetric information.
ci=1(X1+ εi>0) (1)
yi=1(Xδ1+i>0) (2)
(i = contract)
The dependent variable of equation (1) represents the choice of a particular contract, ci = 1 if the policyholder has the highest possible coverage, that
is, All Risk Insurance with low deductible (3000 SEK) and ci = 0 if less
coverage is bought (All Risk Insurance with high deductible (5000 SEK), Limited Damage Insurance or Traffic Insurance).15
The dependent variable of equation (2) represents the occurrence of an at-fault claim, yi = 1 if the policyholder reported a claim where s/he was
par-tially or fully responsible, yi = 0 if the policyholder was not at fault or if no
claim was made. X is a vector of covariates that is included to control for the risk classification used by the insurer in 2006-2008.
15 3000SEK correspond to approximately $429 and 5000SEK to $715 with an exchange rate of 6.99 SEK/USD.
The focus on at fault claims calls for an additional remark in that only at-fault claims where the policyholder was the driver are considered. The reason is that the insurance company does not account for and price by additional drivers. Hence, it is not possible to control for additional drivers in X since these variables aim to explain the policyholders’, or equivalently the vehicle owners’, risk. If all claims at-culpa are considered there may be a spurious correlation between the error terms resulting from omitted vari-ables regarding the risk classification of additional drivers.16 For this
rea-son we have sorted out claims at-culpa where the policyholder was not the driver. A sensitivity analysis assesses the implications of this elimination.
C&S argue that the policyholder’s probability of owning a certain contract depends on the risk classification X and some random shock εi. In a similar
way, for any X, the occurrence of an accident at-culpa also depends on some random shock i. The error terms are aimed at capturing any
resid-ual heterogeneity across agents when the risk classification has been taken into account. The variable of interest is the correlation between the error terms (). If > 0 there is an indication of adverse selection and/or moral hazard since conditional on risk classification, the choice of a contract and the occurrence of an accident are not independent: Contracts with more complete coverage predict a higher probability of an ex post risk.
16 If we consider accidents for driver A where another driver, say B, is at fault we may get a spurious correlation between claims and coverage. The reason is that we condition on the information set related to A and not B. This implies that omitted information about B will affect the correlation coefficient, which may result in a spurious correlation. Getting hit by driver B is a stochastic risk for driver A and this is the reason why A purchases insurance in the first place. Hence the purpose of insurance is to correctly estimate a policyholders' type dependent risk and individu-als sharing the same type dependent risk then share the stochastic risk of an acci-dent.
We extend this by interpreting < 0 as an indicator of propitious selection and/or preventive actions. If policyholders have private information that they are good risks, conditional on risk classification, we expect ex post risk and coverage to be negatively related. One note of caution is the theo-retical result in DeDonder and Hindriks (2009), of which we cannot expect a negative correlation. Still, there may exist other measures of good risks that produce a negative correlation in equilibrium.
Our null hypothesis is that the error terms εi and i are not correlated, that
is, the choice of a particular contract and ex post risk are independent. Our interpretation of being unable to reject the null is that neither correlation structure dominates, rather than interpreting it as if there is no residual asymmetric information.
The second step of the analysis is based on an approach, suggested by Finkelstein and McGarry (2006), to studying the effect of private tion head on. They suggest that the null hypothesis of symmetric informa-tion can be rejected if, condiinforma-tional on the informainforma-tion used by the insurer in setting prices, the econometrician observes some other characteristics of the individual that is correlated with both insurance coverage and ex post risk occurrence. This characteristic must be unknown, or unused, by the insurer. They argue that this approach provides a more robust test for asymmetric information compared to the correlation test. The reason is that it includes variables that represent the policyholder’s private informa-tion, which opens up for the possibility of directly observing the effect of private information.
In our approach we include the policyholders’ private information about risky traffic behavior for coverage and ex post risk. This makes it possible to study the effect of being a high risk on demand for insurance and
out-come (at fault claim or not). The null of no residual asymmetric informa-tion is rejected if, condiinforma-tional on X, private informainforma-tion about traffic be-havior is correlated with both insurance coverage and ex post risk occur-rence. We test the effect of private information by estimating the following probit models:
ci = 1(X1 + D2 + εi > 0) (3)
yi =1 (Xδ1 + Dδ2 + i > 0) (4)
(i = contract)
The added information compared to equation (1) and (2) is four indicator variables that take the value one if the policyholder has at least one fine for speeding, at least one fine for other traffic offences, one conviction for traffic safety violations, and more than two convictions for traffic safety violations, respectively. The reason why we separate one and several con-victions is that we believe that relapsed criminals are higher risks. One conviction may be random, but not several. We also expect that different violations can have different effects due to the social norm.
The coefficients of interest in equation (3) and (4) are 2 and δ2. From
them we can conclude whether the policyholder's private information about risky traffic behavior has any effect on choosing extensive coverage, and/or the probability of being at fault in a claim. A positive correlation prediction is that 2 > 0 and δ2 > 0, which imply that violations of traffic
law regulations are associated with more coverage and culpa in claims. A prediction consistent with propitious selection and/or preventive actions is that higher risk purchases less insurance, implying that the insurers are left with better risks.
D. Controlling for risk classification
Previous studies have pointed out the importance of a careful conditioning on the information set available to the insurance company. The informa-tion set is equivalent to all informainforma-tion that is observable and used in pre-mium pricing by the insurance company. However, an important distinc-tion must be made between the informadistinc-tion set available to the insurer and the actual risk classification used in premium pricing. The information set is the basis for the actuarial prediction that results in a risk classification. Our preferred approach is therefore to condition on the companies actuar-ial risk classification. The main reason is that individuals with similar risk classification are considered as homogenous groups by the insurer. A proper implementation of the positive correlation test therefore requires that insurance demand is analyzed across homogenous groups of individu-als who likely face the same set of possible insurance contracts. A misspeci-fication may result in a spurious correlation: the accuracy is therefore cru-cial.
As previously mentioned, our data contains the actuarial prediction of residential area and vehicle risk category, and we control for policyholder age, vehicle age, and driven distance and apply the test to gender and age groups that were previously used in the insurers’ actuarial model.17 The
variables in X in all regressions are, age of policyholder, vehicle age, kilo-meter class, vehicle risk classification and residential area risk classifica-tion. We also apply the analysis to the age and gender groups used by the insurer in the actuarial model during 2007 and 2008. However, all coeffi-cients are not reported here since the risk classification variables are classi-fied by the insurance company.
17 This implies that instead of conditioning on vehicle make, cc, residential area etc., we have access to the actuarial predicted risk regarding vehicle and residential area.
4. Results
A. Replication of previous studies
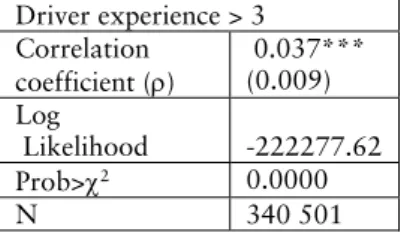
As discussed earlier, Cohen (2005) did not reject the null of symmetric information for the more experienced driver group since a significant nega-tive correlation was found. We replicate these findings by dividing the poli-cyholders into similar groups.18 Group one consists of all new
policyhold-ers with less than three years of driving experience (N = 15 882): this group has no statistically significant correlation between risk and coverage (= 0.032, se = 0.042). The result confirms the results of both Cohen (2005) and C&S.
The second group corresponds to all new policyholders with more than three years of driving experience (N = 340 501): this group has a statisti-cally significant correlation ( = 0.037, se = 0.009). The results confirm the findings of Cohen in that we reject the null hypothesis, but, in contrast, we find a positive correlation between risk and coverage.19
One potential caveat is that the group of inexperienced, or young, drivers is more likely to be homogenous compared to a sample of seniority drivers. C&S provide a note of caution when considering individuals with various driving records and ages. One reason is heteroskedasticity, since the distri-bution of random shocks will depend on seniority, older individual are
18 Our approach differs in that we focus on culpa-claims and more extensive cover-age than Cohen who studies if low-deductible policyholders are associated with more claims. Furthermore, our data does not contain information about driving experience since it is not used in the risk classification. We therefore use a proxy for driving experience by considering age group 18-20 to have less than three years of driving experience and older drivers to have more than three years of driving ex-perience.
19 However, Cohen does not use the lowest deductible in the correlation test. She uses a deductible, referred to as a regular deductible which most of the policyhold-ers in her study choose. The studied insurer offpolicyhold-ers a low, a regular, a high and a very high deductible. Note that the first provides the most extensive coverage.
more likely to report a claim due to longer exposure. This potentially bi-ases the correlation test.
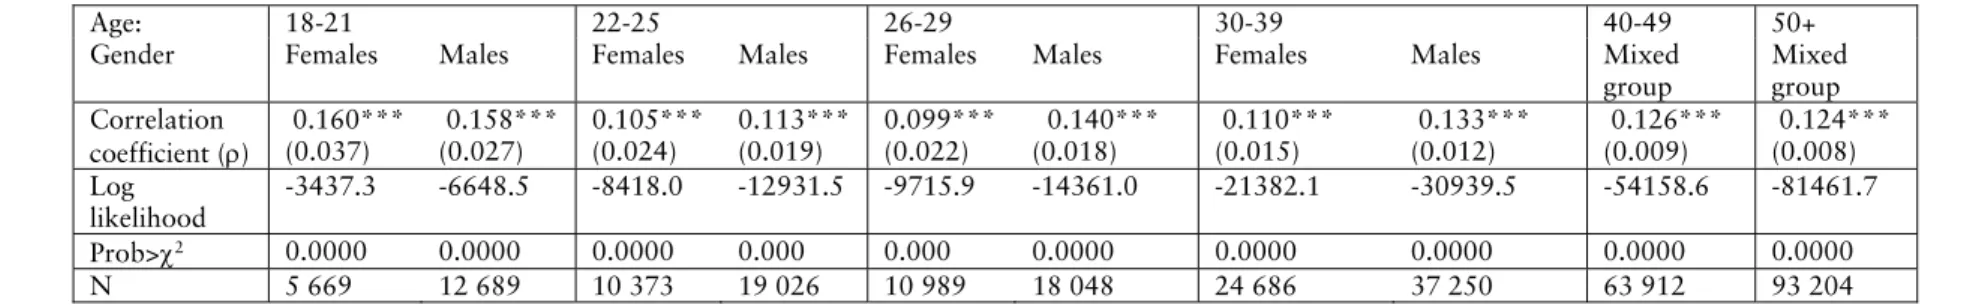
B. The standard positive correlation test
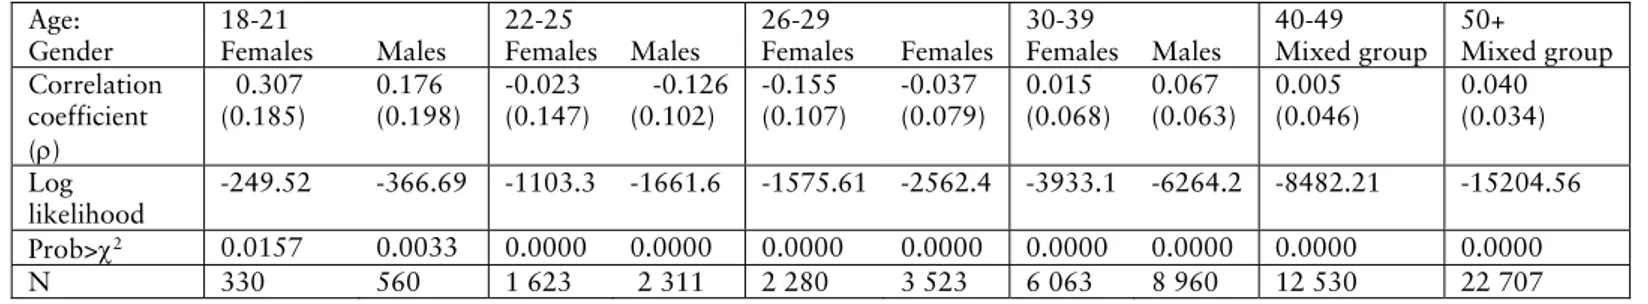
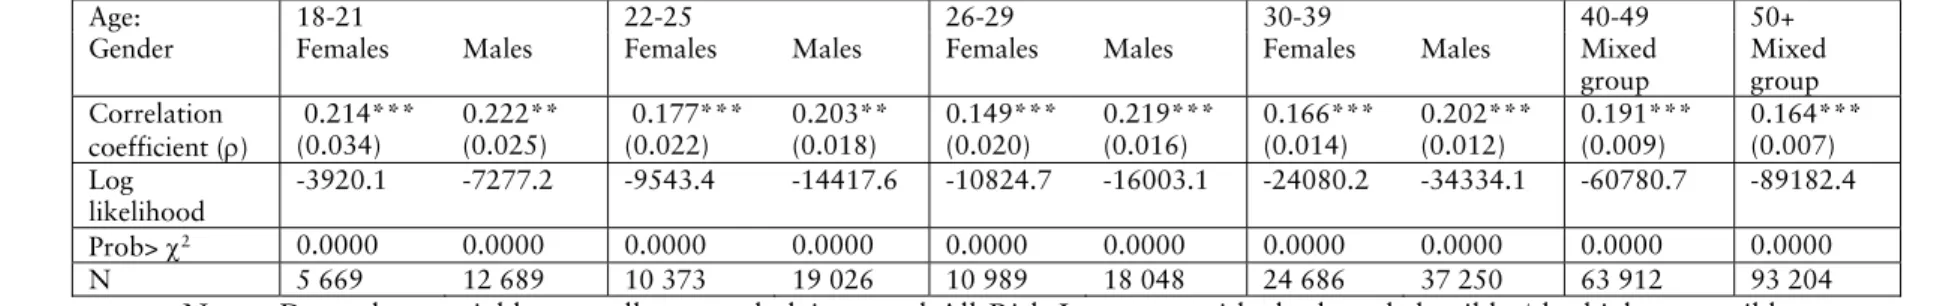
Table 2 reports the results from the bivariate probit model of equations (1) and (2) for our sample of new policyholders aged 18 and over with a vehi-cle aged 3-20.
Overall it seems that the insurance company is able to handle the informa-tion asymmetry problem since there tends to be no significant correlainforma-tion in the majority of groups. Neither a negative nor a positive correlation dominates, except for three groups. Conditional on the risk classification, the correlation coefficient is positive significant for females in the age group 18-21 at the five percent level, females in the age group 30-39 at the one percent level and for policyholders of both sexes in the age group 50+ at the one percent level.20 This indicates that there exists residual
asymmet-ric information, which supports the adverse selection/moral hazard predic-tion.
Sensitivity analysis
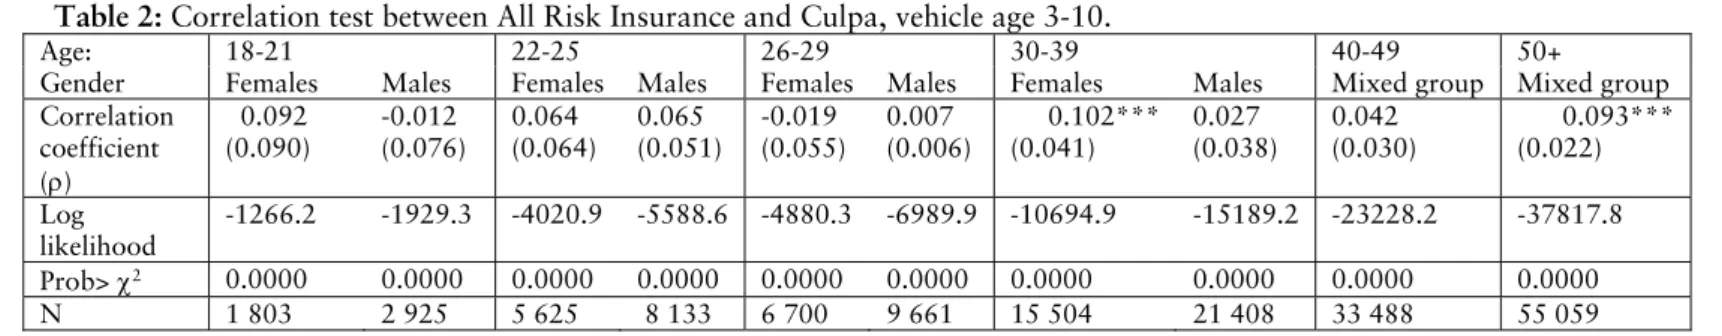
We first apply a sensitivity analysis to the vehicle age restriction, since full coverage may not be motivated for older vehicles due to the economic value of the car. We apply the positive correlation test for vehicle age 3-15, 3-10 and 3-5 (see Table 1-3 in the Appendix A). The correlation is innificant for all groups when the vehicle is 3-5 years old, but becomes sig-nificant for females aged 30-39 and the mixed gender group aged 50+ when the vehicle is 3-10 and 3-15 years old. Hence, the correlation struc-ture does not differ a lot when considering different age intervals for the vehicle, and our findings regarding vehicle age 3-20 seem to be robust.
To investigate whether the results are sensitive to the censoring for 2008, we perform a sensitivity analysis of the correlation test on new
est.
20 We also apply Finkelstein and Poterba's (2004) approach to test the correlation between coverage and risk; prob(y=1)= (X1+c2), where y =1 if an at fault claim is reported, y=0 otherwise, c=1 if the policyholder had All Risk Insurance with the low deductible, y=0 otherwise. The positive correlation prediction is that 2>0. This test confirms the results from the positive correlation t
ers for 2007: that is, contracts where we can observe the whole life span. The results indicate that there exists a positive correlation between risk and coverage for females aged 30-39 and the mixed gender age group 50+. The conclusion is that our results regarding new policyholders for 2007 and 2008 do not suffer from a serious under reporting of claims due to the censoring of outcomes of some contracts signed in 2008. See Table 1 in Appendix B.
We also expect the significance level of the correlation coefficient to in-crease if we consider all claims at culpa. That is, we include cases where a driver other than the owner was at fault in the accident. As previously mentioned, the insurers do not include additional drivers in their risk clas-sification. When including additional drivers, the correlation coefficient also becomes significant for males in the age group 30-39 and the mixed gender group aged 40-49, see Table 4 in Appendix A.
Since the correlation is affected by omitted variables, we expect that the significance level of the correlation coefficient to increase if we omit some variables observed by the insurer. To verify this we first apply the correla-tion test to all reported claims, rather than only at-fault claims, and more extensive coverage. When including all control variables the results suggest a significant positive correlation for all groups, see Table 5 in Appendix A. We do not know, however, whether the results are an effect of claims being reported because policyholders have more extensive coverage, or if they have more extensive coverage because they know that they are likely to report a claim.21 Still we observe that the correlation coefficient increases
21 To investigate if there tends to be an adverse selection/moral hazard effect, a better approach is to compare the outcome in All Risk Insurance with low and high deductibles respectively. A positive correlation prediction is that more claims are reported in the contract with low deductible. To compare the outcome in a setting with low and high deductibles it is necessary to exclude claims that are lower than the highest deductible.
as expected if we exclude some of the control variables, see tables 5 and 7 in the Appendix. Second, we test the effect of the correlation test on a mixed gender group aged 21 and older. This group was not used in the actuarial model during 2006-2008.22 As can be seen in Table 6 in
Appen-dix A, the correlation becomes significant at the one percent level for this group.
One conclusion is that there seems to be a difference in the importance of controls between claims at culpa and claims in general. A change in vari-ables connected to the driver characteristics in the claims at culpa and cov-erage analysis affect the significance level of the correlation. Similarly, the correlation coefficient increases if variables connected to the vehicles are excluded when testing claims in general and more extensive coverage. Our interpretation is that culpa accidents are more determined by driver charac-teristics while claims in general are more dependent on vehicle characteris-tics or random events.23 Our general conclusion from the sensitivity
analy-sis is that the importance of an accurate conditioning on the insurers’ risk classification and the group to whom we apply the test is confirmed.
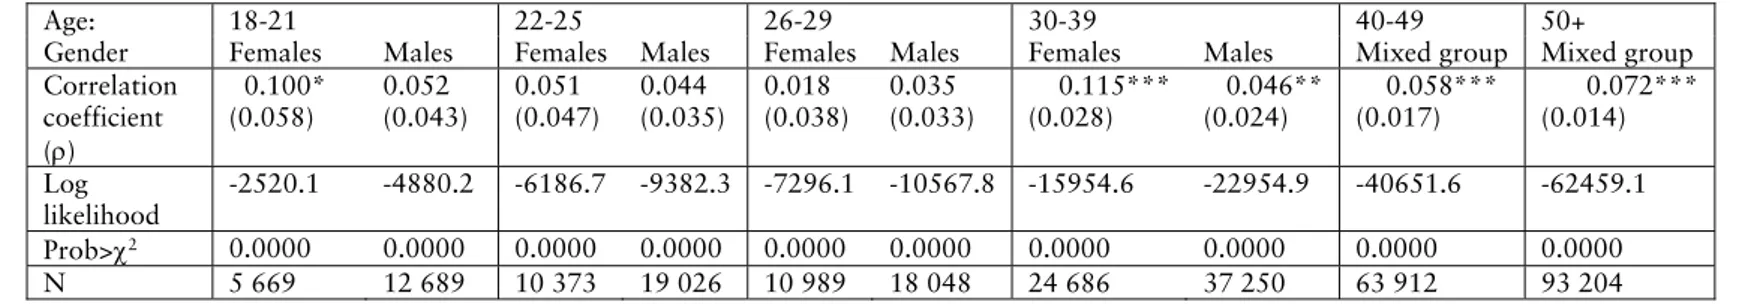
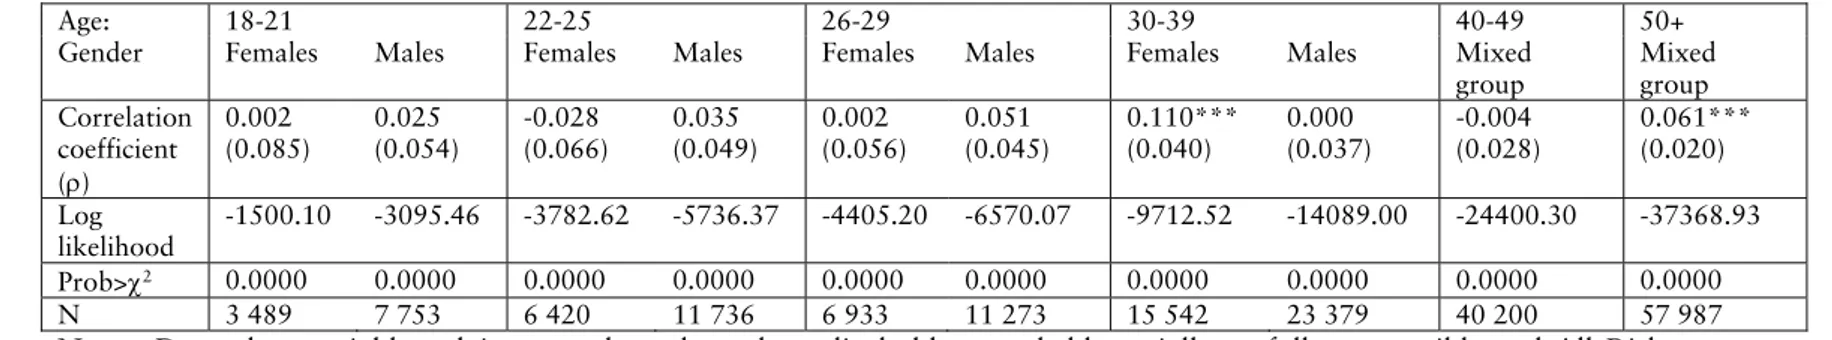
C. Including private information
Tables 3 and 4 report the marginal effects from estimating the relationship between private information about risky traffic behavior, more insurance coverage and culpa in equations (3) and (4), respectively. A bivariate probit model is used in groups where there is a significant correlation between
22 This group consists of the more experienced driver group used in the replication of Cohen (2005).
23 In unreported regressions we test to exclude vehicle risk classification in the culpa coverage analysis and the correlation structure is not affected. Similarly, there is a small effect of excluding policyholder characteristics in claims in general.
equations (3) and (4): similarly, the equations are estimated independently in groups where there is an insignificant correlation.
Table 3 reports the results from estimating the relationship between private information on risky behavior and insurance coverage in equation (3). The results indicate that speeding increases the probability of more insurance, except for the mixed gender and age groups 40-49 and 50+. Moreover, private information about other traffic offences and several convictions for traffic safety violations tend to essentially decrease the probability of more insurance coverage.
Table 4 reports the results from estimating the relationship between private information and at fault claims from equation (4). The results indicate that private information on risky traffic behavior tends to increase the probabil-ity of claims where the policyholder was fully or partially at fault, i.e. risky drivers have more accidents. One note of caution is that there may be an under reporting of culpa claims, high-risk drivers who do not purchase extensive insurance have less incentive to report an accident to the insur-ance company. Whether or not an accident is reported is the policyholder’s decision and this is in turn determined by the terms in the contract.
Taken together, the results presented in Table 3 and 4 point to the presence of asymmetric information, also in groups where no significant correlation was found. This implies, in line with the findings of Finkelstein and McGarry (2006), that a test including private information is more reveal-ing in investigatreveal-ing the effect of private information. The results suggest that policyholders with private information are both less and more likely to have extensive insurance, while they have an increased probability of being at fault in a claim.
A potential caveat is that we cannot observe all contracts until they expire since data is censored for 2008. We therefore perform a sensitivity analysis of the effect of private information on culpa where we include only new
policyholders 2007, see Table 2-3 in Appendix B. The reason is that the censoring may lead to an under-reporting of culpa claims. The results indi-cate the same pattern as for new policyholders in 2007 and 2008, the con-clusion being that our results are not sensitive to the censoring.
We also performed a sensitivity analysis where deregistered vehicles are excluded from the analysis. Having the vehicle deregistered may affect the choice of coverage; if the vehicle is not in use there may be no reason to purchase full coverage. Speeding and one conviction, which is significant at the 10 percent level in Table 3, does not have a significant effect on exten-sive coverage in age group 50+, otherwise the results are robust, see Table 4 in Appendix B. We also performed a sensitivity analysis of this reason on at fault claims, speeding becomes significant at the 10 percent level for females aged 18-21, while speeding becomes insignificant for males 18-21 (see Table 5 in Appendix B).24 Hence, our results seem robust.
24 We also performed a sensitivity analysis on the correlation test where we ex-cluded de-registered cars. The reason is that these are not allowed in traffic since they are uninsured. The majority of these vehicles may therefore not be in use. The significance level and signs are the same as before, except for the correlation coeffi-cient for females 30-39, which becomes significant at the 5-percent level instead of the 1-percent level.
5. Conclusions
A general challenge for any empirical analysis regarding insurance data is the difference in structure across insurance markets. Market heterogeneity may explain why some markets tend to have a negative correlation, while others tend to have positive, or even no correlation between risk and cov-erage. It is furthermore reasonable to question whether we should expect to find any evidence of information asymmetries in the insurance market. The reason is that an accurate conditioning on the insurer’s risk classifica-tion would eliminate any correlaclassifica-tion, at least if the risk classificaclassifica-tion used by the insurer is efficient.
This paper however demonstrates that being unable to reject the null of zero correlation is not necessarily consistent with symmetric information, or a sufficient risk classification, in the automobile insurance market. When testing the effect of policyholders’ private information on traffic safety violations, which is unobservable to the insurer, we find that the market suffers from asymmetric information even in groups where there is no statistically significant coverage-risk correlation. This indicates that high risk drivers are not always more prone have extensive coverage, which we expect according to the adverse selection/moral hazard prediction.
We find that traffic violations increase the probability of at-fault claims, which is consistent with previous findings. Furthermore, private informa-tion both increases and reduces the probability of extensive insurance cov-erage. An increase implies an increased risk to the insurer, which increases with the magnitude of insurance coverage since the insurer has to carry a larger share of the economic risk. Similarly, a reduction in the probability of extensive insurance decreases the insurance company’s risk. More spe-cifically, the indicator variable for speeding tends to be positively related to extensive coverage, while the indicator for convictions, such as drunken
driving and other traffic offences, tends to be negatively related to exten-sive coverage. The results regarding convictions may further mirror that individuals with prior convictions find themselves less likely to have an accident (Guppy; 1993). With this in mind, it is rational to have a lower demand for insurance. The results regarding speeding are more open for discussion. It could be that the number of speeding tickets is highly corre-lated with driving experience and distance. Hence, older groups may per-ceive themselves as good risks and therefore demand less insurance. A complementary possibility, that may explain the results in groups aged less than 40, is that speeding is correlated with other risk characteristics leading to higher demand for insurance. All in all, our findings suggest that there may exist both a positive and a negative correlation simultaneously in the particular market studied. Private information about traffic violations posi-tively related to extensive coverage implies a positive correlation support-ing adverse selection and/or moral hazard. The reason is that policyholders demand more insurance while they constitute a higher risk. On the con-trary, private information about traffic violations are also negatively re-lated to extensive coverage, which implies a better selection of risks. The reason is that some high risks select themselves out of the contract, essen-tially those with convictions and traffic offences other than speeding.
Our results have policy implications in that they imply that an absence of a risk-correlation is not synonymous with absence of information asymme-tries. Policy discussions should therefore focus on potential information asymmetries in each market, keeping in mind that information that is pri-vate in some markets may be public in others. In Sweden traffic violations are private information to the policyholder, while in the USA it is generally observable to the insurers. Moreover in some countries the claim history of policyholders switching from other insurers is also observable to the in-surer. Differences in information asymmetries across markets due to
regu-lations or habits imply that we can expect different results across insurance markets, countries and even insurance companies. Laws and regulations play an important role in whether or not we expect to find positive or negative correlation supporting adverse selection/moral hazard or propi-tious selection/preventive actions. A reason for considering sub sets of poli-cyholders, rather than a whole population, is that the information between the policyholder and the insurer is not static since the asymmetry likely reduces over time (see Cohen; 2005). This implies that the information asymmetry is likely to reduce in repeated contracts. Hence, there may be different effects of information asymmetries in different subgroups.
Our approach in considering smaller and more homogenous subgroups and including private information variables contributes to a potentially viable alternative in testing for information asymmetries. We suggest that future research should consider specific market characteristics and subsets of policyholders that are likely to be affected, or take advantage, of infor-mation asymmetries. Since a positive and negative correlation can have offsetting effects we find the correlation test plausible if the researcher is interested in ascertaining which correlation structure that dominates the market. This implies that the demand for high and low risks may look different from what we expect according to theory. Another potential ca-veat with the correlation test, no matter the accuracy of conditioning of the insurers’ information set, is that the results are biased by information ob-served by the insurer and not the researcher. We therefore suggest that empirical work in this area should not try to find empirical evidence in favor of the adverse selection/moral hazard prediction that generally holds for all markets. While the standard case assumes one dimension of risk actual markets tend to be more complex. It would therefore be hazardous to rule out asymmetric information based on an insignificant risk-coverage correlation. Future research may benefit from interpreting relevant
infor-mation asymmetries in broader terms than the standard positive correla-tion prediccorrela-tion. It is reasonable to believe that ambiguity found across insurance markets does not necessarily imply a contradiction. We rather believe that this is an effect due to market heterogeneity.
References
Aarts, L. and I. van Schagen: 2006, ”Driving speed and the risk of road crashes: A review”. Accident analysis and prevention 38(2), 215-24.
Akerlof, G: 1970, "The Market for Lemons: Quality Uncertainty and the Market Mechanism". Quarterly Journal of Economics, Vol. 84, No. 3, pp. 488-500.
Bolton, P. and M. Dewatripont: 2005, Contract Theory, Cambridge Mass: MIT Press.
Chiappori, P-A. and B. Salanié: 1997, "Empirical Contract Theory: The Case of Insurance Data". European Economic Review 41(3-5), 943-950.
Chiappori, P-A. and B. Salanié: 2000, “Testing for Asymmetric Informa-tion in Insurance Markets”. Journal of Political Economy 108(1), 56-78.
Chiappori, P.A. and B. Salanié: 2003, "Testing Contract Theory: A Survey of Some Recent Work", in M. Dewatripont, L. Hansen and S. Turnovsky.
Advances in Economics and Econometrics, Cambridge University Press,
Cambridge.
Cohen, A: 2005, "Asymmetric Information and Learning: Evidence from the Automobile Insurance Market". The Review of Economics and
Statis-tics 87(2), 197-207.
Cohen, A. and L. Einav: 2007, "Estimating Risk Preferences from De-ductible Choice". American Economic Review 97(3), 745-788.
Cohen, A. and P. Siegelman: 2010, “Testing for adverse selection in insur-ance markets”. Journal of Risk and Uncertainty (forthcoming).
Cutler, D: 2000: “ Health Care and the Public sector” in A Auerbach and M Feldstein (Eds.) Handbook of Public Economics (Amsterdam: North Holland 2002).
Dahlby, B: 1983, “Adverse Selection and Statistical Discrimination: An Analysis of Canadian Automobile Insurance”. Journal of Public Economics 20(1), 121-130.
Dahlby, B: 1992, “Testing for Asymmetric Information in Canadian Automobile Insurance,” in George Dionne (Ed.) Contributions to
Insur-ance Economics (Boston, Kluwer Academic.)
DeDonder, P. and J. Hindriks: 2009, "Adverse selection, moral hazard and propitious selection". Journal of Risk and Uncertainty 38(1), 73-86.
DeMeza, D. and D. Webb: 2001, "Advantageous Selection in Insurance Markets", RAND Journal of Economics 32(2), 249-262.
Dionne, G., C. Gouriéroux and C. Vanasse: 2001, "Testing for Evidence of Adverse Selection in the Automobile Insurance Market: A Comment".
Journal of Political Economy 109(2), 444-453.
Fang, H., M. Keane and D. Silverman: 2008, “Sources of Advantageous Selection: Evidence from the Medigap Insurance Market”. Journal of
Finkelstein, A. and J. Poterba: 2004, "Adverse Selection in Insurance Mar-kets: Policyholder evidence from the U.K Annuity Market" Journal of
Po-litical Economy 112(1), 183-208.
Finkelstein, A. and K. McGarry: 2006, "Multiple Dimensions of Private Information: Evidence from the Long-Term Car Insurance Market"
Ameri-can Economic Review 96(4), 938-958.
Forward, S., D. Kós-Dienes and S. Obrenovic: 2000, “Invandrare i trafiken, en attitydsundersökning i Värmland och Skaraborgs län” [Immi-grants in traffic, a study of attitudes in two counties in Sweden] VTI report 454.
Forward, S: 2006, “The intention to commit driving violations – A qualita-tive study”. Transportation Research part F 9(6), 412-426.
Forward, S: 2008, “Driving violations investigating forms of irrational rationality”. Digital comprehensive summaries of Uppsala dissertations from the faculty of social sciences 44. Uppsala University.
Guppy, A: 1993, “Subjective Probability of Accident and Apprehension in Relation to Self-Other Bias, Age, and Reported Behavior”. Accident
Analy-sis and Prevention 25(4), 375-382.
Hemenway, D: 1990, "Propitious Selection in insurance", The Quarterly
Journal of Economics 105(4), 1063-1069.
Puelz, R. and A. Snow: 1994, “Evidence on Adverse Selection: Equilib-rium, Signaling and Cross- Subsidization in the Insurance Market”. Journal
Rotschild, M. and J. E. Stiglitz: 1976, "Equilibrium in Competitive Insur-ance Markets: An Essay on the Economics of Imperfect Information". The
Quarterly Journal of Economics 90 (4), 630-649.
Salanié, B: 2005, "The Economics of Contracts: a primer", Cambridge, Mass: MIT Press.
Solomon, D: 1964, "Accidents on main rural highways related to speed, driver, and vehicle". Technical report, U.S. Department of Commerce/Bureau of Public Roads.
Åberg, L: 1993, “Drinking and driving: intentions, attitudes and social norms of Swedish
male drivers”. Accident Analysis and Prevention 25(3), 289-296.
Åberg, L. :1998, “Traffic rules and traffic safety”. Safety Science 29(3), 205-215.
Åberg, L. and Rimmö P.A: 1998, “Dimension of aberrant driver behav-ior”. Ergonomics 41, 39-56.
Appendix A: Sensitivity analysis of vehicle age, claims and omitted
control variables
Table 1: Correlation test between All Risk Insurance and Culpa, vehicle age 3-5.
Age: 18-21 22-25 26-29 30-39 40-49 50+
Gender Females Males Females Males Females Females Females Males Mixed group Mixed group
Correlation coefficient () 0.307 (0.185) 0.176 (0.198) -0.023 (0.147) -0.126 (0.102) -0.155 (0.107) -0.037 (0.079) 0.015 (0.068) 0.067 (0.063) 0.005 (0.046) 0.040 (0.034) Log likelihood -249.52 -366.69 -1103.3 -1661.6 -1575.61 -2562.4 -3933.1 -6264.2 -8482.21 -15204.56 Prob>2 0.0157 0.0033 0.0000 0.0000 0.0000 0.0000 0.0000 0.0000 0.0000 0.0000 N 330 560 1 623 2 311 2 280 3 523 6 063 8 960 12 530 22 707
Notes: Dependent variables are claims at culpa where the policyholder was held partially or fully responsible and All Risk Insurance with the low deductible (the highest possible insurance coverage). Independent variables correspond to the insur-ers' risk classification. Total number of observations are 60 887. Standard errors are in parentheses***, **, * indicate sig-nificance at 1%, 5% and 10% levels respectively.
Table 2: Correlation test between All Risk Insurance and Culpa, vehicle age 3-10.
Age: 18-21 22-25 26-29 30-39 40-49 50+
Gender Females Males Females Males Females Males Females Males Mixed group Mixed group
Correlation coefficient () 0.092 (0.090) -0.012 (0.076) 0.064 (0.064) 0.065 (0.051) -0.019 (0.055) 0.007 (0.006) 0.102*** (0.041) 0.027 (0.038) 0.042 (0.030) 0.093*** (0.022) Log likelihood -1266.2 -1929.3 -4020.9 -5588.6 -4880.3 -6989.9 -10694.9 -15189.2 -23228.2 -37817.8 Prob> 2 0.0000 0.0000 0.0000 0.0000 0.0000 0.0000 0.0000 0.0000 0.0000 0.0000 N 1 803 2 925 5 625 8 133 6 700 9 661 15 504 21 408 33 488 55 059
Notes: Dependent variables are claims at culpa where the policyholder was held partially or fully responsible and All Risk Insurance with the low deductible (the highest possible insurance coverage). Independent variables correspond to the insur-ers' risk classification. Total number of observations are 160 306. Standard errors are in parentheses***, **, * indicate significance at 1%, 5% and 10% levels respectively.
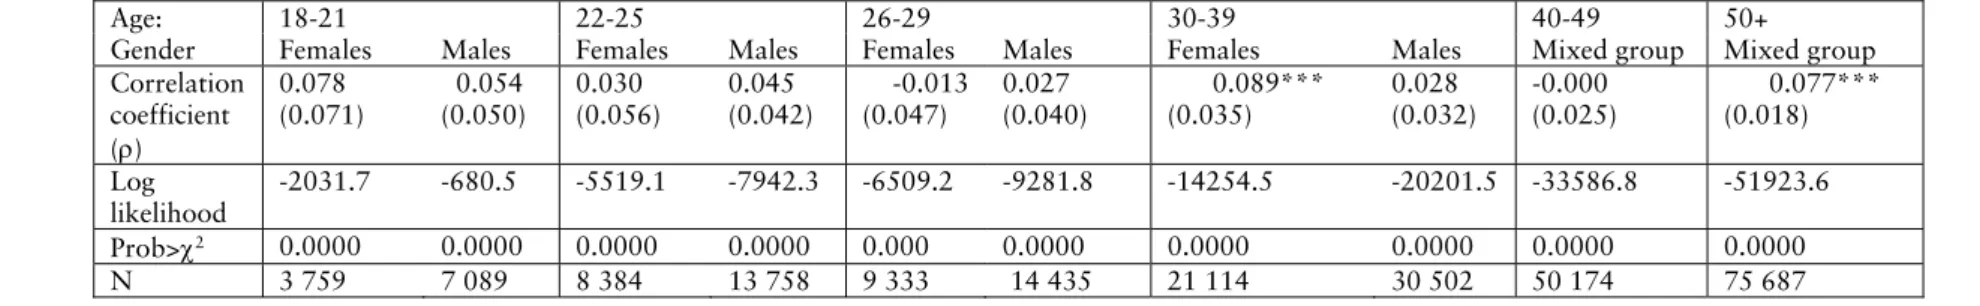
Table 3: Correlation test between All Risk Insurance and Culpa, vehicle age 3-15.
Age: 18-21 22-25 26-29 30-39 40-49 50+
Gender Females Males Females Males Females Males Females Males Mixed group Mixed group
Correlation coefficient () 0.078 (0.071) 0.054 (0.050) 0.030 (0.056) 0.045 (0.042) -0.013 (0.047) 0.027 (0.040) 0.089*** (0.035) 0.028 (0.032) -0.000 (0.025) 0.077*** (0.018) Log likelihood -2031.7 -680.5 -5519.1 -7942.3 -6509.2 -9281.8 -14254.5 -20201.5 -33586.8 -51923.6 Prob>2 0.0000 0.0000 0.0000 0.0000 0.000 0.0000 0.0000 0.0000 0.0000 0.0000 N 3 759 7 089 8 384 13 758 9 333 14 435 21 114 30 502 50 174 75 687
Notes: Dependent variables are claims at culpa where the policyholder was held partially or fully responsible and All Risk Insurance with the low deductible (the highest possible insurance coverage). Independent variables correspond to the insur-ers' risk classification. Total number of observations are 234 235. Standard errors are in parentheses***, **, * indicate significance at 1%, 5% and 10% levels respectively.