l/TIra
305 A;
1887
Company and personal busin883
car 0wnership
Peter Cardebring
m
Vag- 00/)
Statens ve'g- och trafikinstitut (VTI) o 58 1 o 1 Linkb'ping
V ra
305A
1937
Company and personal busin933
car awnership
Peter Cardebring
Vag-06/1
Statens vé'g- och trafikinstitut (VTI/ - 58 1 0 1 Linkb'ping
N
P
N
r i k» P P . i i -rP
P
P
P
N
N
N
r
5.1 ix) ? N H ) 0 TABLE OF CONTENTS ABSTRACT SUMMARYPURPOSE, STRUCTURE, RESTRICTIONS AND DEFINITIONS
A DESCRIPTION OF THE DEVELOPMENT AND CURRENT STATUS OF CAR NUMBERS
Company cars 1950 1985
Personal business cars 197#-l985 Leased cars
A CROSS-SECTIONAL ANALYSIS OF CAR OWNERSHIP FOR 1982
Company car ownership
Number of cars in use in different sectors Number of cars in use within different econo mic sectors
Number of cars per employee and per company Personal business car ownership
Number of cars within different economic sectors Number of cars per employed and per personal business
PRIVATE USE OF COMPANY CARS
COMPANY AND PERSONAL BUSINESS CARS NEW REGISTRATIONS
Companies' and Personal Businesses' new
registrations (by car model)
THE NUMBER OF PASSIVE CARS OWNED BY COMPANIES AND PERSONAL BUSINESSES
COMPANY CARS IN AUSTRALIA AND THE UNITED KINGDOM - A COMPARISON
VTI RAPPORT 305A
Page II wo w 10 IO 10 12 l4 l7 l7 I9 22 25 29 30 32
Company and Personal Business Car Ownership by Peter Cardebring
Swedish Road and Traffic Research Institute (VTI)
5 581 01 LINKOPING Sweden '
ABSTRACT
Car ownership by companies and personal businesses has been investigated at VTI (the Swedish Road and Traffic Research Institute), as part of the development of a forecasting model for car ownership.
In 1985 261 000 cars were owned by companies (cars in use) and 262 700 by personal businesses, each representing little less than nine percent of the total number of cars. The number of leased cars amounted to almost 130 000 of which 80 percent were leased by companies.
The companies share of new registrations was 38 percent and of personal businesses 7 percent.
The most car intensive sector for companies (number of cars per employee) was the Wholesale and Retail trade sector, and for personal businesses it was the Agriculture and Forestry sector.
II
Company and Personal Business Car Ownership by Peter Cardebring
Swedish Road and Traffic Research Institute (VTI)
S 58l Ol LINKOPING Sweden
SUMMARY
An investigation of car ownership by Companies and Personal Businesses for the period 1950-1985 was undertaken as part of the work of developing
a model for forecasting car ownership to the year 2010 (VTI Report 301).
The results of this investigation are presented in this report.
In 1950, companies owned 43 000 cars, by 1985 the equivalent figure was 261,000. Expressed as a percentage share of the number of cars in traffic, the share has diminished from 17 percent in 1950 to 9 percent in 1985. It has been possible to trace the number of cars owned by personal businesses for the years 1971+ to 1985 only. During that period they have increased from 220 000 to 260 000 representing little less than 9 percent of the number of cars in traffic, over the period.
During the period 1970 to 1985, the number of leased cars has increased from 5 000 to approximately 130 000. The majority of these, 80 percent, are leased by companies.
The major proportion of company cars are in the Manufacturing, Con-struction, Wholesale and Retail Trade and Real Estate sectors, which together accounted for 57 percent in 1982.
The most company car intensive" sector, measured as the number of cars per employee, is the Wholesale and Retail Trade sector followed by the Maintenance and personal service sector with approximately 6 employees per company car.
With regard to personal businesses more than 93 000 cars are in the Agriculture and Forestry sector, which constitutes 42 percent of the cars owned by personal businesses.
III
The same sector is the most car intensive with just under 2 employees
(including the farmer) per car.
The number of beneficiaries of free cars i.e. employees who use company cars for private purposes also, has increased from 71000 in 1979 to 128 000 in 1984, which represents 50 percent of all company cars. These figures may be underestimated and according to the Department of
Finance the number of beneficiaries was little more than 200 000 in 1986.
During the period 1980 to 1985 the company cars' share of new registra tions was, on average, 34 percent, with a maximum of 38 percent in 1985. The personal businesses share of new registrations was 7 percent over the same period.
If passenger cars that are newly registered by individuals, but are mainly used for businesses purposes and for which the employer pays a mileage
allowance, are included, the share of new registrations allocated to
companies increases by 10 percentage points.
The number of passive cars, (cars not in use) owned by companies, during the period 1977 to 1984, was approximately 95 000. The majority of these, 90 percent, constituted traded-in cars held by car dealers.
1 PURPOSE, STRUCTURE, RESTRICTIONS AND DEFINI-TIONS.
This report arises from work undertaken to develop a model for forecast-ing car ownership for the period to the year 2010, and published in VTI Report 301, "Personbilsinnehavet i Sverige 1950 2010".
Company and personal business cars are of interest in that in most cases they are used both for business and private purposes. These cars can be divided into three categories; "genuine company cars" meaning that they are only used for business trips (category A), combined company and private cars (category B1) and finally cars that are registered by an individual where the individual owns his own business (Category B21) as well as cars owned by individuals whose employer pays a mileage
allowance (category B22).
Categories B1 and B21 are especially interesting as these cars are used both for business and private purposes.
The purpose of this report is to describe the development over time of the number of company cars (categories A and Bl) and the number of personal
business cars (category B21).
The data used in the report are based on the Central Business Register (CFR) of all the businesses and institutions in Sweden as well as on information from the Car Registration System (TSV) on the car ownership status.
The Statistical Central Bureau (SCB) has provided information on the distribution of cars by type of owner by matching the Central Business
Register (CFR) to the Car Register (TSV). The employment figures for
different economic sectors and branches have been derived from the
national account statistics.
Four definitions and restrictions must be clarified from the beginning. (1) A legal association is an association such as the State, a local authority, a company or foundation etc. which operates as an independent legal entity, acquiring rights and obligations; it also enjoys limited liability and acts under a special company name. In this report cars owned by individual associations are referred to as company cars.
(2) An individual is a person who enjoys independent juridical status. (3) A personal business is a person who produces goods or services but is
not a juridical entity. In the Central Business Register the individual s personal number is used as his organisation number with a special code indicating that it refers to private business.
(Q) A car is leased when it is rented for a period of not less than one year,
by one user. Leased cars are given a special code in the Car Register and the leasor is described as the second owner with the leasee denoted as primary owner.
2 A DESCRIPTION OF THE DEVELOPMENT AND CURRENT STATUS OF CAR NUMBERS
2.1 Company Cars 1950-1985
The number of company cars in 1950 was 43 000*. In 1960 the number had increased to 167 000*, an increase of approximately 300 percent in 10 years. This increase continued to 1969-1970 when the number of company cars amounted to 280,000*, an increase from 1960 of a little less than 70 percent. In the 19705 the number of company cars has varied considerably (see Figure l), and as the figure shows, it peaked in 1976 with 305 000** cars. During the period 1977 to 1981 the number of company cars decreased with 108,000 0r approximately 35 percent. There are several
reasons for this decline of active cars (cars in use):
0 The taxation rules for small businesses were changed as and from the income year of 1977.
0 Vehicle tax was substantially increased in 1977 which acted as an incentive to car dealers to keep traded in cars passive until they were
sold.
0 The taxation rules for a company car (benefit in kind) were tightened up
from the income year of 1978.
0 New means of assessing car dealers' insurance premiums were applied in
1979 which further encouraged dealers to keep traded-in cars
- * *
-)(-passwe.
o The estimated value of the benefit of having a company car was added to the social payments required from the employer in 1980.
* Bilprognos 1972-1985 forsaljning, skrotning, besté md av Lars
Jacobsson IUI, s 20
Studier i bilismens ekonomi av Jan Wallander, IUI 1958, s 265-271
** SCB T 24 SM 8501
*** See VTI Meddelande 415 Avstallda bilar och bilstatistiken, s 5-7
Number of Percentaoe cars _ "" _ " sham 1 ii 340 -300' -4 260' -i 220' 180" 100" 60" 20"
Figure l. The number of cars owned by companies and as a percentage
share of the total number of cars (cars in use) 1950-1985
These administrative rule changes together led to the decline of 108 000 in the number of company cars (active cars) between 1976-1981.
Part of this decline is purely statistical as some cars merely underwent a change in status from active to passive. This can be seen from the Table below where both active and passive as well as the total of company cars
are shown.
Table 1. The number of company cars* 1976 1985
Year Active Passive Total
1976 305 397 45 255 350 652 1977 270 968 89 814 360 782 1978 241 162 87 587 328 749 1979 200 241 108 463 308 704 1980 197 559 100 643 298 202 1981 197 926 88 043 285 969 1982 205 480 88 122 293 602 1983 221 082 89 090 310 172 1984 243 281 105 062 348 343 1985 261 035 109 457 370 492
If the total number of cars is used, the number of active and passive cars together, as a measure, we can see that the number of cars increased up to 1977 and that between 1977 1981 the total number of cars decreased by 75 000 compared with the earlier figure of 108 000. During 1977 passive company cars increased by 45 000 to a total of 90 000, and the average number over the period 1977 1984 was approximately 95 000 passive cars.
For the most part, these cars consist of the dealers' store of used cars, which are passive, and, on average, amounted to approximately 85 000 during the period 1982 1984. After 1977 when either active cars or the
total number of cars are used as a measure, we can see that a decrease
has taken place between 1978 1981.
The first part of the 805 shows an increase in the number of cars in use of approximately 65 000 or of 32 percent between 1980 and 1985.
If we study the company car share of the total active cars (see Figure 1) we get a different picture. The company cars' share has decreased from 17 percent in 1950 to little less than 9 percent in 1985, a decrease of 8 percentage points or, to put it another way, a decrease of 47 percent.
* Includes cars for which owners' number can be found in SCBs central
business register of companies.
The decrease in the company car share between 1950-1985 reflects the increase of individual car ownership which mainly took place during the 19505 and 605. The share of male car owners increased during the 19505 by approximately 37 percentage points and during the 19605 by approximate-ly 22 percentage points, and the females increased their car ownership by approximately 8 percentage points during the 19605*.
The total number of cars, including company cars, increased during the 19505 by 941 000 and in the 19605 by 1 094L 000. The percentage increase for the 505 was 470 percent and for the 605 was less than half of the 505 increase or 190 percent. The number of cars in use was 252 500 in 1950,
1 193 900 in 1960 and 2 287 700 in 1970.
2.2 Personal Business Cars 1974-1985
Accurate figures for the number of cars owned by personal businesses are available since 1982. By combining this information with the information from the Central Business Register (CFR) on the number of personal businesses for the period 1982 1985, an average car share has been calculated. According to this method there were on average 0.88 cars per personal business. By multiplying this share by the number of personal businesses for each year during the period 1974-1981, Figure 2 has been
arrived at.
Between 1974 and 1985 the number of cars owned by personal businesses has increased from aproximately 217 000 to 262 700, an increase of 21 percent (the number of personal businesses has increased over the period
by approximately 45 000).
* VTI Rapport 301 Personbilsinnehavet i Sverige 1950-2010 5 47-53
Number of Percentaqe cars _ " " share A A 280 -14 260 - 12 240 4 u 10 220'. 8
200
-6
I I I I I I I 1: Ar 1974 76 78 80 82 84 86Figure 2 The number of cars owned by personal businesses and as a
percentage share of total number of cars (cars in use) 1974-1985.
It would be difficult to estimate the number of personal business cars before 1974 as the information concerning the number of businesses in the Central Business Register (CFR) before that year is incomplete, therefore
this has not been done.
2.3 Leased Cars
The number of cars that are leased i.e. rented for a period of at least one year to one user, has varied substantially over the period 1970 1985, as is shown in figure 3.
Between 1970 and 1978 the number of leased cars increased from 5 000 to 87 000. Between 1978 and 1980 this number decreased by approximately 34 000. The main reason for this was the decrease in the number of company cars in use, as the majority of leased cars are leased by companies.
Number Of Percentaqe cars share 140 Al ll 120 d - 6 100' - 5 80"1 #- 4 603~ - 3 40 - 2 20 - 1 u u r r I I I . ; . = Ar 1970 72 74 76 78 80 82 84 86
Figure 3. The number of leased cars and as percentage share of the
total number of cars (cars in use) 1970 1985.
During the period 1982 1985 between 85 90 percent of the total number of leased cars were leased by companies and personal businesses.
Over the period 1981 1985 the number of leased cars has increased again
and in 1985 there were 127 133 cars, an increase of a little more than
73 000.
An investigation of company and personal business cars for 1982* shows that companies leased approximately 77 percent of the total number of leased cars and personal businesses approximately 10 percent.
Table 2. The number of leased cars (cars in use) 1982 1985
Company and
Year Number personal Individual
business cars 1982 66 020 56 780 9 2#O** 1983 7# 274 63 508 10 766 198# 91 874 79 038 12 836 1985 127133 105 718 21 #15 Source SCB
* Juridiska personers och personliga foretags personbilsinnehav 1982
VTI working paper 1984 Peter Cardebring and U11 Linderoth
** Approximate estimation based on the proportion of cars leased by individuals 1983-198LL.
10
3 A CROSS-SECTIONAL ANALYSIS OF CAR OWNERSHIP
FOR 1982
3.1 Company car ownership
3.1.1 Number of cars in use in different sectors
The Swedish economy can be classified into the following five sectors:
1- State Sector
2- Local and Regional authorities
3 Private companies
4 Personal businesses
5 Household sector
The number of cars in use within these sectors were as follows:
Within the State sector there were 5 267 cars, in the Local and Regional Authority sector 5 325 cars, in the private company sector 194 729 cars, in the personal business sector 224 504 cars and in the household sector 2 506 001. The total number of cars in use was 2 935 985.
The company sector (according to the definition on Page 2), i.e. sectors 1 to 3 inclusive, owned 205 480 cars.
11
Table 3. The number of cars (cars in use) according to institutional
sector at the end of 1982.
The Swedish National Number of cars Percentage
Standard industrial in use Distribution
classification of the
economic activity of
the owner (SNI) 1969
1 State 5 267 0,2
2 Local and Regional
Authorities 5 325 0,2
Other Public Institutions 139 0,0
TOTAL PUBLIC SECTOR 10 731 0,4
3 Private Companies 194 749 6,6
TOTAL COMPANY SECTOR 205 480 7,0
4 Personal businesses 224 504 7,6
5 Households 2 506 001 85,4
TOTAL NUMBER OF CARS IN USE 2 935 985 100,0
The number of leased cars was 66 020 in 1982 and they were distributed between the sectors according to Table 4.
Table 4. The number of leased cars (cars in use) according to
institu-tional sector at the end of 1982.
The Swedish National Number of cars Percentage
Standard industrial in use Distribution
classification of the
economic activity of
the owner (SNI) 1969
1 State 112 0,2
2 Local and Regional
Authorities 648 1,0
TOTAL PUBLIC SECTOR 760 1,2
3 Private companies 49 900 75,6
TOTAL COMPANY SECTOR 50 660 76,8
4 Personal Businesses 6 460* 9. 8
5 Households 9 240* 14,0
TOTAL NUMBER OF LEASED CARS 66 020 100,0
* The distribution between personal businesses and households is based on the distribution in 1983 and 1984.
12
A majority of the leased cars, a little more than 75 percent, are leased by private companies while the State and Local and Regional Authorities only lease a small share, somewhat more than 1 percent altogether.
The distribution between personal businesses and households is a little uncertain but the total for those sectors is more reliable, approximately 23 24L percent in 1982.
3.1.2 Number of cars in use within different economic sectors
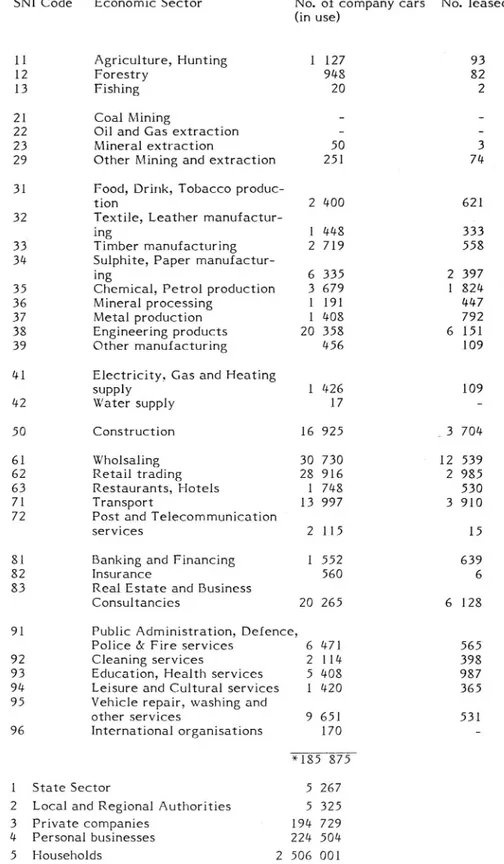
The majority of company cars fall within theManufacture, Construction, Wholesale and Retail trade and Real Estate sectors. These economic sectors together owned 120 000 cars in 1982 or 57 percent of all company cars, as is shown in Table 5. Of these 32 000 were leased Le. 48 percent of
all leased cars.
13
Table 5. The number of cars owned by companies for different sectors
in 1982
SNI Code Economic Sector No. of company cars No. leased
(in use)
11 Agriculture, Hunting l 127 A 93
12 Forestry 948 82
13 Fishing 20 2
21 Coal Mining -
-22 Oil and Gas extraction -
-23 Mineral extraction 50 3
29 Other Mining and extraction 251 74
31 Food, Drink, Tobacco
produc-tion 2 400 621
32 Textile, Leather manufactur
ing 1 448 333
33' Timber manufacturing 2 719 558
34 Sulphite, Paper manufactur
ing 6 335 2 397
35 Chemical, Petrol production 3 679 1 824
36 Mineral processing 1 191 447
37 Metal production 1 408 792
38 Engineering products 20 358 6 151
39 Other manufacturing 456 109
41 Electricity, Gas and Heating
supply 1 426 109 42 Water supply 17 50 Construction 16 925 _ 3 704 61 Wholsaling 30 730 12 539 62 Retail trading 28 916 2 985 63 Restaurants, Hotels 1 748 530 71 Transport 13 997 3 910
72 Post and Telecommunication
services 2 115 15
81 Banking and Financing 1 552 639
82 Insurance 560 6
83 Real Estate and Business
Consultancies 20 265 6 128
91 Public Administration, Defence,
Police (Sc Fire services 6 471 565
92 Cleaning services 2 114 398
93 Education, Health services 5 408 987
94 Leisure and Cultural services 1 420 365 95 Vehicle repair, washing and
other services 9 651 531
96 International organisations 170 *185 875
1 State Sector 5 267
2 Local and Regional Authorities 5 325 3 Private companies 194 729 4 Personal businesses 224 504
5 Households 2 506 001
* Approximately 20 000 cars have not been distributable among the sectors
14
When the different economic sectors are studied in more detail, it can be
seen that within the Engineering product sector, there are 6 500 cars in machine manufacturing, 5 700 in transport equipment manufacturing and slightly less than 5 000 in metalwork goods.
Within the Construction sector there are 16 925 cars, of which 10 400 are
in construction trades and 6 600 are in the other housebuilding sectors. With regard to the Wholesale and Retail sectors the wholesale production
sector has 16 000 cars, wholesale consumer sector 8 500 cars and the car
retail sector 16 500 cars. Within the Real Estate and Business Consultan
cies sector it is the latter which dominates, with a little less than 17 300
cars.
3.1.2.1 Number of cars per employee and per company
In order to describe how company car intensive different economic sectors are, two measures have been used, K1 2 number of cars per employee and K2 = number of cars per company.
In Table 6 the results are shown and four groups can be identified;
economic sectors with K1 : 0.12, sectors with 0.8 _<_ K1 < 0.12, sectors with 0.06 E Kl < 0.8 and sectors where Kl < 0.06.
15
Table 6. The number of cars per employee and the number of cars per
company for different sectors in 1982 (cars in use). SNI Code Economic Sector Companies 1982 K1 K2
No. of No of No. of cars No. of cars Employees Companies in use in use
No. of No. of Employees Companies 11 zRgrkn ture,rhnnjng 17 700 2 731 0,06 0,41 12 Foresz 24 300 l 058 0,04 0, 90 13 Fi nng 800 139 0,02 0,14 21 Coal Mining
22 Oil and Gas extraction 13 100 332 0,02 0,91
23 Nhneralextractknm 29 Other Mining or extraction 31 » Food,[)rh g Tobacco produc
'Uon 69 900 1 581 0,03 1,52 32 'Text e,I.eatherrnanufactur-ing 34 900 1 415 0,04 1,02 33 Thnberi anufactu ng 54 300 2 797 0,05 0,97 34 Suh ute,Paperrnanufactur ing 134 600 2 882 0,05 2,20 35 (Zhenucah Petrolproductkmn 67 000 1 293 0,05 2,85 36 Nhneralproces$ng 25 400 681 0,05 1,75 37 IMetalproduc on 65 200 251 0,02 5,61 38 Engineering products 398 500 2 384 0,05 8,54 39 Chherinanufacnning 32 300 462 0,01 0,99
41 Electricity, Gas and Heating
supph/ 39 700 398 0,04 3,58 42 Water supply 600 41 0,03 0,41 50 ConsUmmjjon 213 700 13 300 0,08 1,27 61 Wu esahng 182 200 13 640 0,17 2,25 62 Reta nem ng 246 100 22 105 0,12 1,31 63 Restaurants, Hotels 56 300 4 166 0,03 0,42 71 Transport 182 400 7 622 0,08 1,84
72 Post and Telecommunication
sennces 117 800 13 0,02 162,7
81 Banking and ,Financing 55 000 881 0,03 l, 76
82 Insurance 41 200 464 0,01 1,21
83 Real Estate and Business
Con-yntancjes 148 700 23 783 0,14 0,85
91 Public Administration, Defence,
Police 5c Fire services 803 060 536 0,01 12,05
92 Cleaning services 34 800 l 207 0,06 1,75
93 Educathniieal wservkxs 567 400 19 219 0,01 0,28 94 Leisure and Cultural ser
vices 39 100 6 779 0,04 0,21
95 Vehicle repair, washing and
othersehnces 59 300 4 508 0,16 2,14
96 International organisations 100 49 1,70 3,47
3 725 400 136 717
16
According to this ranking the most car intensive sectors are: Wholesaling, Vehicle repair, washing and other services and Retailing (K1 3 0.12). Then
follows the Construction and Transport sectors (0.08 5 K1 < 0.12) and the
Farming, Forestry and Cleaning services sectors (0.06 5 K1 < 0.08) as well as other sectors (Kl < 0.06).
When the measure K2 is used the, pattern changes. The following four groups average: K2 _>_ 50; 10 5 K2 < 50; 5 E K 2 < 10 and K2 < 5. The Post and Telecommunication service sector is" the most company car intensive, followed by Public Administration, Defence and Police (10 3 K2 < 50),
Metal manufacturing (5 5 K2 < 10) and then the remaining sectors. (K2 < 5).
The reason for this change in pattern when the measurement used is that
of number of cars per company, (K2), is that the sectors with the highest
K2 values have relatively few companies, which are often public institu
tions such as the Post Office.
How many cars are there and how company car intensive is the car sector, from manufacturing to retailing? If the company cars in use in 1982 in the sectors car and engine manufacturing, transport equipment wholesaling, car retailing as well as car repair workshops are added together, the total is 32 500, which is approximately 16 percent of the total number of company cars. Table 7 below showsthe distribution between the different sectors.
Table 7 The number of cars per employee and the number of cars per
company, within the car industry in 1982 (cars in use).
SNI Code Economic Sector No. of cars Kl K2
in use No.cars No.cars
in use in use
No. of No. of
Employees Companies
3 843 Car and Engine
manufacturing 5 080 0,06 16
6 131 Transport equipment 3 086 0,42 7
6 241 Car retailing 16 515 0,54 9
9 513 Car repair workshops 7 871 0,37 4
32 552
17
The car sector itself is very company car intensive as the Kl values show, with top values of one car per two employees in the car retailing group. It is worthwhile pointing out in this context that new cars are sometimes registered by car dealers while awaiting buyers, and this can lead to an upward bias in the figures.
The K2 values i.e. number of cars per company are also rather high, which
reflects the structure of the car sector.
3.2 Personal business car ownership
3.2.1 Number of cars within different economic sectors.
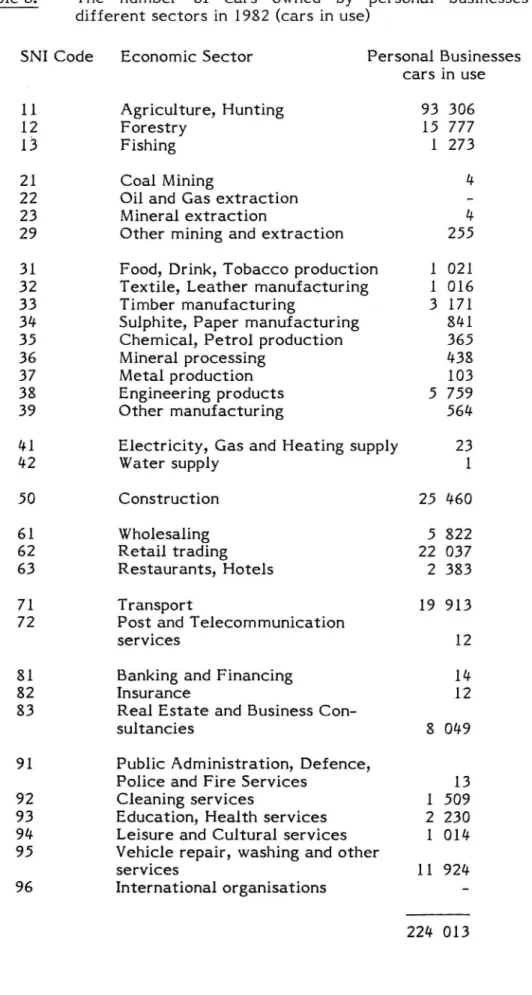
Of the total number of cars owned by personal businesses, 42 percent are within the Agriculture and the Hunting sector.
Next in importance are the Construction, Retailing and Transport sectors, Forestry, Repair of vehicles, washing and other services. Together these sectors comprise 95 000 cars or little more than 42 percent of total personal business cars.
In the Transport sector a little more than 8 000 cars belong to taxi owners and ll 000 cars belong to freight haulage companies.
Table 8. The number
18
different sectors in 1982 (cars in use)
SNI Code 11
1.2
13 21 22 23 29 31 32 33 34 35 36 37 38 3941
42
50 61 62 63 71 72 81 82 83 91 92 93 94 95 96 Economic Sector Agriculture, Hunting Forestry Fishing Coal MiningOil and Gas extraction Mineral extraction
Other mining and extraction Food, Drink, Tobacco production Textile, Leather manufacturing Timber manufacturing
Sulphite, Paper manufacturing Chemical, Petrol production Mineral processing
Metal production Engineering products Other manufacturing
Electricity, Gas and Heating supply Water supply Construction Wholesaling Retail trading Restaurants, Hotels Transport
Post and Telecom munication services
Banking and Financing
Insurance
Real Estate and Business Con sultancies
Public Administration, Defence, Police and Fire Services
Cleaning services
Education, Health services Leisure and Cultural services Vehicle repair, washing and other services
International organisations
VTI RAPPORT 305A
of cars owned by personal businesses for
Personal Businesses cars in use 93 15 1 r -N r -11 224 306 777 273 4 4 255 021 016 171 841 365 438 103 759 564 460 822 037 383 913 12 14 12 049 13 509 230 014 924 013
19
3.2.1.1 Number of cars per employed and per personal business
Cars that are owned by personal businesses are used in a slightly different way than cars owned by companies. The majority of personal business cars are regularly used for both private and business purposes. A prime example of this are the cars in the Agriculture sector.
In order to be able to compare personal business cars with company cars, the same intensity measures have been used i.e. K1 (number of cars per employed and K2 (number of cars per personal business for different
sectors.
In Table 9 below the economic sectors are shown and a division into three
groups of the Kl values is indicated; sectors with Kl _>_ 0.5, 0.3 _<_ Kl < 0.5 and K1 < 0.3.
20
Table 9. The number of cars per employed and the number of cars per
personal business for different sectors in 1982 (cars in use).
SNI Code Economic Sectors Personal Businesses
No of No. of No.cars No.cars
employed personal in use in use
business businesses No. of No. of
owners employed personal
businesses 11 Agriculture, Hunting 144 200 105 962 0,65 0,88
12 Forestry 25 400 21 495 0,62 0,73
13 Fishing 4 000 1 978 0,32 0,70
21 Coal Mining
22 Oil and Gas extraction 400 324 0,65 0,80
23 Mineral extraction
29 Other Mining and extraction 31 Food, Drink, Tobacco
produc-tion 3 900 1 199 0,26 0,85
32 Textile, Leather
manufactur-ing 4 200 1 469 0,24 0,69
33 Timber manufacturing 7 300 3 501 0,43 0,91
34 Sulphite, Paper
manufactur-ing 2 600 889 0,32 0,95
35 Chemical, Petrol production 700 407 0 , 52 0 , 90
36 Mineral processing 2 000 554 0 , 22 0 , 79
37 Metal production 400 116 0 , 26 0 , 89
38 Engineering products 10 200 5 650 0 , 56 1, 02
39 Other manufacturing 2 300 683 0 , 25 0 ,83
41 Electricity, Gas and Heating Supply 42 Water supply 50 Construction 57 200 26 140 0,45 0,97 61 Wholesaling 11 500 5 583 0,51 1,04 62 Retail trading 67 500 24 083 0,33 0,92 63 Restaurants, Hotels 14 500 3 311 0,16 0,72 71 Transport 40 800 17 399 0,50 1,14
72 Post and Telecommunication
services - - -
-81 Banking and Financing
-82 Insurance
-83 Real Estate and Business
Consultancies 21 300 10 975 0,38 0,73
91 Public Administration, Defence,
Police and Fire services
-337 0 , 23 1 , 13
92 Cleaning services 6 500 1
93 Education, Health services 10 900 2 443 0,20 0,91 94 Leisure and Cultural
services 11 500 1 237 0,09 0,82
95 Vehicle repair, washing and
other services 42 000 13 585
489 560 250 320
21
According to this ranking we can see that in terms of cars per employed the Agriculture and Hunting sector ranks highest, followed by Forestry, Oil and Gas extraction, Engineering products, Chemical production, Wholesaling and Transport. All have Kl values of 0.5 or more, which means that there are 2 persons employed per car.
Kl values between 0.3 0.5 comprise the sectors Timber manufacturing,
Sulphite and Paper manufacturing, Construction, Retailing, Real Estate
and Business Consultancies as well as Car Repairs, washing and other services.
The other sectors all have Kl values less than 0.3.
If the measure K2 is used, a similar pattern across all sectors emerges. It seems that there is, on average, one car per personal business when all K2
values are within the interval 0.7 - 1.15.
22
4. PRIVATE USE OF COMPANY CARS
How many of the cars owned by companies are also used for private purposes? One way of estimating this is to see how many people are taxed for the benefit of having a free car.
Employers whose employees also use their company cars for private purposes have to report this to the taxation authorities because this benefit is liable for tax as well as being included in the company's social
payments.
This information from the employer shows that an increase in the number of beneficiaries has taken place between the end of the 19705 and 1984, as
shown in the Table below.
Table 10. The number of beneficiaries of free cars 1979-1984.
Year No. of beneficiaries Percentage share
of free cars of company cars
1979 071 000 35 1980 X84 000 43 1981 97 000 49 1982 X103 000 50 1983 109 500 49 1984 127 800 52
The number of beneficiaries is probably more than these figures suggest as it is likely there are recording problems in the process by which these figures are reported to the taxation authorities.
0 Estimated by a sample survey 1979 X Calculated 1980, 1982
23
According to the Department of Finance there were a little more than
200 000 beneficiaries of free cars in 1986.
The benefit of having a free car is estimated on the basis of the average costs of owning a car in different price and age categories for different yearly vehicle mileage categories.
Unless the beneficiary can show that his private use of the company car during the year has been less than 10 000 km he will be taxed for this vehicle mileage.
According to the annually issued instructions for estimating the benefits of having a free car, cars of the latest year model are divided into seven price categories and three age categories. Benefit values for different vehicle mileages are set for each category. The benefit value is also included in the social charges levied on the employer. Benefit value is then calculated on the. basis of an annual driving distance of 10,000
Kilometres.
Information is available for the years 1981, 1983 and 1984 regarding the number of people taxed for the benefit of having a free car. The other
years are estimated (see Table 10).
If the number of beneficiaries of free cars is calculated as a share of the total number of company cars, it can be deduced from the Table that approximately 50 percent of the cars are used for private purposes also. This share has increased since the end of the 19705 from approximately 35 percent to a little more than 52 percent in 19841.
It is worthwhile mentioning that people who own a personal business and are using their cars both for business and private purposes are not included in the number of beneficiaries of free cars. If one estimates that approximately 60 80 percent of the personal business cars come into this category, then approximately 145 000 185 000 cars (personal business cars) are used for both business and private purposes.
The total costs for the personal business cars are divided between business and private driving on the basis of the number of vehicle kilometres
24
driven for the respective purposesa.e Capital allowances are allowed on the basis of acquisition costs written off at 25 to 30 percent of the balance of the vehicle value. If, for example, the car is used for private purposes for
50 percent of its mileage, then between 12,5 and 15% of the capital costs
and 50% of maintenance, repair and petrol costs are attributed to business driving.
*In order to do this a driving log must be kept.
25
5 COMPANY AND PERSONAL BUSINESS CARS NEW
REGI-STRATIONS
During the 1980s the share of new registrations attributed to companies has varied between 30-38 percent and that of personal businesses between 7 8 percent, as the table below shows.
Table 11.
*Newly registered cars 1980-1985
New Registration
Year Number Percentage share, registered by
Companies Personal Households
business 1980 194 802 32 7 61 1981 191 #68 31 7 62 1982 220 998 30 7 63 1983 220 525 35 7 58 19841 234 922 35 8 57 1985 265 198 38 8 54 Source SCB
The company car share of new registrations shows how important they are
96*
for the new car demand
Another way of presenting this is to observe the length of time it takes until the stock of cars for each category has turned over (changed ownership). In Table 12 below, the turnover time has been calculated for the categories, Companies, Personal businesses and Households. The total number of cars has then been divided by new registrations for each
category.
New registration statistics are based on who the owner was on 3lst of December each year
** A figure of 10 percent should be added to the official newly registered company car figures, in order to include cars newly registered by individuals but which are used for both business and private purposes, and for which the employer pays a mileage allowance.
26
Table 12. Turnover time of car stocks (cars in use).
Year Companies Personal Households
Businesses 1980 3,1 17,1 20,8 1981 3,2 18,7 20,9 1982 3,3 14,5 17,4 1983 2,9 15,1 20,0 1984 2,9 13,3 19,8 1985 2,6 12,4 18,8
Turnover time for company cars is on average 3 years (2.6-3.3) with a drop in the last year. Personal business cars' turnover time has decreased substantially between 1981 1985, from 18.7 years to 12.4 years. The average turnover time over the period 1980 1985 was 15.2 years. House hold cars' turnover time over the period has, on average, been 19.6 years. The short turnover time for company cars reflects their intensive use; those cars are usually driven more vehicle kilometres in their first years, compared with individual cars, and are then exchanged.
As Table 12 shows, company cars are substantially younger compared with personal business cars. The personal business cars are more like household
cars in relation to their turnover time.
A survey has been made for 1982 of new registrations for different sectors. When turnover time is used as a measure the following results are
achieved.
The turnover time in the State sector was 8.2 years, in the Local and Regional authority sector 6.0 years, in the Private Company sector 3.0 years and in the Personal Business sector 14.1 years.
In Table 13 below, the number of new registrations and the turnover time in different sectors for private companies are presented.
Table 13.
27
The number of newly registered company cars and turnover
time for different sectors 1982 (cars in use).
SNI Code Economic Sector
11 12 13 21 22 23 29 31 32 33 50 61 62 63 71 72 8 1 82 83
91
92
93
94
95
96 No. of new registrations Agriculture, Hunting 173 Forestry 160 Fishing 1 Coal MiningOil and Gas extraction
Mineral extraction 10
Other Mining and extraction 70
Food, Drink, Tobacco production 735
Textile, Leather manufacturing 358
Timber manufacturing 679
Sulphite, Paper manufacturing 1 9341
Chemical, Petrol production 1 3#8
Mineral processing 376
Metal production #59
Engineering products 6 866
Other manufacturing 13#
Electricity, Gas and Heating supply 218
Water supply 1 Construction 3 509 Wholesaling 11 216 Retail trading 11 299 Restaurants, Hotels 505 Transport 5 500
Post and Telecommunication services l#33
Banking and Financing 605
Insurance 208
Real Estate and Business Consultancies 6 833
Public Administration, Defence, Police
6c Fire services Cleaning services
Education, Health services
Leisure and Cultural services
Vehicle repair, washing and other services
International organisations
VTI RAPPORT 305A
561 l 5 15 316 3 797 41 60 000 Turnover time (years) O V U t 6, 5,
20,
W U ! O \ O W W W W N w-P -P w # O P N V W O O K »28
The. shortest turnover times are found in the following sectors: Chemical and Petrol production, Engineering products. Wholesaling, Retailing, Tran-sport, Banking and Financing, Real Estate and Business Consultancies, Education and Research, and Repair of Vehicles and Other services, all of which havea turnover time i 3.0 years.
Of these sectors, Engineering products, Wholesaling, Retailing, Transport and Real Estate and Business Consultancies comprised 67 percent of total company new registrations. Wholesaling and Retailing in 1982 comprised 22 515 newly registered cars or 36 percent.
How many cars are newly registered in the car production and retailing sector itself? In 1982 16 151 cars were newly registered in this sector or, expressed as a percentage, 26 percent of company new registrations.
Table 14. The number of newly registered cars within the car industry
I982 (cars in use).
SNI Code Economic Sector New Registration
3843 Car and Engine 2 346
Production 6131 Transport 1 813 Wholesaling 62% Car Retailing 8 687 9513 Car Garages 3 305 16 151
29
5.1 Companies' and Personal Businesses' new registrations (by car
model)
Because of their substantial share of total new registrations, it is
interesting to look at the type of car that Companies and Personal
Businesses buy.
For 1984 the 25 top selling car models have been investigated and divided at the year end according to owner type. Personal businesses in this case have been treated as ordinary individuals. The table below shows that the Volvo 200 series and the SAAB 900 series were most widely used as company cars while the least popular seem to have been the Nissan Micra, the Nissan Cherry and the Toyota Corolla.
Both the Audi 100 and the Ford Granada, relatively speaking, seem to be
bought more by companies than by individuals.
Table 15. The number of newly registered cars by owner type and car
model for 1984.
Type Total Individuals Companies
Volvo 200 38 041 19 064 18 977 SAAB 900 22 276 11 299 10 977 VW Golf/Jetta 13 790 10 184 3 606 Volvo 700 13 099 8 098 5 001 Ford Escort 10 358 7 979 2 379 Volvo 300 10 323 7 394 2 929 Opel Kadett 9 094 6 746 2 348 Ford Sierra 6 703 4 377 2 326 SAAB 90 5 893 4 922 971 Mazda 323 5 884 5 106 778 Opel Rekord 4 745 2 962 1 783 Opel Ascona 4 444 3 883 861 Mazda 626 4 367 3 439 928 Audi 100 3 993 1 629 2 464 Ford Fiesta 3 734 2 893 841 Ford Granada 3 636 1 627 2 009 VW Passat/Santana 3 524 1 877 1 647 Toyota Corolla 3 094 2 636 458 Mercedes 230/240/300 3 224 2 166 l 058 Nissan Cherry 2 876 2 374 502 Opel Corsa 2 781 2 026 755 Audi 80 2 571 l 615 956 Renault S 2 506 l 269 1 236 Mercedes 190 2 459 l 410 l 049 Nissan Micra 2 437 2 131 306
30
THE NUMBER OF PASSIVE CARS OWNED BY COMPANIES AND PERSONAL BUSINESSES
During the period 1977 1984 the number of passive cars owned by companies was, on average, approximately 95 000. The majority of these cars are in the car retailers' and car garages' store of traded in cars. During the period 1982-1984 there were, on average, approximately 85 000 traded-in cars registered by the car dealers. The development of the number of passive carsby companies and personal businesses is shown
in the table below.
Table 16. Year ending 1976 1977 1978 1979 1980 1981 1982 1983 1984
*Assuming 10 percent of total number of passive cars 1976 1981
VTI RAPPORT 305A
Owned by individuals Number 167 248 302 342 391 435 478 496 525 346 090 762 392 862 401 336 537 529 Personal Businesses* Thereof % Number 78,0 *21 000 73,4 34 000 77,6 39 000 75,9 45 000 79,6 49 000 83,2 52 000 84,4 58 214 84,8 66 309 83,3 80 013 % Owned by Companies Number 45 89 87 108 100 88 88 89 105 255 814 587 463 643 043 122 090 062 % 22,01 26,6 22,4
The number of cars not in use by owner type 1976-1984.
Total number of Passive cars 214 601 337 9042 390 349 450 855 492 505 523 444 566 458 585 627 630 591
31
As Table 16 shows, the number of passive company cars during the period 1977-1984, after the increase in 1977, was in the interval 87 500-108 500. This implies a certain stability. Taking account of the fact that the number of passive cars owned by individuals was continually growing, this suggest that passive company cars consist of cars that will return again
into traffic*.
Passive cars owned by individuals can be divided into three different categories. The first category, P1, consists of cars that are currently passive but which will become active again. Both categories P2 and P3 represent cars that will not return into traffic again, with P2 representing passive cars awaiting scrapping and P3 passive cars which will stay passive in the register indefinitely, without ever becoming scrapped**. Passive company cars, mentioned earlier, are one part of category P1. Figures for the number of passive personal business cars are available for the years 1982 1984. For the previous period 1976 1981 the number of passive cars in this category has been assumed to be 10 percent of the total number of passive cars, and they have characteristics different to passive company cars.
In 1982 there were 58 214 passive cars in this category and of them 16 000 were in the Agriculture and Hunting sector, approximately 9 000 in the Vehicle Repair and other services sector, approximately 7 000 in the Car Retailing sector and the rest of these passive, cars wereevenly distributed between the remaining sectors.
* An exception are the passive cars that are registered by scrap dealers while awaiting scrapping. At the end of 1984 there were 13 000 cars belonging to this category.
** For further analysis, see VTI Meddelande 445 Avstallda bilar och bilstatistiken ... ..
32
7 COMPANY CARS IN AUSTRALIA AND THE UNITED
KINGDOM A COMPARISON
Looking at other countries, what is the company car share of new registrations and how many company cars are there?
In the UK and in Australia three studies have been carried out which are interesting in this context: The company car in the United Kingdom as an instrument of transport policy by John Whitelegg, Company financed motoring and its effects on household car use by M.C. Dix and H.R.T. Pollard, and Company cars: Characteristics and Energy conservation potential by Kirsten Shou.
According to Whitelegg's study calculations in the UK for 1981 show that
there were 1.5 2.4 million company cars, which constituted 10-15
percent of the total number of cars. The corresponding Swedish company car share (active cars) was for the same year 6.8 percent. If passive company cars are included the share was 10 percent.
The company car new registration share was, according to the same study in the UK, little more than 45 percent and in 1980 as much as 70 percent. According to Shou the new registration share was 35 percent in Australia and in the State of New South Wales 44 percent.
In Sweden the company car new registration share has, on average, been
34 percent over the period 1980-1985. If the number of cars that are newly registered by individuals, but are used for business purposes where the employer pays a mileage allowance are included, an extra 10 percent should be added to the new registration share and the company car share
would then be approximately #4 percent see Chapter 5.
According to Shou's study, Australian company cars are on average used for three years before they are changed, which corresponds to the swedish company car turnover time, see Chapter 5.
33
Vehicle mileage travelled varies substantially for company cars with top figures of 80 000 km. per year in New South Wales. In Shou's study company cars are divided into two categories, management cars and field cars. Average vehicle mileage for the former category was 20 500 km. and for the latter 33 800 km. Those figures should be compared with the
average mileage in Australia at 15 100 km.
The number of company cars varies between countries which to a large extent can be explained by different tax laws and by varying definitions in each country. However, although the number of company cars may differ between countries there are certain similarities, for example in the case of the average turnover time.
As this report has shown company and personal business cars have different characteristics to individual cars. Company cars differ mainly in their short-term turnover time before they are changed, and thereby their big impact on new car registrations. Personal business cars also have a shorter turnover time before they are changed but are more like
indivi-dual cars.
The number of company cars has varied substantially over the period 1970 1985 which to a large extent is caused by changes in tax laws. Economic development has naturally also influenced the variations in the
number of cars.
The statistical picture of company cars and personal business cars has now been presented and the question naturally arises: How should a forecast model for company cars be designed in order to be able to anticipate and accurately predict their future development? The creation of such a model should be done in tandem with describing and explaining variations
in new car demand, a task for future research in the area.