V'I/meddelande
583A
1988
Fatigue characteristics of asphalt concrete
mixtures
*
Safwat F. Said
Veg-och Trafik- Statens vag- och trafikinstitut (VTI) * 581 01 LinkGping
nde
e V7'lmeddel _
583A
7.988Fatigue characteristics of asphalt concrete
mixtures
Safwat F. Said
VTI, Ll'nkdping 1 988
f, 7; Statens va'g- och trafikinstitut (VT/l ' 587 0 7 Linkb'ping
This study has mainly been conducted at the Department of Highway
Engineering. Royal Institute of Technology in Stockhom. It has been
supervised by Prof. O. Andersson. The complementary work and the
writing has been done at the National Swedish Road and Traffic Research Institute (VTI), Linkoping, at the expense of Swedish Road
Administration (W). I am grateful to those who have made the
critical comments and who have helped me to carry out this study.
Linkoping, November 1988
ABSTRACT .I
1. Introduction 1
2. Factors Influencing Fatigue Resistance 2
2.1 Mix variables 2 2.1.1 Bitumen ' 2 2.1.2 Aggregate influence 10 2.1.3 Filler 14 2.1.4 Void content 17 2.1.5 Stiffness 20 2.2 Environmental variables " 24 2.2.1 Temperature 24 2.2.2 Moisture content 24 2.3 Test condition 26 2.3.1 Loading mode ' _ 26
2.3.2 Fatigue life definition 31
2.3.3 Loading history 31
3. Testing Apparatus 42
4. Discussion and conclusions 52
References 60
This report presents the state of the art in investigating fatigue cracking of asphalt mixtures, due to repeated load applications in the laboratory. A review of research relating to bitumen content and type, aggregate, filler, void content, mix stiffness, temperature, and mois-ture content is presented. The effect of test conditions such as controlled-stress or controlled-strain mode, rest period, and simple or compound loading upon the fatigue response of asphalt concrete is illustrated. Fatigue test apparatus such as two-, three-, and four- point bending test, wheel'tracking machine, indirect tensile test, triaxial,
direct tension, and push-pull test are reviewed.
It is concluded from the comparisons between different apparatus that the test apparatus has a minor effect on fatigue results. Therefore it is reasonable to use the apparatus which is most economicaland practical. An acceleration in fatigue testing (for example, testing at high loading speed with large stresses and/or without rest periods) could give unreliable fatigue results if the effect of such variables is not already known. Therefore the test conditions must be chosen with care.
Neither the controlled-stress test nor the controlled-strain test can simulate the actual compound loading conditions that occur in the field. Nevertheless, the controlled stress test is more reliable and practical
than the controlled-strain test.
More attention is desirable concerning the superposition effect of the
variables influencing the fatigue resistance of the asphalt materials,
which could induce a dramatic change in fatigue life.
is an increasing demand for knowledge of mechanical porperties of the various pavements' elements. One of these properties is the fatigue resistance of the asphalt concrete mixtures, in order to use this in
analytical flexible pavement design methods.
This stydy presentsthe state of the art in investigating fatigue cracking of asphalt concrete mixtures due to repeated load applications in a laboratory.
Mix variables such as bitumen type and content affect the fatigue character to a high degree. The influence of aggregate grade, texture and type could result in a different fatigue resistance for asphalt ~concrete. Filler content has shown an optimum value for maximum
fatigue life. A change in void content of a mix is a consequence of
changes in compaction level, binder content or aggregate gradation. A minor change in void content may induce a large change in fatigue life of aSphalt concrete.
The effects of environmental variables such as temperature, which has
a vital role, and moisture on fatigue life have been illustrated. An
attempt has been made to clarify the essential effectof test conditions for fatigue response of asphalt materials. The fatigue results are a
function of the loading mode. The fatigue life found in controlled-strain mode may be several times the fatigue life found in controlled-stress
mode at the same strain level. The loading history such as rest period, simple or compound loading, speed .of loading and loading pattern effects on test results has been demonstrated.
Various types of test apparatus used in fatigue tests and their differences have been reviewed. These include bending tests, wheel tracking machine, indirect tensile test, triaxial cylinder, direct tension and push-pull test.
2. 2.1 2.1.1
FACTORS INFLUENCING FATIGUE RESISTANCE Mix Variables
Bitumen
Bitumen type and content are the most important mix variables which influences the mechanical prOperties of asphalt concrete mixtures through its content and grade.
Bitumen content
The effect of bitumen content on fatigue character and stiffness
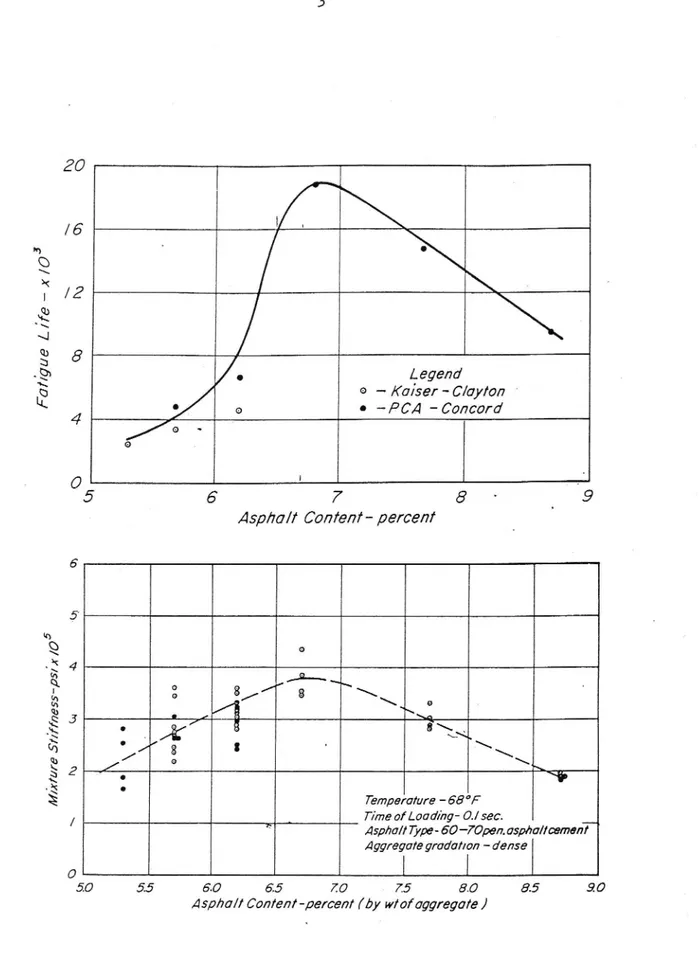
modulus of asphalt mixtures has been investigated by Monismith et al (1,2,3), Pell et al (4,5,6,7), Adedimila 6c Kennedy (8) and Barksdale 6: Miller (9). These investigations indicated that there is an optimal aSphalt content for fatigue life and stiffness modulus of mixes. Figure (1) indicates that maximum fatigue life occurs at the asphalt content resulting in the highest stiffness of the mixture, tested by
flexure method at constant stress 150 psi (1.03 MPa), with 60-70
pen. asphalt type. Figure (2) shows results obtained by the rotating
bending test with 197 pen. bitumen at constant stress 0.48 MPa.
There is a similarity to Figure (l) but the maximum fatigue life occurs at a slightly higher bitumen content than that reSulting in the highest stiffness modulus. Figure (3) shows the bitumen content -life relationship for a mix with 40/50 pen. bitumen. A significant
change in fatigue life may occur with bitumen content change even
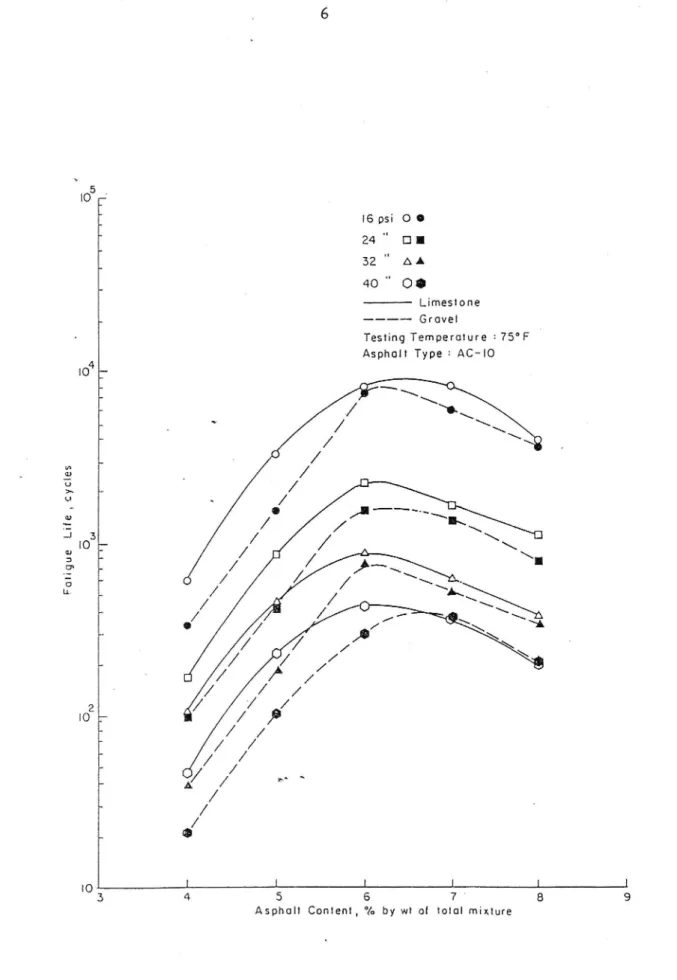
over a narrow range. Figure (4) shows the effect of asphalt content on fatigue life at different stress levels by indirect tensile test
(constant - stress mode), which also indicates a definite optimum
asphalt content for maximum fatigue life. According to Barksdale
and Miller (9) a small) increase in asphalt content of a mix can
greatly increase the fatigue life of the mixture. The fatigue life was significantly increased up to an asphalt content of at least 5.5
percent tested on black base mix in flexure test at constant load at
80°F (27°C). From the above discussion, it is concluded that a
change in asphalt content of a mix of : 0,2 percent, as allowed by
BYA (10), see Table (I), could change the fatigue life by more than
100% depending on asphalt content. ' I
l6 «3 0 Q \
><
, /2\
.
hi?
\I§ 8
,
.9» /. 4egend B o Ka/ser - C/ay/an " L o 0 - PCA - Concord 4 /0 ~ 0 i .a
'
f *
5 6 7 8 9Asp/ra/f Can/enf percenf
6 5. 0 Q o . f 4 a 0 // ) \\ in» o 8/ 8 \ \ a Q) 3 a 1 \\Q . t<0 o /. / 8 3 \ \ / \J m / o >
52 ~ .
W
.R g . Temperature - 68°F4 Time ofLoading- 0./sec. at / ' Asphalt Type- 60 -70pen. aSpha/lcemenr
Aggregate gradation - dense
0
l
l
50 5.5 6.0 6.5 Z0 7.5 8.0 8.5 9.0
Asp a/f Content -percen/ (by w/ ofaggrega/e /
Fig. 1. Effect of asphalt content on fatigue life and initial stiffness ' modulus (Ref. 1).
+4 8 \ g ) > .0 E 7 Q.) E 8 ' 6 Stress = 04 8 N/mm2 g ' __ 59;, / E 0) 5 g E . /
§ 4
}
a: M / 3 .102 103 104 ~ 105 106 10"I (a) Cycies to failure, N
8,000 7,000
6,000 ..
/ \
Stress = 0-48 N/mm2 / \6\
5,000 7 4,000 I \ 3,000 I / \ 0 1 2 3 4 S 6 7 8 9 10(0) Percentage binder content by weight
A
Dyn am ic st if fn es s (N /m mz)Fig. 2. Effect of binder content on fatigue life and dynamic
stiff-ness (Ref. 4).
'
10 machine N°'3 E '3' 9 Stress 165 o mx lbf/inz >~ B . A vo'd Vatles 5 7 content 5 Individual results 0 '5 6 . Mean results X §. 5
E
U z. 0. 3 10 103 10" 1o Cycles to failure N;Fig. 3 Relationship between fatigue life and bitumen content (Ref. 5).
Tab.l Permissible deviation of asphalt content from preScribed value (Ref. 10)
Max aggregate size Testing in plant or in trough :l6mm >l6mm Testing behind finisher :l6mm >l6mm Mean of three samples taken consecutively, : 0.2 i 0.4 % by weight. Value of indi- + 0.4 + 0.6 vidual sample, 0/o by wight.
' 5IO : t6 psi 0 0 24 " DI 32 AA _ 4o 00 Limestone _ --- --- Gravel Testing Temperature = 75°F Asphalt Type = AC-IO
IO4: L 3 _ U 3 a: .3 IO -m3 _. -. 3 b 5 n um _, 2 IO .7 '0 l l J J l 3 4 S 6 7 8
Asphalt Content, °/o by wt of total mixture
Fig. 4 Effects of aggregate and asphalt content on fatigue life. (Ref 8).
concrete mixtures has been studied by various investigators.
Monismith et al (1,2) have concluded that the mix with hardest
asphalt cement type has the longest fatigue life and the flattest
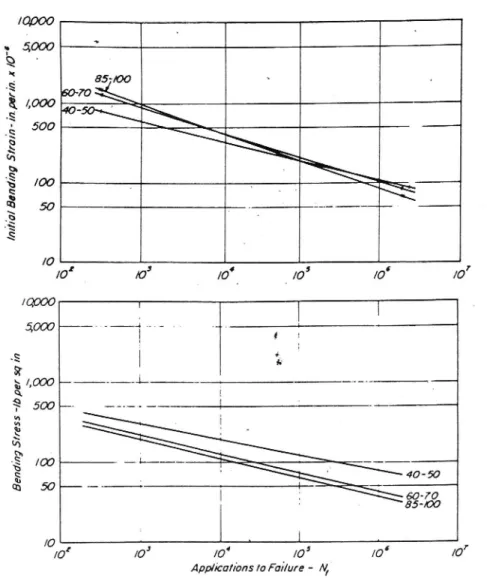
slope in stress versus fatigue life relationship. This conclusion is correct even for the initial strain versus fatigue life relationship,
but only at relatively low stresses, see Figure (5). These data were found by controlled stress-test on California medium grading aggregate with 6 percent asphalt cement.
/0,000
, 5000
Q ~ . 2 L0 35400:
70:4\\
23 4000 H0-
,
500 \ Q N {a Q S0 100 4' S \ Q) 50 I . _____. E § /0 t 3 4 5 5 7 /0 IO /0 _ /0 /0 /0 IQOOO j Iwoo
.
I
/,000 - L . - __ l 500 Be nd in g St re ss -/ 0p er sq in8
/0 l J /0 /0App ca/ions I0 Fai/ure
Fig. 5 Effect of asphalt penetration on the mixture fatigue life
(Ref. 1).
Pell et al (4,5,6,7) have-used the rotating bending test at constant stress
levels. The mix with hardest (40/50 pen. grade) bitumen has shown
longer fatigue life and flatter slope in the stress - fatigue life relationship.
Bazin and Saunier (11) have represented the effect of bitumen grade on
fatigue life in initial strain versus fatigue life relationship, see
Figure (6), found by constant stress test on trapezoidal shaped specimens at 100C. These results agree with the results found by Monismith et al, that the harder bitumen produces a longer mix life, at lower strains.
However, Arand (12) has found that the effect of bitumen hardness on the fatigue life of asphalt pavements is a function of temper ature,
when the thermal induced tensile stresses (temperature gradient
-lO°C/h) superimposed with bending stresses caused by traffic loading. ,
"A 10" SANDSHEET 40/50 ---- -- SANDSHEET 180/220 - e- cause MIX 40/50 7 -- DENSE Mix 150/220 10 \ \ \ \ cousuur srness AT 10 !) \ \ \\ . , soc/s \ 1° \ \ \ \ \ \ \\ \ \\ 1°5b \ _ \ 10 - 103-l 1444 - :-10 4 a
Fig. 6 Effect of bitumen grade (Ref. 11).
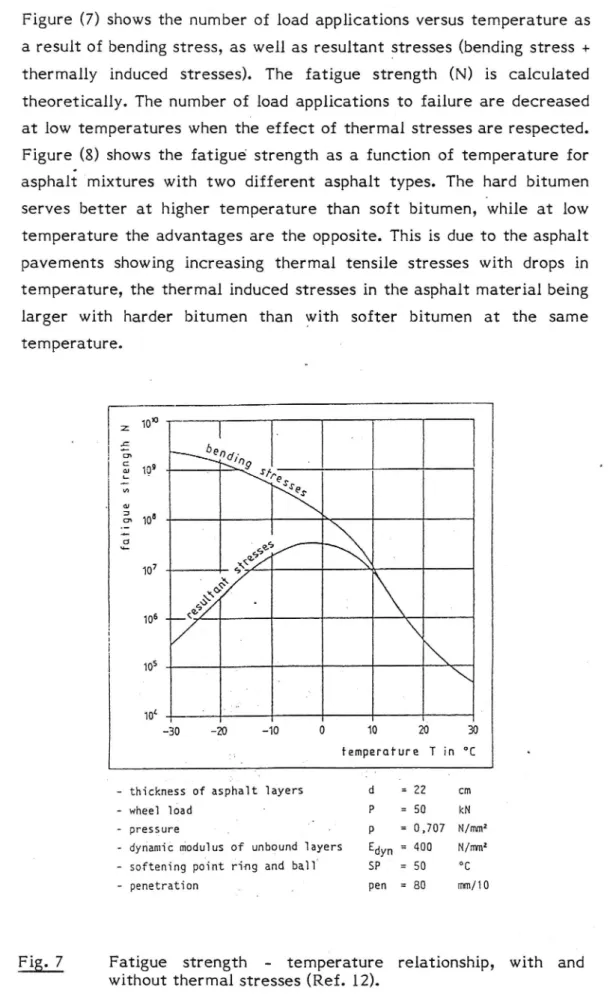
Figure (7) shows the number of load applications versus temperature as a result of bending stress, as well as resultant stresses (bending stress + thermally induced stresses). The fatigue strength (N) is calculated theoretically. The number of load applications to failure are decreased
at low temperatures when the effect of thermal stresses are respected.
Figure (8) shows the fatigue strength as a function of temperature for
asphalt mixtures with two different asphalt types. The hard bitumen serves better at higher temperature than soft bitumen, -while at low temperature the advantages are the opposite. This is due to the asphalt pavements showing increasing thermal tensile stresses with drops in temperature, the thermal induced stresses in the asphalt material being
larger with harder bitumen than with softer bitumen at the same
temperature. 2 10 I :E be E 199 XQ f e '3 :59: cu \ 5 _ 4§ L / __ \\\\\\V . 7 \§E/// 10 _ K 9 o
o o/
'
\
105 , - I ' N\\\\ 10 _ -30 20 ~10 O 10 20 30 temperature T in °C- thickness of asphalt layers d = 22 cm
-» wheel load - p = so kN
~ pressure . 3 -' p = 0,707 N/mm2 « dynamic modulus of unbound layers Edyn = 400 Want2 - softening point ring and ball. SP ' = 50 °C - penetration , , ' pen = 80 mm/lO
Fig. 7 Fatigue strength - temperature relationship, with and without thermal stresses (Ref. 12).
_ fa ti gue -s tr en gt h: ng .- Q° '
\
/
l 1/
\
-30 -20 -10 0 10 20 30 temperature T in °C
7 thickness of asphalt layers d = 22 cm
,g §h¢e1 load P = 50 RN
4 pressure p = 0,767 N/mm
- dynamic modulus of unbound layers Edyn = 480 ka
gt softening point ring and ball SP = 50/65 °C
-¥'penEtration pen = 39/20 mm/TO
Fig. 8 Fatigue life - temperature relationship under bending + thermal
stresses. (Ref. 12) 2.1.2 Aggregate Influence
The aggregate materials influence the behavior of a mixture probably through its gradation and type. The majority of asphalt concrete volume consists of aggregate material. However, there are studies by various
investigators which indicate the negligible or very slight influence of
aggregate materials on fatigue resistance of asphalt concrete mixtures.
These include Monismith et al (1,2,3,13,l4), Pell et al (4,5,6,7,), Barksdale and Miller (9), Bazin and Saunier (l l) and Kirk (15).
From the literature review, it seems that the investigations of the
effect of aggregate on mixture characters have been some- what
limited, because desired changes in aggregate gradation or type result
in associated changes in other variables. For example, a change in aggregate gradation produces a change in air void content and the optimal asphalt content, which in turn has a dominant effect on
stiffness modulus and fatigue resistance of mixes. However, the
investigators concluded that for good fatigue performance and high stiffness an aggregate should be rounded to allow effective compaction,
having high crushing strength to prevent fracture during compaction, a coarse surface texture, well graded, and dense to give maximum density. Monismith et al (13) concluded that, aggregate characteristics
are dependent on the loading conditions and the thickness of the asphalt layer. The surface texture has little influence on thick pavements ( :4 in) and no influence on thin pavements ( _<_2 in). Dense gradation is recommended for thick pavements and open or gap-graded aggregate for thin pavements.
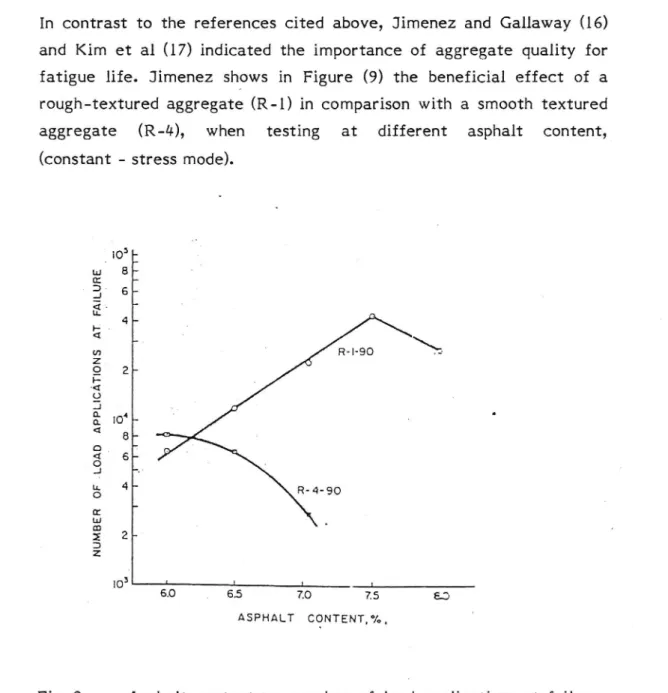
In contrast to the references cited above, Jimenez and Gallaway (16)
and Kim et al (17) indicated the importance of aggregate quality for
fatigue life. Jimenez shows in Figure (9) the beneficial effect of a
roUgh-textured aggregate(R-l) in comparison with a smooth textured aggregate (R-4), when testing at different asphalt content,
(constant - stress mode).
_ io5: ,Lu 8 r . m l . 6 _ E; __ . 4 ~ p. 4 q I -U) 2 . 9 2*-g. 4 2 .J I 3 10 -d 8 _
2- *
o 6-_, _,. u. 4 O a: _2.:
2 2 ~ 3 2 i03 L 1 1 1 so , 65 7.0 7.5 a: ASPHALT CONTENT,°/o.Fig. 9 Asphalt content vs. number of load applications at failure,
standard, (Ref. 16). 1
12
Kim has studied the effect of aggregate type on fatigue life at two
different compaction levels with conditioning specimens by freeze -thaw cycles to evaluate the influence of moisture. Dynamic diametral
test (Indirect tensile test) was used with probably constant stress (unable to accurately determine the loading mode). Figure (10) shows strain - repetitions to failure relationships for a low quality .aggregate (North Oakland - Sutherlin) with low resilient modules and a good
quality aggregate (Castle Rock - Ceder Creek) with high resilient
modulus. The. authors have used a parameter called the conditioning
effectivness factor (CEF) to evaluate the aggregate quality. The CEF
parameter is defined as:
CEF: RCLmod/ (Nf, conditioned/ Nf, as-compacted)
Where
Modulus of conditioned sample RCLmod :
Modulus of as-compacted sample
Nf,conditioned = number of load applications to failure for conditioned sample at 50 microstrain Nf,as-compacted number.of load applications to failure for
as compacted sample at 50 microstrain A high value of CEF represents poor quality aggregate and a low value
of CEF represents good quality aggregate to conditioning cycles.
IIIIIHH r 11111111 I ITIIHII \ . AS Canon:th fa ~ " " Conditioned 2 I " 100 .5 ~ 3 w 3.! "Z a C "° 1: 36: cemoaczion II- a II: 91: comaction . .4 SO -' {I I 1 11111111 1 11111111 1 1 1111116 103 10 30° 1° Repetition: to F nlure North Oakland-Sutherlin. I LIIIHII 111111111 111111111 150 - As Comoactea 0A . . 'o "* u Condxuoned 3 *' 5 100 "'"" -« i b 3 .2 3 C .2 I: 97 : concoction . II: 90: cam «:10 I so I- D 1n \ 1 y 1 1 1111111 1 1 1111111 1 1 1111111 103 10' 3.03 105 Reoetitions to Failure
Castle Rock-Ceder Creek.
Horizontal tensile (Ref. 1 7).
Fig. 10
VTI MEDDELANDE 583A
14
Both aggregates are less affected after conditioning at a high level of compaction. At a low level of compaction, the high quality aggregate increased in fatigue life after conditioning when compared with the
as compacted samples (the applied load for conditioned samples was lower than that for the as-compacted samples, in order to maintain the same initial strain as as-compacted samples). The low quality aggregate
at low compaction level has shown lower fatigue life after conditioning
when compared with the as-compacted samples.
In the case of good quality aggregate, the modulus after conditioning
decreased and the fatigue life increased. When poor quality aggregate was used the fatigue life and resilient modulus of conditioning samples
decreased. (We should have in mind that normally the fatigue curves in a strain-fatigue life relationship show a higher number of load appli-cations for specimens with lower stiffness modulus than specimens with
higher stiffness at the same strain level). Kim et al concluded that the
quality of aggregate is an important factor for fatigue performance of
asphalt pavement mixtures.
Kirk (18) concluded from fatigue tests with flexural bending apparatus, at: constant sinusoidal force, the importance of aggregate gradation by
maximum size used and the ratio of fine aggregate to coarse aggregate.
2.1.3 Filler
Adding filler to a mix decreases the air void content, increases the mix stiffness and affects the optimal asphalt content. Therefore the filler could be considered as another fraction of the aggregate.
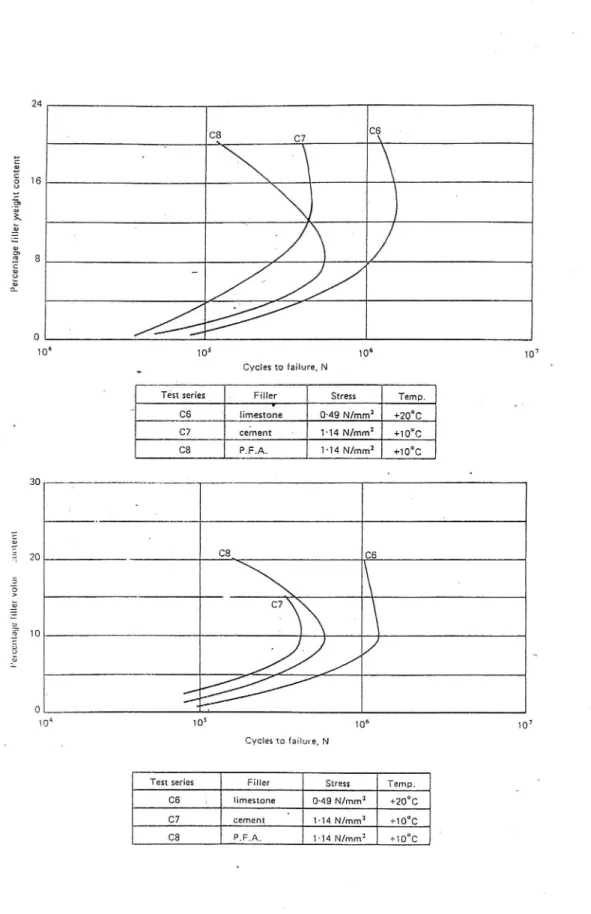
Pell et al (4,5,6,7,) have shown that there is an optimum filler content
for maximum fatigue life, and the filler volume is of prime importance
to minimize the air void content in the aggregate. Figure (l 1). shows the maximum fatigue life occurring at different percentage contents by weight of filler, but at the same percentage content of filler by volume
for three types of filler.
Kirk (18) concluded that when the filler was reduced below a certain limit the fatigue lifedecreased sharply.
Walter et al (19) indicate that the fatigue life increases with increasing
per-cent passing the 0.075 mm sieve (in a range of 2 to 10%) at 5 and 7 percent asphalt content. Conditioning the sample with freeze-thaw cycle emphasizes the importance of the fines and indicates that a mix
with 10% filler performs better in fatigue mode than a mix with 6% filler for tested mixtures. Increasing filler content results in decreasing
air void content.
Barksdale and Miller (9) studied the influence of filler type on fatigue performance of asphalt mix. The crushed stone mineral filler used in the standard mix was replaced with Portland cement or fly ash. The results indicate that use of fly ash filler instead of mineral filler will result in shorter fatigue life for the mix. Test results indicate that the fatigue life using Portland cement filler should be about the same as mineral filler and may even increase. Presumably the results of Barksdale and Miller agree with the conclusions of Pell et al when the effect of filler type with regard to weight per cent is considered.
The apporoximative variation range of filler content according to the
Swedish design specification and general advice (BYA) (10) is 5 to 11
per cent by weight, which is of a similar level to the optimal content reported in the literature.
i6 24 . CB 15 \
\l
/
\/
l
Pe rc en tage fi ll er yve ig htco nt en t _//
I 8 O A 10 10s 106 107 Cycles to failure, NTest series Filler Stress Temp.
cs limestone 0-49 N/mm2 +2o°c C7 cement I 1'14 N/mm2 +10°C ca P.F.A. 1'14 N/mm2 +1o°c 30 E 20 C8_ C6 2:; \ > A 53 C7 \\ \ 10 ' / / O . 10 1o5 106 107 Cycles to failure, N
Test series Filler Stress Temp. C6 limestone 0 49 N/mm2 +20°C C7 cement 1-14 N/mm2 +10°C
C8 -P.F.A. 1-14 N/mm2 +10°C
Fig. 11 Variation of fatigue life with volume of added filler -various fillers (see table) (hot rolled asphalt basecourse mix) (Ref. 4)
2.1.4 Air Void Content
The effect of void content on fatigue life and stiffness modulus of asphalt materials has been emphasized by various investigators. Monismith et a1 (1,2) concluded that the fatigue life of mixtures is affected by void content, shape of voids and void size. Therefore different mixes are affected by voids to different degrees, see Figure
(12).
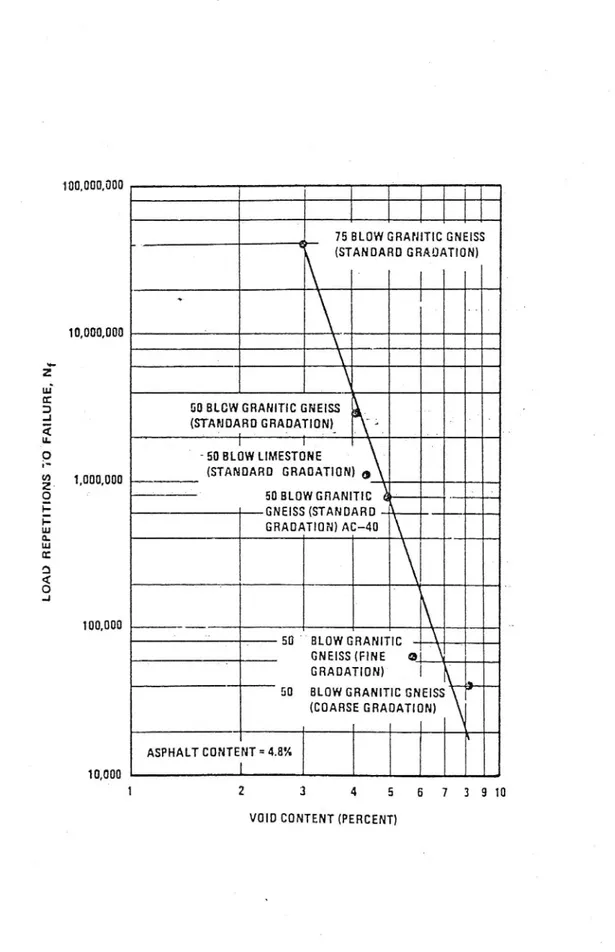
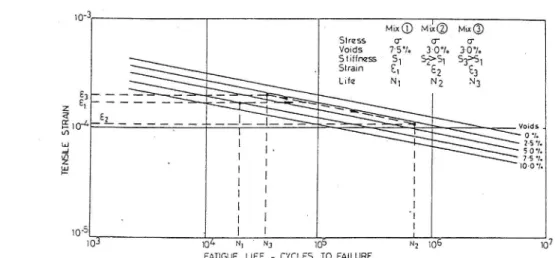
Barksdale and Miller (9) and Pell et al (4,5,20) obtained results indicating that the fatigue life of mixes decreases as the air void content increases by constant stress test. A change in void content of a mix is a consequence of changes in compaction level, binder content or
aggregate gradation.
Figures (13 and 14) show that a minor change in void content is needed
to change the fatigue life by more than 100 per cent. Hence, the allowable range of void content variation according to the Swedish
design specifikation and general advice (BYA) (10), which is shown in
Table (2), may induce a change in fatigue life of asphalt mixture of
more than 200 per cent.
Tab. 2 Allowable variation in air void content (Ref. 10).
Asphalt layer Minimum Air void content, vol 96
type thickness 7
of asphalt Mean value' Value of
layer individual kg/mé sample HABT, TOP 80 2-5 1-6 MABT 6O 2.5-6 2-7 AG 25,AG 32 110 5-10 4-11 AG 16 8O 5-8 4-9
4000.000 500,000 200,000 I00,000 50,000
,3 §
l0,000 Ap p/ It al ia ns IoFa il ur e IIE
g 18a. British Standard 594 grading ~ 19 percent asphalt.
4 6 6 10 I? /4 l6 /3 Void Can/an! - percent
[0,000 [o O 8
2 '2 E o o .33 . ; 3 /,000 § N t 0 .g \ R 500 - . i} . \
b. California fine grading - 6 percent
200' '" ' asphalt. l00 0 7 4 6 8 l0 VoidCan/en! pcrcenl l0,000 5,060 2 .\ ' 2,009 c. " ' 3 o \ 5" now v .ga \
.00
\x
Q.200 r 0. California coarse grading
-6 percent asphalt.
[000 2 4 6 8 l0
Fig. 12
VoidCarma! - perccnf
The effect of void content on fatigue life. (Ref. 1)
100,000,000
75 BLOW GRAPHTIC GNEISS \ (STANDARD GRAOATION)
10,000,000 ' ' \
Y
\
00 BLOW GRAHITIC GNEISS _ (STAMOARD GRAOATIDN)_ D " L-l I I . , ' 50 BLOW LIMESTONE ' (STANDARD GRAOATION) a 50 BLOWGRANITIC GNEISS (STANDARD GRAOATTON) AC-40 \ 100,000 \ 50 " BLOW GRANITIC GHEISS(FINE Q GRADATION)50 BLOW GRANITIC GNEISS (COARSE GBAOATION) 1,000,000 LO AD RE PE TI TI ON S TO DF AI LU RE , N, ASPHALT CONTENT = 4.8%
10,000
1
1
2
3
4
5
5 7 3910
VOiD CONTENT (PERCENT)
Fig. 13 Effect of air voids on fatigue performance at an asphalt
content of 4.8 percent (Ref. 9).
~
20
10'3 l
Mix® Mix® Mixy@
Stress 0' o- 0' Voids 7-5°/. 3~O°/. 3-0°/. snumss 1 s1 sys, s3>s1 X , Strain E, 52 E3 8 3 _ _ _ _ _ __ __ __ x. \ g E \ \
95104 2 --- '- -I
>~c \
._\\
m I I W \\o./ 4 l ' l 1% I I 1 10-0 1 " l - I I I ' I I I I | l : 10 5 t I I l 103 104 N. N3 105 N2 106 107FATIGUE LIFE - CYCLES TO FAILURE
Fig. 14L Effect of void content and stiffness on fatigue life of an
asphaltic mix (Ref. 20).
2.1.5 Stiffness
The fatigue life of asphalt mixtures is affected by mix stiffness or modulus, i.e. the relationship between the stress applied to the asphalt specimen and the strain induced in the specimen. Monismith et a1 (1,3), ' using data deduced by controlled-stress test in Figure (15), show the
stress versus fatigue life plot at various stiffnesses. The mix stiffness f affects the slope and position of the fatigue curve. Figure (16) shows the initial bending strain versus fatigue life with the same mix stiffness as in Figure (15). The fatigue curve here is also affected by change in stiffness but the difference in fatigue life due to stiffness differences is not as large as indicated on the stress versus fatigue life plot.
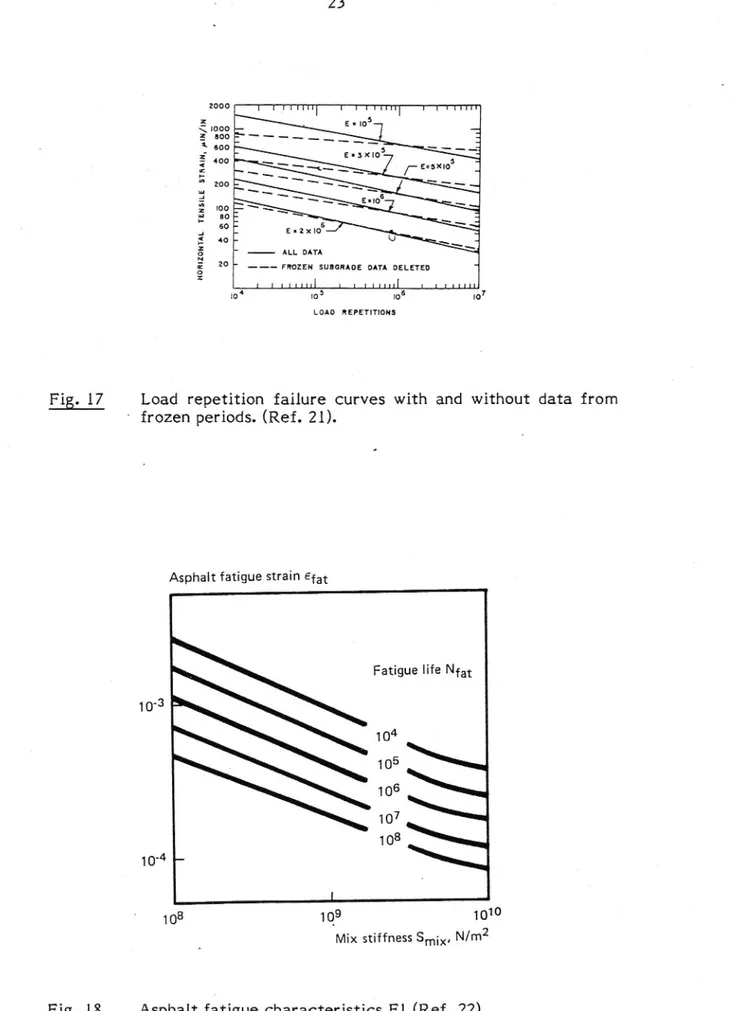
Kingham' (21) has developed fatigue curves from AASHO road test results which are shown in Figure (17) with the effect of stiffness on
fatigue life. The slope of the fatigue curves is not affected by change in
stiffness. Parallel fatigue curves have also been reported by Shell (22), see Figure (18).
The stiffness of asphalt mixtures is dependent on mixture variables such
as asphalt content and type (1,2,4,5,9), air void content (1,2,4,5,9,11,15) and aggregate type and grading (1,2,4,5,9,11). Even the loading mode
(loading magnitude, loading time, frequency) and environmental
ables such as temperature, moisture and ageing affect the stiffness result of asphalt mixtures, which in turn affects the fatigue character
of asphalt materials.
22 /0,000 5,000 S u u», g 4000 q $ 500 _ 22 u . \ .3 mo k b \ \\ .V \ \Q_.400'000 \ ~5= 300.000 5=200,000 ,0 \5:/50,000 /0 " /0 /0 /05 /05 /0 Fig. 15 -5 Fig. 16 In it ia lB en d/ 09 5/ ra /n -in pe r in 1/ 0 /0',000 5,000 /,000 \ 500, ' : . Q a 5nffness 0 - /50,000 4 mo M A 200,000 \ S - 300,000 6. 3, S=>0lg ia 50 _____A 400,000 s/SOO é .000 a 500,000 000 <ig- - -0 6-0-0,-0-0-0 ' 0 700,000 /0 I J /0 /0 /0 ,0, I06 N A pp/I'ca/Ibns /0 Failure f
Bending stress vs. application to failure for mixes of different stiffness - California graded mixes, granite
aggregate, 85-100, 60-70 and 40-50 penetration asphalts, 6.0 per cent aSphalt. (Ref. l).
, _ _ /0 .
App/Icanons to Fallure - N, .
Initial bending strain vs. application to failure, for mixes of different stiffness - California graded mixes, granite aggregate, 85-100, 60-70 and 40-50 penetration asphalts,
6.0 per cent asphalt. (Ref. 1).
2°00 I I lIlIITI I IIIHH I IIHHI 5 EIIO 6 EIZXIO
HO RI ZO NT AL TE NS IL E ST RA IN , FIN/ IN ALL DATA
2° -- FROZEN SUBGRADE DATA DELETED
1 11111111 1 1 1111111 1 1111111
i04 :05 106 107
LOAD REPETI HONS
Fig. 17 Load repetition failure curves with and without data from
frozen periods. (Ref. 21).
Asphalt fatigue strain Efat
Fatigue life Nfat
10-3 104 105 .106 107 108 104 -l
108
1Q9
1010
Mix stiffness smix, N/m2
Fig. 18
Asphalt fatigue characteristics F1 (Ref. 22).
21+
2.2 Environmental Variables
The effect of environment is as important a design variable as subgrade support and traffic in the structural design of an asphalt pavement.The environmental variables are temperature, moisture, ageing and other factors changing the material properties during service life.
2.2.1 Temperature
Due to the viscoelastic character of bituminous materials, temperature is an important factor in altering the asphalt pavement layer response to applied stresses. At low temperature the stiffness of a bituminous material is high and the elastic prOperties are predominant in bitumi-nous material reaction to applied stresses. Therefore at low tempera-ture and high stiffness the asphalt pavement layer can withstand relatively high stresses and low strains.
At high temperature, the stiffness is low and the plastic properties are predominant in bituminous material reaction to applied stresses. There-fore the asphalt pavement layer can withstand relatively high strains without damage but not high stresses.
. Hence the strains or deformations are critical at low temperatures while the stresses are critical at high temperatures.
2.2.2 Moisture Content
The damaging effect of moisture on asphalt materials has been studied through stripping resistance of asphalt film from aggregate. A
compre-hensive study of the literature regarding moisture damage to asphalt
pavement is presented by Taylor and Khosla (25%). It has been suggested that the role of traffic or repeated applied load in the presence of water is to create high pOre pressure resulting in stripping. Schmidt and Graf (25) have reported the effect of moisture content on resilient
which permit a sizeable amount of water. Figure (19) shows that the
drop in MR of ll-in. diameter, 8-in. tall specimen, was reversible when
the water was removed. A preceding section has shown that the fatigue resistance is highly affected by modulus, so any variables which affect the modulus will affect the fatigue resistance too. Lottman (26) has affirmed the increasing damage effect under repeated-load application when specimenswere moisture conditioned.
Kim et al (17) have shown in Figure (10) that the fatigue life is
affected by moisture content, when comparison is made between as-compacted specimens and freeze-thaw conditioned specimens with different compaction levels to study the effect of water, at different air void contents, on the fatigue life of asphalt mixtures. The difference in curves was greater for both aggregate types with higher air void content (low compaction level) than for fatigue curves with
lower air void content (high compaction level), which indicates the
increasing damage effect under repeated-load application in the
presence of moisture. The fatigue life after conditioning generally
increased compared with that of the as-icompacted samples. This is due in part to the fact that the load applied for conditioned samples, in order to test at the same initial strain, was lower than that for the
as-compacted samples (17).
Con ons
Aggregate -Cache Creek Gravel _
mop Gradation - l 0.3% Ambient
Asphalt * 5% of Asphalt C Vacuum Saturate Voids ~ 13. 3% 5. 2%
80 >_ Exposure ~ Variable / a: Type of MR - Direct Compresosion Ambient
2 or Tension, 73 F Desiccate / Z 60-Vacuum Saturate Q . wo. /mnmeMR a. 40 20" Note
Values on points are the weight percent water.
0 l l l l l l l l l l 0 20 40 60 80 100 120 140 160 180 200
Exposure, Days
Fig. 19
Effect of moisture on MR. (Ref. 25).
26 2.3 Test Condition
2.3.1 Loading Mode
The deterioration of an asphalt pavement layer is a consequence of a complex form of loading, which is a compound of different magnitude level and distribution of stresses and strains, temperature, moisture, ageing and loading speed. However, the majority of acquired experience regarding fatigue performance of asphalt mixture relates to the
controlled-load (the load is constant during testing) or the
controlled-deformation (the deformation is constant during testing) mode of fatigue loading which are two extreme simple-loading
condi-tions, (14,27). Figure (20) shows that the fatigue response of asphalt material is a function of mode of loading. The fatigue life with controlled-strain test is more than 10 times longer than fatigue life
with controlled stress test at the same initial strain level.
E
I _ Con/rolled SIM/n, \Qmp° '7 90 OF \ ~ \ 0 V . r- Cantral/ed Sire/n, \\ \ / Team: 68°F§
/ / In f/ fo l Be n di ng Si m/ n in. pe r fur /0 '6ream #63 F . \ \
M = 4.58170 "ON/51373
\ \\
\
/00 - \g\\ ./0 a i 0" l03 /04 ' /05 06Number of S/ress App/factions, IV
Fig. 20 Comparison of laboratory determined controlled-strain and
controlled-stress fatigue data. (Ref. 27). .
severe than the constant-strain mode, see Figure (21) which shows
fatigue life as a function of the initial strain at different rest periods
tested at 200C, with regard to the influence of the test mode.
Monismith and Decon (14) have used a mode factor in order to quantify the mode of loading (controlled stress or strain) which has a significant
effect on fatigue results of asphalt mixture. The effect of mode factor
is to intermediate the fatigue results between controlled-stress and
controlled-strain test mode, see Figure (22). The mode factor is defined
as:
where A: percentage change in stress due to a stiffness decrease of
C.
13': percentage change in strain due to a stiffness decrease of C, and
C: an arbitrary but fixed} percentage reduction in mixture
stiffness.
28
NFAT I06 8 in 5 _, MODE i K n r2 C.STRAIN o I.|xl0°6 -340 0.90 a '4 ~ , " 25 5.4x|0°5 «2.78 0.90 C.STRESS o Z.77x|O° 2 -447 0.99 " 25 7.1mm -434 0.99 2 _. 5 -- CONSTANT STRAIN IO ~ CONSTANT STRESS 8 y... 6 . 4 -2 ... \i=25 104 8 r-5 \i-O 4 . 2 ' L225 3 [O J 1 L l l 1 L 1 l 1 IO 4 2 4 6 810'3 2 4 6 aIO'2 5o
Fig. 21
Fatigue life (Nfat) as a function of the initial strain ( .) for
the 80/100 mix tested at 20°C. (Ref. 29).
Control/ed - 5Irain C nrrallc Stru': _-_ ¢ . _
l I l
i
l l i l In it ia l 5/ re ss ,0 (l og sc al e ) l l I Iancd/arc Marx/o YIN!!! Hod:. Mean 5erv/ce Life , N, {/09 scale} .
Fig. 22 Hypothetical fatigue diagrams illustrating effect of mode of
loading. (Ref. 14).
controlled-stress and controlled-strain tests by the energy dissipation
concept. Figure (23) shows the increase of the total energy dissipated
during fatigue tests as a function of the number of load repetitions. The
graph shows how the energy is absorbed more quickly at constant stress than constant strain. The dissipated energy per cycle per unit volume is
expressed by the following equation:
W: W . U . E . S n Q5
Where 0 and E are the stress and strain amplitude respectively and Q) is
the phase angle between the stress and strain wave signals during dynamic loading test. Figure (24) shows the total dissipated energy as a
function of the number of load applications at different temperatures, frequency test method (two or three-point bending) controlled-stress or
controlled-strain and two types of bitumen (#0/50 and 80/100 pen). The
fatigue life is predicted by the energy dissipated using the following equation:
1.
n (co/6°) sin ¢° 3:?
2
N: [[ 1' . 60:13
A w
Where do and eoare the initial stress and strain amplitude respectively
and Q) is the initial phase angle, kl! is a function of mix stiffness depending on test mode, see Figure (25), and A and Z are mix constants.
rout. annoy oussu-Atao. cm 1.0
./
COHSI MT STRAIN 0. . O 0/ 0.2 . /JV/
0.0 L I A L . l O 1 2 J £ 5 6nunaea or CYCLES. H.1o
0. I . O
CONSTANT /
STR ESS
Fig. 23 Total energy dissipated as a function of load repetitions for
constant strain tests. (Ref. 31). *
30
TOTAL DISSIPATED ENERGY TO FATIGUE AND FRACTURE POINTS. JOULE/m3
I04 2 4 6 3 I05 2 4 s 3 I06 2 4 s 8 I07 2 4 6 8 I08
0 I I T I I I I- I I I I I I I I I ~10 8 'n a 3 6"" 6 4 4
F:-2 -° . 2 9 » -09 08 ° _ 3 6 "' ... 5 4 - 4 2 -=- .. 2 103 -=8 480°. 6C 5 4 ~ 4 21 #2 o ,0? I I I I I I I I I I I L I I I I I I 07 I04 2 45805 2 4 6805 2 4 68107 2 4 62ana NJMBER OF CYCLES TO FATIGUE AND . I _W___ w FRACTURE
Fig. 24 Total dissipated energy up to the fatigue and fracture points as a function of the number of load applications for mix
AC-I. (Ref. 32).
Bonnaure et al (28) mentioned that measurements performed on a large number of mixes did not confirm this hypothesis.
In fatigue tests with controlled strain, the stress decreased with
increasing number of load applications in order to keep the deformation
or strain constant. This does not simulate field conditions, and caused the test to be stopped at an arbitrary number of load applications or when the stress decreased by half of its initial value, which is due to undefined failure in specimens. The controlled-stress test has a
well defined fracture and gives a more moderate fatigue life
estimation than controlled-strain. Additionally, the scatter in the
fatigue test result by controlled-strain mode is greater than the result found by controlled-stress mode (28). Even the beneficial effect of rest
time at constant stress is higher than in the constant strain test.
*8wmmg. wranoue 3 - o 40/50 pen. BITLWEN V 80/100 0-A 180/200 u zII-CONTROLLED STRAIN o A o 5 - _ 0 o .' . a A A v vvl! In 1 0.3-0 . 0.3- O 0 ~ . A ' M O o CONTROLLED STRESS Q in l l I I L l I I s a 10 z 4 s a 10 z 4 s o 10"
MM STIFFNESS MODULUS 5m , II/mz
Fig. 25 Relation of LP and Mix stiffness Modulus for the Asphaltic
Concrete AC-I. (ref. 32)
»
VTI MEDDELANDE 583A
2.3.2 Fatigue life definition
Fatigue life has been defined in terms of service life or fracture life. Service life is the total number of load repetitions required to decrease
the initial modulus (normally) by 50per cent (8,29,30,32), or the total
number of load repetitions at which the strain versus number of load applications curve deviates from linearity (8). Fracture life is the total number of load repetitions to cause a complete fracture of the specimen (5,8,34,19,35).
Goransson and Hultqvist (37) defined fatigue life as the permanent
deformation equal to 2 micrometer per load application, using indirect tensile test.
In controlled-stress test, the number of load applications to complete fracture does not contain a significant part of crack propagation time and the fracture is well-defined. In controlled-strain test, the fracture of the specimen is not well-defined. The test is stopped at an arbitrary number of load applications, usually when the stress decreased by half of its initial value.
2.3.3 Loading History
- Simple and compound loading
Fatigue behavior of asphalt materials has been extensively studied
by simple loading, which means the loading condition does not alter
throughout testing.
In contrast, the road is subjected to variable loading conditions
(stress amplitude, loading frequency and duration, temperature etc.) When the load condition is changed during testing, the specimen is
said to be exposed to compound loading. The results of compound
loading fatigue test are interpreted by Miners law (33,34,35).
32
q
n .
' «A.
M- i 2:3 l ( N i )
where M: Cumulative cycle ratio
q: total number of applied loading levels
n1: number of applied loading cycle at level i, and
Ni: fatigue life of the mix under simple loading fatigue
test at level i.
The cumulative cycle ratio (M) would be a unity, if Miners equation
could predict the compound-loading fatigue life. The predicted
compound-loading fatigue life (Np) is expressed as
l
NP:
lm/(Ni)
i = 1
P1: applied percentage of load level 1.
Ni: fatigue life of the mix under simple loading fatigue
test at level i. 0 Loading pattern
Figures (26) and (27) illustrate different types of loading patterns
which have been used in fatigue tests by means of microprocessor.
The loading pattern has a considerable influence on the response of
asphalt material.
o I O0 .1... _.._.___. _ 8 5 80 (c1) sinusoidal o C 0 i 8 3
W
(b) haversine
0/ L
A
E(c) cyclic loading
0I 1 ]
[ 1
E(d) cyclic.loading
Fig. 26 Types of loading pattern
VTI MEDDELANDE 583A
rime iime rime fime rime Time rime iime
31+
TYPE OF LOAD
HISTORY
Frequency = 55.6 Hz - Period 318 ms. - TR/ l'L - Rest lime/Loading time
TR/TL = o Tn/TL = 1 T,,/TL =- 2 CO C2 SIMPLE 1 level BLOCK 8 levels RANDOM 8 levels
Fig. 27 Compound test conditions, (ref. 33). Loading time
The effect of loading time on fatigue resistance and stiffness modulus of asphalt mixtures has been reported by various
investigators (6,27,31,35,36,39,#0).
The fatigue resistance of asphalt materials is highly affected by stiffness modulus, as has been discussed in the preceding section.
Therefore any variables which affect modulus value will change the
fatigue resistance of an asphalt mixture. Monismith (27) has studied the effect of loading time by running a flexure bending test with
0.1 sec and 0.02 sec loading time at different temperatures. Fig.
(28) shows the stiffness modulus is increased as loading time decreases, and the dependence of stiffness modulus on loading time increases as temperature is increased. Brown (36) shows in Fig. (29) that the stiffness is a function of loading time and temperature.
l Ionian II Jim Saith Pvt-I 8 13 '3 Ring and M 4C.Vow: 0. u7.1 S "0an ml! 3: (Phil WM! I c4 6 Latin, hp. 0.02 so:
MIA/ Hf . S I N / n u: M o d ul us , p 1 1 I Lalo», Inn./ 0.1 tr: . ! Ia
l
i
l
l I0 10 50 0 90 NO :10 150 Mixture I'unpororuro, '1Fig; 28 Dependence of stiffness of asphalt concrete on temperature
and loading time (Ref. 27)
Elastic 103 Visco - elastic Sb (M N Im 2) 10" -= 10"-10 3-lO" . 6 . 8 10'8 10 5 10" 10" 1 102 .10 _...10 ~40 Time (s)
Fig. 29 Bitumen stiffness as a function of loading time on tempera-ture (Ref. 36).
36
Van Dijk et al (31) studied the effect of testing frequency on fatigue resistance of bitumen film by constant stress amplitude tests at different temperatures. The apparatus used is a sliding plate microviscometer whose upper plate is subjected to controlled Cyclic vibrations. The straight run and blown bitumen film located between
the two plates (2 cm long and 0.8 cm wide) thus undergoes shear
stresses. Figure (30) shows the relation between fatigue life and initial strain at different frequencies and temperatures. For the same initial strain the life increases when the frequency decreases, and/or temperature increases. An increase in temperature and/or decrease in frequency induces a decrease in stiffness of bitumen. Strain versus
fatigue life relationships normally show higher fatigue resistance for
lower stiffness bitumen.
FATIGUE LIFE (NUMBER OF CYCLES TO RILUIIE)
1.10'1 l o u to" 2 t 5 I
* mum. snum
Fig. 30 Fatigue testing of bitumen:
Relation between fatigue life and initial strain (Ref. 31). Pell and Taylor (6) have subjected basecourse mix specimens to a
repeated constant stress amplitude at a temperature of 10°C, and the
speed of loading varied between 80 to 2500 r.p.m. Figure (31) indicates the fatigue life increased as the loading speed increased. A linear
relationShip was found for speeds of loading greater than 200 r.p.m.
Due to the viscoelastic characters of asphalt materials, the loading
time at which the tests is run is an important parameter. When studying
the mechanical properties of asphalt mixtures at low temperatures, the
elastic character in the asphalt materials is dominant, and the
materials are less affected by loading time. As the temperature is increased the viscous character becomes predominant in the asphalt
character, so that the loading time has an essential effect on the
mechanical properties.
3000 {I T Testing | rL! i V temperature. +10°C 5 3 Speed - Varies 2 000 i 3 Testing New i machine No.2 I Stress , level lbl [in 2 l ! i L ' Void cont nt 10m } "* j "" ' range .If 36 -6~2 900 h * t ' "l
c 800 - - ~ «- --~-i-- I Void content [(9
'. -. . Ir -1- -: mcm 7
E 600 " t" "' * g Individual 0
c 500 . I uh I. . q results
: Mean results X
g (.00 _ ' --- - ~~~ _
2 l i' 95 'I. con dence [ h 2 300 9 __E. __ limits on mean.
5 ;' . U m 200 ~~~ f - v
-i l I
.4 i | V s x l ,. .0. 4 . %,.J ..._ . 4 . l ..1 F-/ r4g la _ q ui u 80 L7 1 . 5 103 10" . 105 5 x 105 X102 . i _ Cycles to tailure NsFig. 31 Relation between fatigue life and speed of loading (Ref. 6).
38
Brown and Barksdale (39,40) respectively have emphasized that the
vehicle speed and the depth beneath the pavement surface are of great
importance in selecting the appropriate stress pulse time for) use in repeated-load testing, see Figure (32) Therefore, it isrimportant to run the tests under conditions actually encountered on the road if the effect of changing loading time, in order to accelerate the test, is
0 unknown.
1-0 -. SPEED Mun/N.)
III/4f 3
/ < < / v . I a, y 10 g 0:. . L29 6/" _a
//
5 ' .4/ J d// /.d>'- L0 ' / /> 50 / I 0/, / My 80 . ( 4 ,be,
0-01 v. m 200 300 too 500 600THICKNESS OF BHUHINIIS WER (m)
Fig. 32 Relation between loading time and thickness of bituminous
layer for various vehicle speeds (Ref. 39).
Rest Time
The beneficial effect of rest time on fatigue character of asphalt materials in repeated-loading test has been reported by various investigators (l l,l5,29,31,33,4l,42,43).
Van Dijk et al (31) in Figure (33) show fatigue curves for sinusoidally
and pulse loaded specimens with different rest times. The number of
cycles to failure increases with rest time used.
Verstraeten et al (42) concluded from work done by Rathbey 6c Sterling (41) on prismatic specimens, 75 mm square and 225 mm long, which were subjected to direct cyclic tensile and compressive
loading at a temperature range between 10°C and 250C with 40 ms
loading time, and also from results obtained by Franken, (33) on trapezoidally shaped specimens 9x3 cm at the base, 35 cm in high,
and 3 cm thick fixed at their larger bases and submitted to a bending force on their smaller bases, at 15°C with 19 ms loading
time, that the estimated number of loadings to produce failure is increased by at least a factor equal to 7 when the influence of rest periods between successive loadings is taken into consideration, at
60 km/h speed of commercial vehicles.
The effect of rest periods on fatigue performance, see Figure (3#), is expressed in function MU), which is the ratio of mean life with rest times to mean life without rest times, plotted against j:
TR/TL, ratio of rest time to loading time.
The maximum value of function M(j) is about 20, which indicates that above a certain value of j ( =1 15) the beneficial effect of rest
periods does not increase any further (42).
40
u. even: Ya FAILURE
10'.
a
'sem-oumr NI! (COMPOSITION IN TAIL£2)V|YM 0 950 OF "YUM! . n n «Emu "I 0 PEN. 2§'C
an... OISOn._°.c TI ITWBI " mr v \ TrIYHCG 03-h IYWcO qj\IT U U "/wa i . . .1 L A . . A - LL; . AA A d I 3 I SI . I J 5 7I"U I 3 L I If13a q, stun.b¢r
Fig. 33
Programmed fatigue testing (Ref. 31).
ii c.n.n.-o.c.m- ORA 12.3904
30 .. o M ( j) x
20 .. X
X
x Raithby'ond Sterling (ref 5) o Fruncken (ref _I_)
o 2 4' 6 6 1'0 1'2 11'. 1'5 1'8 2'0 2'2 2'4 2'6 TR/TEj
Fig. 34 Variation of M(j) in terms
of j: TR/TL (Ref. 42)
Bonnaure et al (29) confirmed the results presented by preceding authors on the beneficial effect of rest periods in repeated loading fatigue test by using rectangular beams tested in three-point
bending apparatus subjected to a sinusoidal load pulses at
temperatures from 50C to 250C for two type of dense asphaltic concrete containing 40/60 and 80/100 pen. bitumen grade. The
maximum value of the life ratio (function M(j)) is around 25, which
is close to Verstraeten's (42) conclusion, depends on bitumen grade and temperature. Increasing the test temperature or using softer binders increases the beneficial effect of rest periods.
Bazin and Saunier (ll) studied the effect of storage time (healing)
on mix, which was previously fatigued, but in which the cracks were not yet visible by leaving'the test bars to rest, at the same
temperature, during a variable time (from several hours to 100 days), using the two-point bending test.
Figure (35) shows the beneficial effect of healing when the specimen bars were stored under low stresses. Mcelvany 5c Pell (43) indicated
the beneficial effect of introducing a rest period between successive
blocks of loading cycles.
L
.
0)-. SAMPLE KEPV VEIHCALLY
001$! NIX UPC
0 SAMPLE KEPY FLAYLY
SANOSHIEY 10°C X SAMPLC KEPY VERNCALLY
l 2 J to 20 so we REST union
(DAT)
Fig. 35 Healing after fatigue test (Ref. ll).
42
3 TESTING APPARATS
Different types of testing machines have been used in studying the
repeated-load characteristics of asphalt concrete mixtures in labora-tory. The tests inClude:
1. Bending test
- Flexural - Rotating - Trapezoidal Wheel tracking test
Indirect tensile test Triaxial test
Direct tension test
o
k
a
s
z
Push - Pull test
1. Bending test
Flexural test: A simply supported asphalt concrete beam specimen is subjected to a bending stress with the specimen ends fixed to prevent vertical movement. The specimen is loaded at one point at the middle
of the specimen (3-point bending test), or at two points at 1/3 and 2/3
of the specimen length (4-point bending test). The loading system applies a pulse or sinusoidal load signal and thetest can be operated by controlled stress or controlled-strain mode. This method has been used widely at the University of California by Monismith et al (1,35,44). The test bars were 1.5 by 1.5 inch or 3 by 3 inch in cross sectional area, with 15 inch length. The specimen is loaded at two points, see Figure (36), for a given time and then it is forced in the opposite direction to
return to its original undeflected position, see Figure (37).
The Shell laboratory in Amsterdam (30) used a 3-point bending machine
where a rectangular bar with maximum dimensions of 230x30x40 mm is
subjected to a sinusoidal load. The deflection was kept constant and the
changes in force and phase angle were recorded as a function of the
number of load applications.
Key:
I. Reaction clamp 5. Ban plot: 9. Doubts-acting, Bellofrom cylinder
2. Load clamp 6 Loading rod IO. Rubber washer
3. Ranch-ac? 7.. Slop nut ll. Load bar
4. Specimen a. ' Piston rod 12. Thomson boll bushing
Fig. 36
Repeated-flexure apparatus (Ref. 35).
Time interval between successive load applications : I. oad ~ 0'0 duration Upstroke 0 . : $ Time Downstroke
fa/ [deal/ked Load-time Curve.
AK
/.;
{b/ Ideal/zed Deflection vime Curve.
L o a d De f/ ac ti on
Fig. 37 Load vs time and deflection vs time relationships for
controlled-stress test equipment (Ref. 35).
44
The Shell laboratory in France (29) performed a 3-point bending test
using a rectangular bar with dimensions of 230x30x20 mm subjected to a sinusoidal load. Constant-stress and constant-strain test mode have been used.
Kallas et al (45,46) at the Asphalt Institute, and Maupin (48) used the 4-point flexure test of the same design as used by Decon and Monismith
(35), applied to a 15 inch long beam specimen having a 1.5 inch or 3 inch square cross section and loaded with constant stress.
Barksdale and Miller (9) placed the asphalt concrete beam on rubber to
simulate the subgrade in the field and to eliminate the problem of beam weight which can affect the results of unsupported beam fatigue test. Kirk (15,18) tested a specimen with dimensions 5x7x35 cm in a 4-point bending machine, the specimen being supported at the ends and loaded
at the third points with a sinusoidal or pulse load.
Hoseth and Va rnes (47) built a test machine which is capable of testing ' 6 bars at the same time. The specimen bar is loaded at the center, see
Figure (38).
Fig. 38
Fatigue testing rig (Ref. 47).
Rotating machine (two point bending test): A rotating cantilever test has been used at the University of Nottingham (#,5,6,7,#9,59). Figure (39) shows the details of this machine. The specimen is
mounted vertically on a rotating cantilever shaft, a load is applied through a bearing at thetop and a sinusoidal bending 'stress of ' constant amplitude is induced through the specimen. The maximum stress occurs just below the neck of the specimen. The specimens were tested in a controlled temperature bath at temperatures -5 to + 30°C, at different loading frequencies.
Another machine was built specially for measuring dynamic
stiffness, using specimens identical to those used in the fatigue
machines, but in this case the specimen was stationary and 'a constant sinusoidal amplitude deformation was applied to the top of
a vertical cantilever specimen, Figure (#0).
LOADING STIRRUP mm § 3. .. .. \ ? 3 X I y/ Ia \ n u\ " wa s . g 3 (oumumw) w 272'DIA. '" x -.- §PECMEN spgcwg "' 3am. _ g '2 SPECIMEN
WATER .; 5 END FITTING __ g, a 9/1 (STEEL)
~
s:
~ ~
- z§ \4 e \ § " , \ § d ___. \ I- § chums ._. \"__.\\um § MAIN SHAFT \ §-LIQUID SEALING ' " aA's'E OF
_UW -- mm
.._ -- v :
| 3N - "7
i//// w/////£ THR w RIN / 1; uouzo c n .15. MAIN BEARING HQUSING I /\/Fig. 39
Detail of Specimen and Loading System (Ref. 7 ).
1+ 6 \ / TO RECORDING
DEFLEC HON MEASJRING EOUPNENT Maj ,2 ECCENT R C
m
LOADING HEAD ~~ F..___._. 11 f-
l
}___.
VARIABLE h_SFEED LOTOR 80 RP M. TO 3000 RPM. INSULATED MTANK U i i
]
\\\\va\\\f\\
IK\\\\\\\\\\\\\\\ \\
yn a mic st iffn es s of a bi tum in ous mi x (R ef. 50 ). Fi g. 40 De ta il s of m ach i n e us ed to m e a s ure d VT IM E D D EL A N DE 58 3AFor controlled-strain fatigue test, a machine similar to the dynamic
stiffness machine has been used.
- Trapezoidal specimen (2-point bending test): A trapezoidal shape specimen has been used to study the modulus and fatigue properties
of asphalt mixtures (ll,30,3l,51,52). Van Dijk et al (30,31) used a
specimen with dimensions 250 mm high, 55 mm long at the base, 20 mm long at the top and 20 mm thick, obtained by sawing larger blocks. The top of the specimen was subjected to a sinusoidal
loading with constant deflection. Verstraeten (51) used test pieces
having a trapezoidal shape (bases: 9 cm and 3 cm, height: 35 cm,
thickness: 3 cm), the specimen being exposed to a sinusoidal
constant stress. Bazin and Saunier (ll), and Coffman (52) tested at
constant stress. The details of the specimen set-up with dimensions
are shown in Figure (41).
The two-point and three-point bending tests have their specific limitations. In particular, the three-point bending test is not
suitable for fatigue tests at stiffness modulus values smaller than
3x10³ MPa, Van Dijk (32).
\\\\\\\\\ S.Fe3ff <6§\_é .\\\;\:~\§
_,_io_78..l {080 9 Wife I Pretensioned Sine Loodinq L o a d Ce llStrain Gages 6. 0" - ~-1 | L r Grovny " ' n Specimen, '3' - Del/ecnan Measurement Y .3 1. j f or c 0/ Wife and .7777//77// /// /////7///~// Speamen
2.0 4 ! - Spec " ren Bonded . will: Epoxy
Fig. 41 Fatigue test array (Ref. 52).
48
2 Wheel trackingtest
Van Dijk et al (31,32) have investigated the Wheel tracking machine in
the laboratory. The applied wheel load simulates the stresses induced in an actual asphalt pavement. The testing machine is a pneumatic tire rolled to and fro on a slab made of an asphaltic mix. The pneumatic tire has a diameter of 0.25 m and its contact area (lelO L to 3OxlO 4 m2) can be varied by changing either the tire pressure or the load on the
wheel. The slab deformation is measured by gluing strain gauges to the bottom surface of the slab, see Figure (42). Both sides of the slab are
periodically photographed so that a correlation can be made between the strain and the crack development as a function of the number of wheel passes.
3 Indirect Tensile Test
The indirect tension method has been developed for asphalt materials
testing at the University of Texas by Kennedy et al (5354,5256) and at
the Chevron Research Company by Schmidt (57).
The Marshall cylinder is subjected to a load at the vertical diameter. The induced deformation at the horizontal diameter is sensed by two
linear variable differential transducers (LVDT), see Figure (#3). The
vertical deformation can be measured for Poissons ratio calculation. This method has been standardized by ASTM (58) for resilient modulus
measurement.
4 Triaxial test
The use of the triaxial test method has been limited to studying the
fatigue character of asphalt materials. This is a more realistic method
for its simulation to the field circumstances, but the test is more complicated than others. The effect of confining pressure on fatigue character of asphalt mixtures has been investigated by Pell and Cooper
(6). The details of this equipment are shown in Figure (44).
<mwm mQZ<AmDQmE E.> .
.Rn #3: $3 M583
8265 vmo uvmpmmamh .8. 02>me wctsmmmE EEONCOI Ildwll
xi e .\ 4 I, glans. .3. ..\ . val . . . I X n \ , fxss mnr1.)»! 5 ii...\ . 3.057.2/1 95:44 3 . . . 315:0). ...A¢\,..§ .Amm .wmmv
mcEumE wcwxumb 3ch Ho co mucmmmamh u mEmzum Na .wm
mkja 1595 mm? 221.5 Egg 2%
m
N?
s\\\ \\ \\ \\-:
x
\\\\\x m:
Hydraulic / ram ' ~ Local rcm . . control t b N Couplirg unit .. Oil flow il return
Spec'men '-* Sen/o cutout Servo vol/e input LVDT /
Air resSJrep d
1
/ _ 2 3' Simply/output / /_ Loodcell
Perspex c ell Sup ply/output
Watertrop / Loodall -" ' Cell bose/
are:
\ \ l l \ l Ill iFig. 44
Axial load fatigue rig (Ref.6).
5. Direct tension test
A sketch of the equipment is shown in Figure (45). A specimen with
1.5 x 1.5 x 4.5 inch is sawn and bonded to aluminium end caps with an
epoxy resin [to permit direct tensile forces to be applied (l)._ The
problem of end gripping and stress concentration has restricted the use
of this method (8).
6. Push-pull test
A prismatic specimen, 75 mm square and 225 mm long, was subjected to direct cyclic tensile and compressive loading in an electro-hydraulic
testing machine. The test is illustrated in Figure-(#6) and has been described by Raithby and Sterling (41).
H
*- Load/ng rod -- Universa/ joint*A/um/num end cap
L_____. Epoxy ' ' V H II II /5 x /5 X 45 / Spec/men and . a ua/ Lvdts
«- A/umr num end cap
~ Load ce//
1
~ Universa/ joint Load/no frame 0 and electro -= hydrou/ic __ ' closed /00p 2 Loading rod testing system 7Fig. 45 Direct tension testing apparatus (Ref. 1).
Temperature chamber ' . "R h; 1 ' q . . , . . l . I 2 ' . a. 1 . o f a r '4 I (I. 1:, 'l c J; .v
n,3 El; , 2:3 2:5-" g s x I w m: ILuvV'.
\ I Mmmming C°fnmatnd junction '
5'gna Load :ell
Hy'droullc actuator \ ; Error signal \ = amplifier . Servo -valve Hydraulic power supply i - - ______... i 1...___.. 4 i
Fig. #6 Schematic representation of test method (Ref. 141)
52
4. DISCUSSION AND CONCLUSIONS
COMPARISON BETWEEN APPARATUS
No comprehensive study has been made regarding the correlation between the results of these apparatus used in studying fatigue or modulus of asphalt mixtures on a wide statistical basis. Wallace and Monismith (59,60) examined the use of the diametral test (indirect
tensile test) and the triaxial test to determine the resilient modulus of
nonlinear pavement materials, such as partly cured open-graded emulsified asphalt mixtures at room temperatures. The examination has led to the following conclusions. The triaxial test measures the vertical and radial strains due to an increment in vertical stress, whereas the diametral test measures the radial strain due to an increment in radial stress. Both methods give a reasonable description of the resilient
characteristics of weak bound, highly stress-dependent material. Wallace and Monismith have also calculated theoretical stresses and
deformations using the finite element method and the closed form solution for a cylindrical specimen, and it was concluded that the results were practically identical.
Hadley and Vahida (61) have compared the stresses and strains found by indirect tensile test and the beam test by using basic theoretical equations and finite element analysis techniques. They concluded that the indirect tensile test underestimates the tensile stresses, strains and modulus calculated by basic equations, while for the beam test the values of stresses and strains were overestimated and the modulus underestimated by basic beam deflection formula.Hadley and Vahida have modified equations for estimating fundamental material properties for the beam and indirect tensile tests. These modified equations gave results which were more closely related between one method and another.
VTI MEDDELANDE 583A
Emery (62) has used Marshall cylinders (102 mm in diameter and 64 mm
thick) and triaxial type specimens (102 mm in diameter and 203mm in
high) from six different types of surface and basecourse mixtures. They
have been tested at temperatures between 10C and 440C, and gave a close agreement between resilient modulus determined by diametral
(indirect tensile) test and triaxial test, except at higher temperatures
and/or lower stiffness where the discrepancy in results was high, Table
(3).
Tab. 3 Comparison of MR for various asphaltic concrete mixes tested in triaxial and diametral equipment (ref. 62).
SPECIMEN TYPE TEMPERATURE MEASURED v RESILIENT HOOULUS. 14R (HPa)
(0C) (201550105 'RATIDEQUIPMENT) 0155011'5 RAT10 EQUIP.(DIRECT MEASUREMENT) DIMTETWF L(CALCULATED WITH 0)UI MENT EXCELLENT 1.0 0.26 10.500 11.055 11111 22.3 0.38 1.150 1.390 44.0 0.44 109 2413 >< 5 AVERAGE 1.0 0.22 10.400 9.255 j :7 mx 22.3 0.39 1.050 1.080 § i 44.0 0.45 97 ' 210 Lu '2 g; HARGINAL 1.0 0.23 9.400 8.655 3 mx 22.3 0.42 1.000 1.120 44.0 0.50 94 218 EXCELLENT 1.0 0.27 12.900 18.095 «,2 NIX 21.0 0.35 1.850 2.035 5 39.0 0.40 250 275 E AVERAGE 1.0 0.24 14.100 14.980 3,4 mx 21.0 0.35 1.550 1.350 Q5: Q. 39.0 0.42 210 .196 _'.1 3 ] I g MARGINAL 1.0 0.22 10.200 12.980 111x 21.0 0.37 - 1.130 1.310 39.0 0.45 157 209
54
Kennedy (63,64) has tested the fatigue life results found by indirect tensile tests against fatigue results reported by different investigators
using other test methods, see Figure (47). This shows that the results
obtained from the repeated load indirect tensile test were compatible
if the applied stress was expressed in terms of stress difference to account for the triaxial state of stress, which exists in the indirect tensile test. The stress difference is approximately equal to 4 x tensile
stress.
Baladi et al (65) employed several tests and test procedures. These included triaxial, flexural, Marshall, indirect tensile and creep tests for studying the asphalt mix properties. They concluded that the results from the indirect tensile test were the most promising, although they . were not consistent.
Brown and Cooper (67) have shown quite a good agreement ofelastic
stiffness values measured by axial load apparatus and indirect tensile test, but in an additional investigation to study the effect of binder
content in elastic stiffness (resilient modulus) of dense bitumen
macadam, using axial load apparatus, indirect tensile test and Shell nomograph, the indirect tensile method, contrary to other two methods,
shows no optimum for binder content. See Figure (48). Schmidt (57)
shows the usefulness of the indirect tensile test in deciding the optimal asphalt content on the mix by measuring the resilient modulus. See
Figure (49).
COMPARISON BETWEEN RESULTS
Witczak (66) has made a comprehensive comparison between different
fatigue curves found by repeated load testing methods from results reported by different researchers. However, each of the researchers has used different test conditions (specimen, test equipment, load conditions, methods of determining strain). Nevertheless, he has
ded that the loading condition has a great effect on the verification of
the concept of unique strain criteria found by Cooper and Pell (4,6) who-found that the strain-life relationship when plotted in its logarithmic .form is independent of temperature, speed of loading or magnitude of
stress.
Witczak found that each of the researchers reporting the existence of a unique strain criterion has used a continuously applied sinusoidal load.
1
.071 -. E Monismilh e! at Pell et ol : nz'3.5l O 712:6.0 22 _ K2 =|.55 x10 Ki-3.8 3: IO 5 Ronhbye T-68°F T= 7°F '0 21 Sterling E n2 3.87 H K'2'3.65x IO : T=77° I051 : Pellet 0| {3 « n2'5.3 .J 4 \ thlJ x l0'9 8 '0' : \\ T=32°F o .. g 3 \\ Monismith et 0! u d \ n2" '6 ~ \ Ké'IJB X IO T = 40° F 1031 : \ Z \ I. ' \\ ' Pell el ol - [12' 3.9 q E] Kennedy el cl Kz"3v0 " lo 102... T: 50°F 5 Q) Pell el 01 o : ">Monismith el 0! \\ Kennedy a 0' j A Roilhby 8 Sterling \ "2-.- 3,88 \ K; 1.03:: lo
'0 "=
2 Kennedy cl ol/>\T = 75° F
-* 6.88 K2r4.76 x IO ~ T=75°F O I I I i I I I I l ' ' I r r I l I IO :02 :05 Stress Di emce,psiFig. 47 Typical stress difference-fatigue life relationships for
various test methods. (Ref. 64).
56
5 - 20mm DBM,1OO pen \ 20°C and 5°Hz 4 ' _ fa; \ Indirect I a. tensile £2 3 \< 3 Axial (7; 2 7 K g Predicted \ . 2 O . 3 4. 5 '6 7 8 Binder Content by wt. 96
Fig 48 Effect of Binder Content on Elastic Stiffness Measured by Axial Load and Indirect Tensile Tests.
300r-Ev. 0 Eu-in 200 -Wu: 3: =2 1::ob 2_. «wCO. 100 » a: 90"" :m 80" 3 I 3m 70" N 50 l 1 I l J l I l l J 0 l 2 3 4 5 6 7 8 9 10 Asphalt in Mix, %
Fig. 49. Influence of AC on resilient modulus.