HIGH LOADED ANAEROBIC
MESOPHILIC DIGESTION OF SEWAGE
SLUDGE
An evaluation of the critical organic loading rate and hydraulic retention time
for the anaerobic digestion process at Käppala Wastewater Treatment Plant
(WWTP).
IBRAHIMA SORY GÄRDEKLINT SYLLA
School of Business, Society and Engineering Course: Degree Project in Energy Engineering Course code: ERA403
Credits: 30 hp
Program: Master of Science in Engineering in Energy Systems
Supervisor at Mälardalens University: Monica Odlare
Supervisor at Käppalaförbundet: Jesper Olsson and Sofia Bramstedt, Examiner: Eva Thorin
Costumer: Käppalaförbundet Date: 2020-08-21 Email: ibrahimasorysylla@rocketmail.com ibrahima.gardeklintsylla@kappala.se isa15001@student.mdh.se
ABSTRACT
Käppala wastewater treatment plant (WWTP) has, during a few years, observed an increase in organic loading rate (OLR) in the mesophilic anaerobic digester R100, due to an increased load to the WWTP. The digestion of primary sludge at Käppala WWTP is today high loaded, with a high organic loading rate (OLR) and low hydraulic retention time (HRT). This study aims to evaluate the effect of the maximum OLR and the minimum HRT for the anaerobic digestion of sewage sludge and to investigate further actions that can be taken into
consideration in case of process problems in the digestion. The study consists of (a) a practical laboratory experiment of 6 pilot-scale reactors to investigate how the process stability is affected when the OLR increases and the HRT decreases. (b) A mass balance calculation based on the energy potential in the feeding sludge and the digested sludge. (c) A study of the filterability of the digested sludge. (d) The construction of a forecasting model in Excel, to predict when digester R100 will reach its maximum OLR and minimum HRT. The result of the study shows that the maximum OLR for Käppala conditions is 4.9 g VS dm-3 d-1,
meaning that R100 will reach its maximum organic load around the year 2031. An OLR of 4.5-4.9 and an HRT of 12 days is optimal for R100, according to the present study. Keeping the anaerobic digestion process in balance is vital when it comes to the outcome of energy in the anaerobic digestion process. Pushing the process to produce more gas can become
counterproductive since a high OLR can lead to process imbalance, which in turn leads to low biogas production. Imbalance in the digestion process can occur fast; therefore, the margin for overload in the anaerobic digestion process must be significant. The methane
concentration in the converted biogas and the pH level in the reactor are the best stability parameters for the conditions at Käppala. Ammonia is the less efficient stability parameter since it did not predict or detect any instability during the experimental process.
Furthermore, the OLR and HRT have a significant impact on the needed quantity for dewatering polymer. The higher digestion of organic material in the sludge, the bigger the need for the polymer to take care of the rest material.
Keywords: Dewaterability, Mesophilic digestion, Methane, Organic load rate, Renewable
PREFACE
This report is a master thesis, part of the master’s program Sustainable Energy Systems at Mälardalen University, Västerås, Sweden, written by Ibrahima Sory Gärdeklint Sylla during the spring semester of 2020. The study focusses on investigating the effect of high organic loading rate and short hydraulic retention time on mesophilic anaerobic digestion of sewage sludge at Käppala Wastewater Treatment Plant. The maximum organic loading rate and the minimum hydraulic retention time for a stable digestion process are also evaluated.
The study was conducted at Käppala WWTP in Stockholm, and I would like to thank my supervisors, Sofia Bramstedt and Jesper Olsson, development engineers at
Käppalaförbundet, for their guidance and support during this period. A great thanks to the supervisor for this thesis, Monica Odlare, professor at the Department of Environmental Engineering and Energy Processes at Mälardalen University, and the examiner, Eva Thorin, professor at the Division of Environmental Engineering and Energy Processes at Mälardalen University, for guidance and support.
Käppalaverket, Stockholm, Västerås, June 4th 2020 Author: Ibrahima Sory Gärdeklint Sylla
SAMMANFATTNING
Avloppsslam bildas i reningsprocessen vid avloppsreningsverk, då vattnet renas. Slammet behandlas traditionellt som avfall, men eftersom det innehåller förnybara råvaror som kol, som kan omvandlas till biogas, och fosfor och kväve som kan användas som gödningsmedel för odling, betraktas slammet i dag som en förnybar resurs. För att vara användbart som resurs måste dock slammet stabiliseras för att minska biologisk aktivitet och dålig lukt. Anaerob rötning (AD) är en vanlig behandlingsmetod för att stabilisera slammet, genom att omvandla det organiska materialet till brännbar biogas som innehåller 60–70% metan. Eftersom biogas är en förnybar energikälla är utvecklingen av biogasproduktionssystem ett viktigt bidrag till den globala omvandlingen från fossila bränslen till förnybar energi. Käppalaverket i Stockholm tar hand om kommunalt avloppsvatten från 550 000 invånare i norra Stockholm, genom en mekanisk, biologisk och kemisk reningsprocess. Käppalaverket har under de senaste åren sett en ökning av den organiska belastningen i rötkamrarna, troligen på grund av det ökade inflödet av avloppsvatten. Rötningen vid Käppalaverket har idag hög organisk belastning (OLR) och korta uppehållstider (HRT). I framtiden riskerar processen att bli överbelastad om inga förändringar görs, detta på grund av
befolkningstillväxten i regionen.
Syftet med examensarbetet är därför att utvärdera maximal belastning och kortast möjliga uppehållstid för en stabil anaerob rötprocess vid Käppalaverket, samt vad som ytterligare kan göras vid processproblem i rötningen. Fokus i arbetet är att eftersträva en stabil rötprocess, något som i sin tur är avgörande för effektiv energikonvertering. Studien består av fyra delar:
• Ett praktiskt laboratorieexperiment, med syftet att i sex modeller av rötkammaren R100 vid Käppalaverket, undersöka hur processtabiliteten påverkas när den organiska belastningen (OLR) ökar och uppehållstiden (HRT) i rötkammaren minskar.
• En massbalansberäkning baserad på den specifika metanproduktionen och på energipotentialen i matningsslammet och i det rötade slammet.
• En studie av filtrerbarheten i det rötade slammet, för att undersöka hur slamavvattningen påverkas av förändringar i OLR och HRT i de olika rötkamrarna.
• Byggandet av en prognosmodell i Excel, för att förutsäga när rötkammaren R100 vid Käppalaverket når maximal organisk belastning (OLR).
Resultatet av denna studie visar att maximal OLR för Käppalaverket är 4,9 g VS dm-3 d-1. Det
innebär att reaktor R100 vid Käppalaverket når maximal organisk belastning omkring år 2031. Då måste en tredje reaktor finnas på plats för att avlasta R100. Det är därför av yttersta vikt att belastningen i Käppalaverkets reaktorer inte går över detta värde.
Att hålla den anaeroba rötprocessen i balans är avgörande för en effektiv energiomvandling vid anaerob rötning. Obalans i systemet leder omedelbart till nedgång i produktionen av biogas. Att driva på processen för att producera mer gas kan bli kontraproduktivt, eftersom hög OLR kan leda till obalans, vilket i sin tur leder till låg biogasproduktion och i
förlängningen risk för processkollaps. Men resultatet visar också hur komplicerat det är att hålla OLR på en konstant nivå i den anaeroba rötprocessen, på grund av variationer i
torrsubstansen (TS) och det organiska innehållet, glödförlust (VS) i slammet. En annan viktig observation är att när det finns en obalans i rötprocessen, går det mycket snabbare än väntat att nå en processkollaps. Detta betyder att marginalen för överbelastning i den anaeroba
rötprocessen måste vara betydande för att undvika stopp i processen. Det visar också på vikten av regelbundna mätningar av stabilitets-parametrarna vid en högbelastad process. Baserat på resultatet för reaktor R3 under denna studie är en OLR på 4,5–4,9 och en HRT på 12 dagar optimala värden för R100 vid Käppalaverket.
Resultatet visar även att metankoncentration i den konverterade biogasen och pH-nivån i reaktorn är de mest effektiva stabilitetsparametrarna för den anaeroba processen vid
Käppalaverket. VFA och förhållandet VFA/TA visade också på instabilitet i processen, men i en mycket långsammare takt. Ammoniakvärdet visade inte alls på någon instabilitet under experimentprocessen, vilket tyder på att ammoniak inte fungerar som processindikator för Käppalaverkets förhållanden. Processbehandling med kemiska tillsatser visade sig inte räcka för att uppnå stabilitet i processen under det aktuella experimentet.
Experimentet visar också att OLR och HRT påverkar avvattningsegenskaperna i processen i hög grad. Ju högre nedbrytning av det organiska materialet i slammet, desto större blir behovet av polymer, för att ta hand om det rötade slammet, i slutet av processen.
TABLE OF CONTENT
1 INTRODUCTION ... 1 1.1 Background ... 1 1.2 Purpose ... 2 1.3 Research questions ... 2 1.4 Delimitation ... 2 2 THEORETICAL FRAMEWORK ... 42.1 Sewage sludge stabilization ... 4
2.2 The anaerobic digestion processes ... 5
2.2.1 Anaerobic digestion process affecting parameters ... 6
2.2.1.1. PH, ALKALINITY, AND VOLATILE FATTY ACIDS ... 6
2.2.1.2. TEMPERATURE... 7
2.2.1.3. HYDRAULIC RETENTION TIME, ORGANIC LOADING RATE, AND PROCESS AID ... 7
2.2.2 Inhibition of the anaerobic digestion process ... 8
2.3 Importance of sludge recycling for the environment and society ... 9
3 METHODS AND MATERIALS ... 10
3.1 Experimental set-up and operational protocol ... 10
3.1.1 Automatic Methane Potential Test SYSTEM (AMPTS) ... 11
3.1.2 Set up of the system ... 12
3.1.3 Feeding process ... 13
3.2 Substrates and inoculums ... 13
3.2.1 The outcome of the experimental setup and experiment period ... 15
3.3 Analysis parameters and methods ... 16
3.3.1 pH, TS, and VS ... 16
3.3.2 Alkalinity ... 16
3.3.3 VFA, NH4-N, COD and CODs ... 17
3.3.4 Methane concentration... 17
3.3.5 Free ammonium NH3-N ... 18
3.3.6 Nitrogen mineralization ... 18
3.3.7 Degree of degradation ... 19
3.3.8 Process stability ... 19
3.4 Theoretical methane potential... 19
3.5 Mass balance ... 21
3.6 Forecasting of the future OLR at Käppala ... 21
3.7 Process aid ... 22
3.9 Description of the anaerobic digestion at Käppala WWTP ... 23
4 RESULT ... 26
4.1 Substrate analyses ... 26
4.2 The anaerobic pilot-scale experiment ... 26
4.2.1 OLR and HRT in the six pilot-scale reactors ... 26
4.3 Stability analysis of the process ... 28
4.3.1 CH4 and pH ... 28
4.3.2 VFA and ratio VFA/TA ... 29
4.3.3 Free ammonia NH3-N (FAN) ... 31
4.4 Energy potential and performance of the experiment ... 31
4.4.1 Methane yield in the pilot-scale experiment ... 31
4.4.2 The degree of degradation ... 33
4.4.3 Chemical oxygen demand COD ... 34
4.4.4 Mass balance ... 35
4.5 Result of the Chemical additive ... 37
4.6 Dewaterability study of the digested sludge ... 38
4.7 Result of the excel prediction model ... 39
5 DISCUSSION ... 40
5.1 Suitability of the substrate for biogas production ... 40
5.2 Maximum organic loading rate (OLR) ... 40
5.3 Stability ... 41
5.4 Gas production ... 42
5.5 Process aid ... 43
5.6 Dewaterability study ... 44
5.7 Error sources ... 44
5.8 Sewage sludge and sustainability ... 45
6 CONCLUSIONS ... 47
7 SUGGESTIONS FOR FURTHER WORK ... 48
REFERENCES ... 49
APPENDIX 1 EXPERIMENT PROTOCOL
LIST OF FIGURES
Figure 1 Stages of anaerobic digestion process for biogas production Kumar & Samadder, (2020). ... 6
Figure 2: The laboratory-scale biogas production process set up. ... 12
Figure 3: Description of the feeding process. ... 13
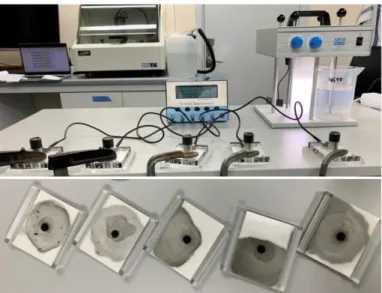
Figure 4: The sludge dewatering thickening process with the aid of a compact moisture analyzer (first object from the left) and a high molecular filter (second object from the left) ... 15
Figure 5: Alkalinity analyses of the digested sludge by the titration robot. 50 mL digested sludge liquid in the different test tubes are being analyzed with a blue pH-meter, a white mixer, a nitrogen gas tube, and a 0.05 M hydrochloric acid (HCl) tube. ... 17
Figure 6: Measurement of methane concentration in the produced biogas, using the membrane gas sampling port and the NaOH solution containing the pH indicator, in an Einhorn pipe meter. ... 18
Figure 7: CST measurements. ... 23
Figure 8 Process chart over Käppala WWTP used with permission Kappala (2011) ... 25
Figure 9 Organic loading rate (OLR) [g VS/day] and hydraulic retention time (HRT). ... 27
Figure 10 pH and CH4 of the digesters during the experiment... 29
Figure 11 The VFA level and the ratio VFA/TA during the pilot-scale experiment. ... 30
Figure 12 Ammonia in the different digesters during the pilot-scale experiment ... 31
Figure 13 Specific methane production (methane yield) and the accumulated methane produced ... 33
Figure 14 Degree of degradation for reactors R1, R2, R3, and R6. ... 34
Figure 15 CODs, and total COD in primary and digested sludge during the experiment. ... 35
Figure 16 Theoretical methane content converted into methane gas ... 36
Figure 17 Comparison of the theoretical and the specific methane yield ... 36
Figure 18 Effect of the Sodium Carbonate on the pH and CH4 of R4 ... 37
Figure 19 Result of the CST analyses. ...38
Figure 20 Result of the prediction model. ... 39
Figure 21 Accumulated methane production ... 2
Figure 22 Daily methane production per day ... 2
Figure 23 Methane production flow per day ... 3
LIST OF TABLES
Table 1: The scenarios that, according to the first plan, were to be studied in the six lab-scale reactors. The organic loading rates and hydraulic retention times are written as OLR and HRT ... 11Table 2: Expected values and real outcome in the six pilot-scale reactors between February 17th and March 1st. (Experimental period 2) ... 15
Table 3 The scenarios applied in the six lab-scale reactors during the different periods of the experiment ... 16
Table 4 Theoretical methane yield assumption... 20
Table 5 Substrate composition in the primary sludge and the digested sludge ... 26
Table 6 The needed quantity of polymer per mass TS sludge. ...38
NOMENCLATURE
Symbol Description Unit
𝐵𝐴 Bicarbonate alkalinity [mgBasic ions L−1]
%𝐶𝐻4 Methane concentration [%]
𝑆𝑝𝑒𝑐𝑖𝑓𝑖𝑐 𝐶𝐻4 𝑃𝑟𝑜𝑑𝑢𝑐𝑒𝑑 Specific methane production/
Methane yield [𝑁𝑚𝐿 𝑔
−1𝑉𝑆−1]
d Number of days [d]
HRT Hydraulic Retention Time [d]
NH3− N The free ammonium in the
digested sludge [%]
𝑀𝐿 Nitrogen mineralization [%]
𝑚𝑁𝑎2𝐶𝑂3 Mass of Sodium Carbonate [g]
𝑀𝑁𝑎2𝐶𝑂3 The molar mass of Sodium
Carbonate
[g mol-1]
𝑁𝐶𝑢𝑠𝑡𝑜𝑚𝑒𝑟 Number of people connected to
the Käppala WWTP [-]
Qin Organic feeding load measured
in volume or mass [g d
-1]
OLR Organic Loading Rate [g VS dm-3 d-1] or [kg VS m-3 d-1]
𝑉𝐹𝐴s Volatile Fatty Acids [mg L-1]
𝑇𝐴 Total Alkalinity [mgBasic ions L−1]
TSDesired_PS Desired total solids [%]
𝑉 Digester’s working volume [dm3]
𝑉𝐷𝑒𝑠𝑖𝑟𝑒𝑑_𝑃𝑆 The desired volume of the
collected primary sludge [dm
3]
𝑉𝑆𝐴𝑠𝑠𝑢𝑚𝑒𝑑 The assumed volatile solid [%]
ABBREVIATIONS
Abbreviation Description
AD Anaerobic digestion
ALK Alkalinity
BMP Biochemical methane potential
COD Chemical Oxygen Demand
GWP Global warming potential
HRT Hydraulic Retention Time
NL Normal liter
OLR Organic Loading Rate
TAN Total Ammonia Nitrogen
TKN Total Kjeldahl Nitrogen
TS Total Solids
VS Volatile Solids
DEFINITIONS
Definition Description
Anaerobic
digestion The biotechnological oxygen-free process to degrade organic material extracting biogas
Acetogenins A key enzyme in energy metabolism
Acetoclastic
methanogens Microorganisms produce methane by fermenting acetate and H2-CO2 into methane and carbon
dioxide Free ammonia
nitrogen (FAN) NHammonia nitrogen (FAN) 3-N, the undissociated form of ammonia, free
Ammonium ion NH4-N is the dissociated form of ammonia
Biogas Gaseous product from fermentation consisting of
methane and carbon dioxide, and depending on the substrate used, ammonia, hydrogen sulfide, and water vapor
Biogas yield Quantity of biogas produced per quantity of
substrate feed Biogas formation
potential Maximum possible biogas yield from a defined quantity of substrate Total biogas
production The quantity of biogas formed in units of volume
Biogas
production rate Biogas quantity produced per unit of time Total ammonia
nitrogen (TAN) Total ammonia nitrogen (TAN) is the sum of FAN and Ammonium in water Chemical Oxygen
Demand (COD) The measure of the content of oxidizable compounds in a substrate Colloidal particles Microscopic solid particles suspended in a fluid Degree of
degradation Reduction in the concentration of organic substance due to anaerobic degradation Dewaterability The ability in digested sludge to let go of water
Fermentation Anaerobic process in which a product, in this case,
biogas is produced by the activity of microorganisms
Global warming
potential (GWP) Amount of heat a greenhouse gas traps in the atmosphere up to a specific time horizon, relative to carbon dioxide
Hydraulic Retention Time (HRT)
Average time for which the substrate remains in the fermenter
Definition Description
Inhibition Hindering of fermentation due to damage to the
active micro-organisms or reduction in the effectiveness of enzymes
Loading rate per
unit volume The ratio of the daily load to the fermenter volume
Methane formation potential
Maximum possible methane yield from a defined quantity of substrate
Methane yield Quantity of methane produced per quantity of
substrate feed Methane
production rate Methane quantity produced per unit of time
Organic Loading
Rate (OLR) The amount of organic material per unit reactor volume, which is subjected to the anaerobic digestion process in the reactor in a given unit period
Solids retention
time (SRT) The time the solid fraction of the wastewater spends in a treatment unit Total solids (TS) TS is the substance contained in the sludge that is
left after dying the sludge at 105 degrees for 24 hours.
1
INTRODUCTION
The volume of wastewater in the world is expected to increase during the coming decades due to the continuously growing world population and increasing industrialization Duan et al., (2012). According to the Swedish Environmental Protection Agency, about 1 million tons of sewage sludge is produced every year in municipal wastewater treatment plants in Sweden Arthurson, (2008). The optimal management of sewage sludge is, therefore, an important issue worldwide, since the sludge can cause severe damage to both the environment, animals, and humans Chen et al., (2020). However, since the sludge contains organic matter, it can serve as a renewable resource. It also contains un-degradable particles and living organisms, and in order to reduce biological activity and odor, it must be stabilized Chen et al., (2020). Municipal wastewater treatment plants (WWTP) generate sewage sludge from mechanical, biological, and chemical treatment. A common treatment used to stabilize the sludge is anaerobic digestion (AD). It is an efficient and well-studied process that biologically converts the chemical energy of sewage sludge into combustible biogas that contains 60-70% methane Appels et al., (2008), and makes it a carbon-neutral alternative to fossil fuels.
Simultaneously, it reduces dangerous pathogens and odor in the process Zhen et al., (2017). Thus, transforming a waste problem into an essential renewable energy resource. As biogas is a renewable energy source, the expansion of biogas production systems is an essential
contributor to the global conversion from fossil fuels to renewable energy systems Tchobanoglous & Burton, (2014).
To meet the increasing volume of sewage sludge, upgrading existing wastewater treatment plants and the sludge digesters is essential. This is the case at Käppala WWTP in Stockholm, which purifies wastewater from approximately 550,000 inhabitants northeast of Stockholm Käppala Association, (2020).
1.1 Background
Käppala WWTP has, during the last years, observed an increase in organic loading rate (OLR) in the mesophilic anaerobic digestion process, due to the increased load to the WWTP. This has resulted in a decrease in alkalinity and pH in the digested sludge. Since pH and alkalinity are two of the anaerobic process stability parameters, this shows a risk for instability in the digestion process. The digestion at Käppala WWTP is today high loaded, with a high organic loading rate and low hydraulic retention time (HRT). In the future, this problem will be noticeable due to the increased population in the region. R100 at Käppala WWTP is currently operating with an organic loading rate of 3.9 [kg VS m-³, d-1], and a
hydraulic retention time of 13,2 days. The experience from Käppala show that this is working well, but how close to the process limits it is possible to run a stable anaerobic digestion
process? If nothing is done, the digester R100 will be overloaded, which will lead to process imbalance and process failure. Studies by, for example, Halalsheh et al., (2005); Duan et al., (2012); Olsson et al., (2018) show that the operational experience with similar process
conditions exists from other wastewater treatment plants. However, process conditions differ from facility to facility, and local conditions are usually governing. Evaluating the mesophilic digestion conditions for Käppala WWTP has never been done before.
1.2 Purpose
For Käppala to encounter the higher load of sewage sludge in future sludge strategies, this thesis aims to evaluate the effect of the maximum organic loading rate and the minimum hydraulic retention time for the anaerobic digestion of sewage sludge. Moreover, to
investigate further actions that can be taken in case of process problems in the digestion. The focus of this work is to strive for a stable digestion process, which is vital for optimal biogas production.
1.3 Research questions
The study is aiming at answering the following research questions:
1. Maximum load: What is the maximum organic loading rate (OLR) and the minimum hydraulic retention time (HRT) to achieve a stable digestion process?
a. Which range of process parameters is acceptable?
b. What happens to the process parameters when the process is overloaded?
c. What measures can be taken in case of overload or risk of overload in the mesophilic anaerobic digestion process? Could chemical additives be used?
d. When will R100 at Käppala WWTP reach maximum load, and a third anaerobic digester will be needed?
2. Energy potential: How is the gas production affected when the organic loading rate increases and the hydraulic retention time in the digesters decreases? How is the gas production affected by instability in the digester?
3. Dewatering process: How are the sludge dewatering properties affected by changes in the organic loading rate and hydraulic retention time in the digester?
1.4 Delimitation
The work in this master thesis is limited to a laboratory-scale experiment, studying six pilot-scales anaerobic digestion reactors. Each one of the six reactors is representing the full-scale reactor R100 at Käppala WWTP, with continued stirring of sewage sludge, in the mesophilic conditions of 37±1 ˚C temperature. The study only deals with the sludge digestion for biogas
production at Käppala WWTP, not the treatment of wastewater. No economic analyses or life cycle analyses of the process are included in the study.
2
THEORETICAL FRAMEWORK
2.1 Sewage sludge stabilization
Sewage sludge is produced while treating wastewater in municipal wastewater treatment plants. It contains water, degradable organic material, living organisms, and un-degradable particles. The sludge is generally treated as a waste product. However, since it contains renewable resources such as carbon, that can be converted into biogas, and phosphorus and nitrogen, that can be used as fertilizer for cultivation Wawrzynczyk, (2007), it has become more and more useful as a resource. Nevertheless, to be useful, it needs to be stabilized to reduce biological activity, odor production, and the release of harmful chemicals substances into the environment Boušková et al., (2005).
Anaerobic digestion (AD) is an efficient method for sludge stabilization. Mainly because of the high efficiency in organic matter degradation when producing biogas with 60-70% methane content, which can be upgraded to biofuel Cha & Noike, (1997); Chen et al., (2020). It reduces greenhouse gas (GHG) and provides clean and renewable energy in the process. According to Chen et al., (2008b), anaerobic digestion is one of the most promising sludge stabilization methods. Mainly because it involves both controlling the pollution from industrial and agricultural waste and a way to recover energy in the process. Other advantages using anaerobic digestion for sludge stabilization are, for example:
• High reduction of volume in the process, between 30-50%. • Reduction of offensive odors in the sludge.
• High rate of pathogen destruction in the sludge when using the thermophilic digestion for sludge stabilization Rubia et al., (2005).
Anaerobic digestion can be performed at two different temperatures, the mesophilic digestion process at 30-40˚C, and the thermophilic digestion process at 45-60˚C Cha & Noike, (1997); Kumar & Samadder, (2020). Mesophilic digestion is the method used at Käppala WWTP, investigated in the present study. However, thermophilic digestion is becoming more and more popular due to its potential when it comes to the reduction of pathogens in the sludge Watanabe et al., (1997).
However, there are some obstacles to consider using anaerobic digestion. For example, several studies have reported of foaming and low efficiency in the degradation of the volatile solids in the anaerobic digestion process Li & Noike, (1992); Halalsheh et al., (2005). Low rates of VS degradation of colloidal particles in the waste have been reported due to the physical limitations of low biodegradability Elmitwalli et al., (2001). The degradation of insoluble substances has also been mentioned as rate-limiting steps for the anaerobic
digestion Eastman & Ferguson, (1981). For a high degradation of colloidal particles, there is a need for long retention times, up to 20-30 days according to Parawira et al., (2004), even 35 days in some full-scale operations for waste stabilization. Here thermophilic digestion has been mentioned as more advantageous than mesophilic digestion, with higher VS
degradation efficiency, higher biogas production, less foaming, and better dewaterability Rimkus et al., (1982).
2.2 The anaerobic digestion processes
The anaerobic digestion process is a complex microbiological process that occurs in an oxygen-free environment. The process involves a series of metabolic reactions that oxidize organic matter into biogas and organic fertilizers Kumar & Samadder, (2020). Sewage sludge, produced from wastewater treatment plants, is a well suited organic material as a substrate for a stable anaerobic digestion process since its nutrient content varies very little Bramstedt, (2015). According to Kumar & Samadder, (2020), the whole anaerobic process is divided into four different stages (see Figure 1):
• Hydrolysis is the first stage in which complex organic compounds like carbohydrates, proteins, and fats are broken down into soluble organic molecules such as amino acids, sugar, fatty acids, and other related compounds. This stage is the slowest step due to the large size of the molecules, the volatile fatty acid formation, and other toxic by-products Zhang et al., (2014).
• Acidogenesis or fermentation is the stage during which the produced organic compounds from the previous stage are further broken down into intermediate products, such as short-chain fatty acids along with hydrogen, carbon dioxide, and other by-products. Acid formation under this stage takes place with the help of acidogenic bacteria. This stage is sometimes divided into two stages. If the breakdown of fatty acids goes slowly, they accumulate and can lead to a decrease in pH and instability in the process Tchobanoglous et al., (2014).
• Acetogenesis is the third stage during which the organic acids formed in the acidogenesis stage gets converted into acetic acid as well as hydrogen and carbon dioxide.
• Methanogenesis is the fourth stage during which two different groups of methanogens produce methane. One group splits the acetic acid into methane and carbon dioxide, while the other uses the intermediate products, H2 and CO2, for the methane formation Appels et al., (2008).
Figure 1 Stages of anaerobic digestion process for biogas production Kumar & Samadder, (2020).
2.2.1 Anaerobic digestion process affecting parameters
Several essential parameters affect the speed of the different stages of the digestion process in the anaerobic environment, namely pH, alkalinity, temperature, and the hydraulic retention time.
2.2.1.1.
pH, alkalinity, and volatile fatty acids
The pH level is one of the most crucial anaerobic process stability parameters. Every microorganism group has a different optimal pH range. Methanogenic bacteria responsible for methane formation in the anaerobic digestion process are susceptible to the pH level, with an optimum pH for methane formation between 6.5 and 7.2 Kanokwan, (200)6; Kumar & Samadder, (2020). When it comes to the fermentation microorganisms, they are less
sensitive and can function within a broader range of pH, between 4.0 and 8.5. Acetics are the main products at a low pH level, while acetic and propionic acids are mainly produced at a high pH value Kanokwan, (2006).
The production of volatile fatty acids (VFA) in the anaerobic digestion process tends to lower the pH level. This pH reduction is usually countered by the activity of methanogenic bacteria, due to their capacity also to produce alkalinity in the form of carbon dioxide, bicarbonate, and ammoniac Appels et al., (2008); Kumar & Samadder, (2020). Together the two create a balance in the reactor. The pH level in the anaerobic process varies depending on in which state the process is. The process pH usually increases when the ammonia concentration
increases due to the reduction of proteins present in the substrate and decreases when the VFA concentration increases Kumar & Samadder, (2020).
2.2.1.2.
Temperature
A stable operating temperature in the digester is essential for the anaerobic digestion process since it is one of the most critical parameters in the anaerobic reactor. It affects the
performance in general, but especially the methanogenesis Turovskiy & Mathai, (2006); Kumar & Samadder, (2020). The temperature also has a significant effect on the
physicochemical properties of the components in the digestion substrate. Besides the growth rate and metabolism of micro-organisms, the whole population dynamic in the anaerobic reactor is affected. Sharp or frequent fluctuations in the temperature affect the bacteria, especially the methanogens, and process failure can occur if the changes are more than 1 o
C/day. Any changes in temperature of more than 0,6 o C/day are to be avoided Appels et al.,
(2008).
2.2.1.3.
Hydraulic retention time, organic loading rate, and process aid
According to Svenskt Vatten, (2019), hydraulic retention time is the most crucial process parameter for the anaerobic digestion process. The digestion result depends primarily on the HRT, followed by the OLR and the temperature Svenskt Vatten, (2019). Stabilization in the digestion process also depends on the HRT, since an HRT less than ten days (10 d) under mesophilic conditions can give rise to wash-out of the organisms and thus inhibit the process according to Forkman, (2014). Each time the digested sludge is withdrawn from the digester, a fraction of the bacterial population is also removed. The cell growth must then compensate for the removed bacteria from the digester to ensure a steady-state in the process and avoid process failure. Appels et al., (2008).
The OLR is, as mentioned, another essential parameter in the anaerobic digestion, due to the process imbalance risk connected to an overload in the digesters. Increasing the OLR in the anaerobic digestion process can lead to operational disruptions due to process imbalances. They are commonly detected as disruptions in gas production, an increase in the CO2 level in the produced biogas, and a decrease in the pH level Svenskt Vatten, (2019). However, high organic loaded digestion can result in the reduction of the needed digester tank volume and improved process stability and process efficiency if all the conditions are in place Appels et al., (2008). According to Svenskt Vatten, (2019), a well-stirred anaerobic digester can be loaded with up to 2-3 kg VS (organic material) per m3 and day. However, raw feeding sludge
should not exceed 6% TS. At higher TS level in the sludge, there is a risk of poisoning the process with mainly ammonium ions or ammonia gas. High TS content also makes mechanical stirring difficult.
In order to regain the process balance while keeping the high organic load in the digester, conceivable measures to consider are, among other things, the use of chemicals. According to Svenskt Vatten, (2019), the following chemicals are commonly used:
• Calcium hydroxide (Ca (OH) 2) should be used when the sludge contains a high content of inorganic material (a residue level higher than 60%).
• Sodium carbonate (Na2CO3) and sodium hydrogen carbonate (NaHCO3) should only be used when the pH level is higher than five, due to high CO2 production, which can lead to foaming problems in the digester.
Kasali et al., (1989) managed to fully recover a failed anaerobic digestion process, using sodium hydrogen carbonate (NaHCO3) as a pH controller. Sodium carbonate (Na2CO3), recommended by Svenskt Vatten, (2019), is used in the present study to recover a failed overloaded pilot-scale digester at Käppala WWTP.
2.2.2 Inhibition of the anaerobic digestion process
Several studies on the anaerobic digestion process have shown considerable variations in the inhibition levels reported for most substances. Some of these inhibitory substances are ammonia, organic compounds sulfide, light metal ions, and heavy metals. The complexity of the anaerobic digestion process, where mechanisms such as antagonism, synergism,
acclimation, and complexing could affect the inhibition phenomenon significantly, is the primary reason for these variations in the inhibition levels Chen et al., (2008a). The two most common inhibitory substances reported by most studies are ammonia and volatile fatty acids (VFA).
• Ammonia exists in two primary forms, ammonium ion (NH4) and ammonia nitrogen (FAN), often called free ammonia Chen et al., (2008a). Combined in water, the two becomes total ammonia (TAN). Ammonia is a significant inhibitor of microbial activities in the anaerobic reactor Akindele & Sartaj, (2018). It can support the system, acting as a buffer, but it can also become a problem if the level of concentration is too high. Then it becomes toxic to the process and reduces methane production Browne et al., (2014); Rajagopal et al., (2013); Sprott & Patel, (1986). The outcome depends, for example, on pH, temperature, C/N ratio, and the type of substrate and inoculum. Yenigün & Demirel, (2013) concludes that a FAN value higher than
100 mg L-1 is the threshold value for ammonia in the anaerobic digestion process. Inhibition
of the anaerobic process has been reported by Zhang & Angelidaki, (2015) to start at a TAN level of 1.5 g-N L-1.
• VFA:s are, like ammonia, one of the main in-between compounds in the metabolic pathway of methane fermentation and can cause microbial stress if they are present in high
concentrations in the anaerobic digestion process Buyukkamaci & Filibeli, (2004). The VFA level in the process generally indicates the metabolic state of the obligate hydrogen-producing acetogenins and the acetoclastic methanogens. Accumulation of VFA occurs when the
methanogens are unable to break down the VFA to methane, but the fermenting bacteria continue to form VFA. As a result, the methanogens are held back even more. Monitoring the evolution of the VFA level is thus key to detecting process imbalance Aymerich et al., (2013). A high concentration of VFA can also result in a pH decrease, which can lead to process failure. The VFA concentration is regularly monitored in the present study to examine the optimal conditions and the efficiency of the pilot digesters.
2.3 Importance of sludge recycling for the environment and society
To reach the global sustainable development goals (SDG) The Global Goals, (2015), systematic procedures for the treatment and recycling of sewage sludge, converting it into energy and other renewable resources, is crucial Arthurson, (2008). Anaerobic digestion of sewage sludge is an efficient way of transforming the challenge into an opportunity. Not only producing biofuel and methane-rich biogas that can be utilized as fuel but also to produce offset heat and electricity for the wastewater treatment sector itself. Renewable energy sources that reduce the need for externally produced heat, electricity and fosil fuel in the process significantly Cao & Pawłowski, (2012). The produced heat can also serve as an essential contributor to the local energy demand, which reduces the need for non-renewable energy sources in the district heating system, warming up houses, and producing hot water. In Käppala WWTP, the sewage sludge-to-energy process results in several different energy outcomes. The purified wastewater is lead to a heat pump to recover heat from it to use internally in the WWTP to heat the sludge in the digester. The excess part is then delivered to the district heating system (see point 13 in Figure 8). In the vehicle gas plant (see point 10 in Figure 8), the carbon dioxide is removed, upgrading the biogas into vehicle fuel with a minimum of 97% methane, used in the local busses (SL) (see point 12 in Figure 8). Biogas can also be used to produce electricity via a water-to-steam-system that makes turbines turn, thus creating energy. However, this is not the case in Käppala WWTP Käppala (2018).3
METHODS AND MATERIALS
The study consists of four parts:• A practical laboratory experiment using six pilot-scale anaerobic digesters of 2.5 dm3, to
investigate how the process stability in the digested sludge is affected when the OLR increases and the HRT decreases.
• A mass balance calculation based on the specific methane yield and the energy potential in the feeding and the digested sludge.
• A study of the digested sludge’ filterability, to investigate how the sludge dewatering properties are affected by changes in OLR and HRT in the digester.
• The construction of a forecasting model in Excel that can predict when the studied digester R100 at Käppala WWTP will reach its maximum OLR and minimum HRT.
3.1 Experimental set-up and operational protocol
The pilot-scale experiment contained six pilot-scale anaerobic digesters of 2.5 dm3, running parallelly. They were filled with 2 dm3 of mesophilic inoculum from the full-scale anaerobic digester R100. The reactors were then operated at the same HRT as the full-scale reactor R100, during one retention time (13.2 days). OLR and HRT were then changed in reactor R2 to R6, while reactor R1 was maintained at the same conditions and operated as a reference. In digester R2, the change was made gradually from the conditions in R3 to R6. Each OLR and HRT in R2 was maintained for at least two retention times. In R3 to R6, the conditions were changed directly. The HRT for R2 to R6 was assumed as presented in Table 1, and the feeding sewage quantity was determined using equation 2. The OLR for digesters R2 to R6 was determined using equation 1. VS% was assumed before each primary sludge collection to calculate the desired TS (see equation 5) and then measured using the standard method APHA et al., (1995). The incoming proportion of TS% into the digester was controlled by thickening the sludge to keep the OLR and HRT constant in the different reactors. 𝑂𝐿𝑅 =𝑄𝑖𝑛∗𝑇𝑆∗𝑉𝑆 𝑉 Equation 1 𝑄𝑖𝑛 = 𝑚 𝐻𝑅𝑇 Equation 2 𝐻𝑅𝑇 = 𝑚 𝑄𝑖𝑛 Equation 3
• 𝑂𝐿𝑅 is the organic loading rate in the digesters [g VS dm−3d−1].
• 𝑇𝑆 is the total solids matter in the sludge [%]
• 𝑉𝑆 is the volatile solids in total solids matter the sludge in [%].
• V is the working volume of the reactors, which is the part of the 2.5 𝑑𝑚3 that is filled with
mesophilic inoculum from the full-scale anaerobic digester R100 in [𝑑𝑚3]
• 𝑄𝑖𝑛 is the hydraulic flow into the digestor per day, in [g d−1]. 𝑄𝑖𝑛 was measured in grams (as a
mass) to ensure that the same amount of solid matter was obtained in the daily feeding sludge
(see Figure 3). It was assumed that 1L = 1dm3= 103cm3= 103g = 1kg. And the sludge density
was also assumed to 1000 [𝑔 𝑑𝑚−3]
• 𝑚 is the quantity of the mesophilic inoculum from the full-scale digester R100 in the pilots scales reactors [g]
Table 1 presents the original scenario protocol that was planned to be investigated in this study, where the presented parameters were used to determine the volume and TS content of the incoming sludge to the reactors. The VS content of the incoming feeding sludge to the reactors was assumed to 80%.
Table 1: The scenarios that, according to the first plan, were to be studied in the six lab-scale reactors. The organic loading rates and hydraulic retention times are written as OLR and HRT
Digester OLR [g VS dm-3 d-1] HRT [d] Feeding Sludge (𝑄𝑖𝑛) [g d-1] R1 3.9 13.2 151.52 R2 4.3-5.5 12-9.5 166.67-210.53 R3 4.3 12 166.67 R4 4.7 11 181.82 R5 5.2 10 200 R6 5.5 9.5 210.53
3.1.1 Automatic Methane Potential Test SYSTEM (AMPTS)
An Automatic Methane Potential Test System (AMPTS II) is an analytical instrument for estimating biochemical methane potential and anaerobic biodegradability (Bioprocess
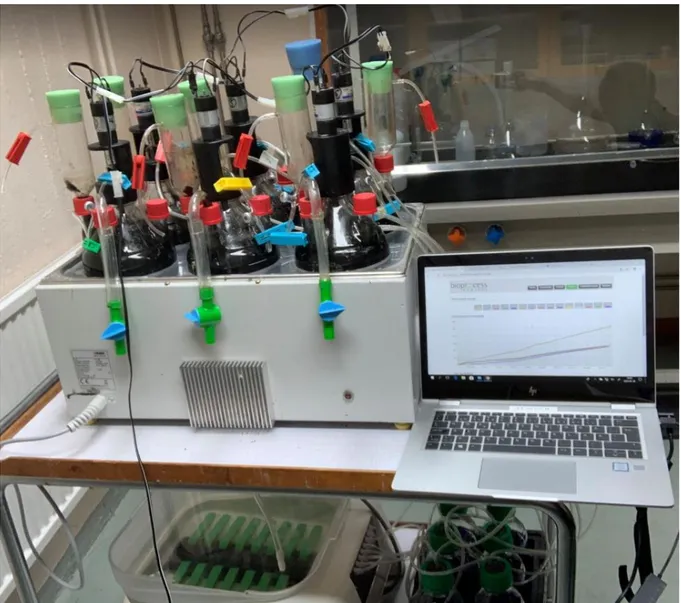
Control, 2020). The AMPTS II was used in the present study for the experimental system that consisted of the below components. AMPTS II was not chosen because it is the best system, but because it is the system available at Käppala WWTP. The system is not adapted to experimenting with high organic loaded digestion.
The incubation unit was the main component of the experiment. It included six 2.5 dm3, continuously stirred, glass tank reactors, with one stirring device, one feeding tube, one membrane gas sampling port, and one outlet valve each. The stirring device rotated
continuously in the sample to favor an optimal mix of the sample during the experiment. The six stirred glass tanks were gathered in a water bath of 37-38˚C, to keep the same
temperature conditions in the reactors all the time.
The CO2 removal unit consisted of six 0.4 dm3 bottles that were filled with 0.4 dm3 each of the NaOH solution containing the pH indicator. This solution was prepared, mixing 2.5 dm3 of NaOH solution and a 0.4% Thymolphthalein pH-indicator solution, according to the instruction manual Bioprocess Control, (2020). As shown inFigure 2, each CO2 absorber bottle had two connectors connecting the CO2 absorber bottle to the reactor and the gas collection unit. The purpose of this unit was, as the name indicates, to absorb the carbon dioxide CO2 in the produced biogas before releasing the methane gas to the gas collection unit. According to the operation manual of the bioprocess control, the CO2 removal unit removes up to 98% CO2 from the produced biogas.
The gas collection unit consisted of fifteen flow cells with an embedded server. Six of the fifteen flow cells were in operation during the present study. The gas flow and volume measurements were performed with real-time temperature and pressure compensation.
3.1.2 Set up of the system
Finally, all the experimental system components were gathered (see Figure 2) and flushed with nitrogen gas to create an anaerobic environment (free from oxygen). The reactors were also pressure controlled before starting the experiment. Then the reactors were filled with 2 dm3 of mesophilic inoculum from the full-scale anaerobic digester R100. The feeding sludge was prepared (see section 3.2) and kept in the fridge to avoid microbiological activity in the sludge. See (Figure 2), where the generated biogas from the digesters goes through the CO2 absorber. The produced methane goes through the gas collector, to be monitored in the Bioprocess Control software in the computer.
3.1.3 Feeding process
The feeding was performed daily according to the scenarios presented in Table 1. To avoid feeding during weekends, but still keeping the load for one week, the digesters were only fed five days a week, Monday to Friday, using the average quantity of primary sludge measured to cover for seven days (see equation 4). The gas flow and the mixer’s rotation were stopped during the feeding process in order to avoid that the digested sludge became mixed with the feeding sludge. If not, this could affect the analyses of the digested sludge. The feeding sludge was then put in the feeding tube. After that, the outlet valve was opened, and the sludge was pushed down using nitrogen gas flow from a 50 mL syringe connected to the tube at the feeding tunnel. In the end, the digested sludge was siphoned out from the open outlet valve and collected for analyses. See (Figure 3), where the feeding sludge is weighed on a scale, put in the feeding tube, and pushed into the reactor using a nitrogen gas ball’ pressor.
𝑄𝑖𝑛(5𝑑𝑎𝑦𝑠)=
𝑄𝑖𝑛(7𝑑𝑎𝑦𝑠)∗7
5 Equation 4
• 𝑄𝑖𝑛(5𝑑𝑎𝑦𝑠) is the amount of feeding sludge for five days/week in [𝑔 d−1].
• Qin(7days) is the amount of feeding sludge during seven days/week according to the experiment
protocol in [𝑔 𝑑−1].( see Table 7 in Appendix 1).
Figure 3: Description of the feeding process.
3.2 Substrates and inoculums
The study consisted of six pilot-scale digesters with mesophilic inoculum from the full-scale anaerobic digester (R100) for primary sludge, at Käppala WWTP in Stockholm. Sewage sludge from Käppala WWTP, collected from the primary sludge, was used as substrates. The digester R100 at Käppala operates with an HRT of 13.2 days and an OLR of 3.9 kg VS m-3
d -1. The same OLR and HRT values were obtained in the pilot-scale experiment, assuming
the VS to be between 80% to 87% and determining the desired TS (see equation 5) of the collected primary sludge for the feeding of the digesters.
𝑄𝑖𝑛∗ 𝑇𝑆𝐷𝑒𝑠𝑖𝑟𝑒𝑑_𝑃𝑆∗ 𝑉𝑆𝐴𝑠𝑠𝑢𝑚𝑒𝑑= 𝑂𝐿𝑅 ∗ 𝑉𝐷𝑖𝑔𝑒𝑠𝑡𝑒𝑟 ↔ 𝑇𝑆𝐷𝑒𝑠𝑖𝑟𝑒𝑑_𝑃𝑆 = 𝑂𝐿𝑅 ∗ 𝑉𝐷𝑖𝑔𝑒𝑠𝑡𝑒𝑟 𝑄𝑖𝑛∗ 𝑉𝑆𝐴𝑠𝑠𝑢𝑚𝑒𝑑 𝑇𝑆𝐷𝑒𝑠𝑖𝑟𝑒𝑑_𝑃𝑆 = 𝑂𝐿𝑅∗𝐻𝑅𝑇 𝑉𝑆𝐴𝑠𝑠𝑢𝑚𝑒𝑑 Equation 5
• TSDesired_PS is the desired TS into the digester [%].
• 𝑉𝐷𝑖𝑔𝑒𝑠𝑡𝑒𝑟 is the working volume of the reactors in [𝑑𝑚3].
• 𝑉𝑆𝐴𝑠𝑠𝑢𝑚𝑒𝑑 is the assumed volatile solids in [%].
• 𝑄𝑖𝑛 is the quantity of primary sludge for feeding measured in volume [𝑔 𝑑−1].
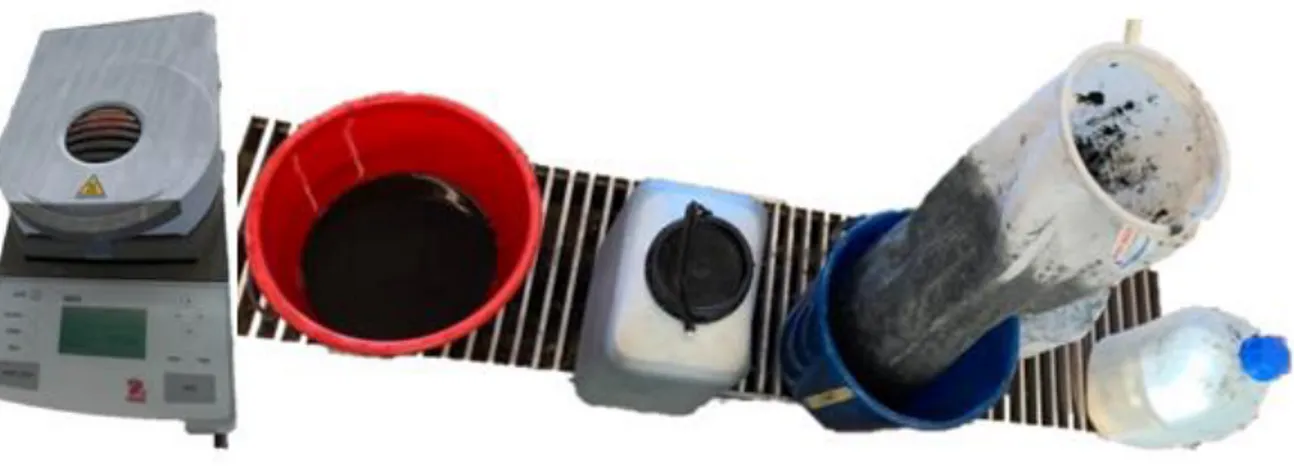
The needed TS in the primary feeding sludge was calculated through the above equation 5. This made it possible to determine the thickness of the primary sludge. The sludge was then thickened through a dewatering process with a high molecular filter Ytteknik QP3, (2020) to
obtain the desired total solids (TS) amount for the study.
During this step, the initial TS of the collected primary sludge was measured using a compact moisture analyzer (see the first object to the left in Figure 4) Ohaus MB45, (2020). This was done to determine to what extent the sludge needed to be filtered to contain the desired TS.
▪ Knowing the initial volume of the collected sludge, the initial TS of the collected primary
sludge, and the desired TS of the primary sludge, the desired volume of the sludge was calculated as follows:
𝑉𝐼𝑛𝑖𝑡𝑖𝑎𝑙_𝑃𝑆∗ 𝑇𝑆𝐼𝑛𝑖𝑡𝑖𝑎𝑙_𝑃𝑆= 𝑉𝐷𝑒𝑠𝑖𝑟𝑒𝑑_𝑃𝑆∗ 𝑇𝑆𝐷𝑒𝑠𝑖𝑟𝑒𝑑_𝑃𝑆 𝑉𝐷𝑒𝑠𝑖𝑟𝑒𝑑_𝑃𝑆=
𝑉𝐼𝑛𝑖𝑡𝑖𝑎𝑙_𝑃𝑆∗𝑇𝑆𝐼𝑛𝑖𝑡𝑖𝑎𝑙_𝑃𝑆
𝑇𝑆𝐷𝑒𝑠𝑖𝑟𝑒𝑑_𝑃𝑆 Equation 6
• 𝑉𝐷𝑒𝑠𝑖𝑟𝑒d_PS is the desired volume of the collected primary sludge in [dm3].
• 𝑉𝐼𝑛𝑖𝑡𝑖𝑎𝑙_𝑃𝑆 is the known initial volume of the collected primary sludge in [dm3].
• 𝑇𝑆𝐼𝑛𝑖𝑡𝑖𝑎𝑙_𝑃𝑆 is the measured initial TS value of the collected primary sludge in [%].
• 𝑇𝑆𝐷𝑒𝑠𝑖𝑟𝑒𝑑_𝑃𝑆 is the desired TS value of the collected primary sludge, determined in the next
section in [%].
▪ The collected sewage sludge was filtered to obtain the desired volume, determined by equation
6, using a high molecular filter (see the second object from the right in Figure 4).
Figure 4: The sludge dewatering thickening process with the aid of a compact moisture analyzer (first object from the left) and a high molecular filter (second object from the left)
3.2.1 The outcome of the experimental setup and experiment period
The experimental outcome could be divided into four periods. The first period (see Table 3) of the pilot-scale experiment started on February 3rd with all six reactors running at the same
OLR and HRT for one retention time (13.2 days), before the OLR and HRT were changed, on February 17th. Due to calculation errors and false assumptions of the VS values during the
start-up of the experiment, the outcome did not follow the expected original protocol. Thus, the obtained OLR and HRT in all the digesters (R1 to R6) turned out differently than
expected for the second period (February 17th to March 2nd), especially in R4, R5, and R6, the
values deviated significantly from the expected (see Table 2). Table 2 presents the expected and the real OLR and HRT for the period.
Table 2: Expected values and real outcome in the six pilot-scale reactors between February 17th and March 1st.
(Experimental period 2)
Expected outcome Real outcome
Digester OLR [g VS dm-3 d-1] HRT [d] OLR [g VS dm-3 d-1] HRT [d]
R1 3.9 13.2 4.2 13.1 R2 4.3 12 4.7-4.5 12 R3 4.3 12 4.7-4.5 12 R4 4.7 11 12.6 - 8.3 4.4 – 6.5 R5 5.2 10 8.8 - 6.7 6.3 - 8 R6 5.5 9.5 6.5 – 5.4 8.6 – 9.9
The errors were corrected, resetting the new OLR and HRT values as close as possible to the original protocol during period 3 (see Table 3). The experiment could then continue following a new plan (see Table 3). The affected reactors were expected to recover during the third period (March 2nd to April 16th) after the correction of the calculation errors. During period 3,
the chemical additive Na2CO3 was also used once a week to investigate if the anaerobic digestion in reactor R4 could recover, while still keeping the high OLR and short HRT. The last experimental period (period 4) (see Table 3), starting on April 17th, is the period most
in an attempt to allow the digesters to recover and avoid process failure. Between April 17th
and 21rst, the feeding was stopped entirely because of total process failure. On April 22nd, the
feeding started again, but with only half of the OLR level. Between May 1st and 12th, the
feeding was stopped again because of process imbalance. Table 3 presents how the OLR and HRT varied in the reactors during all four periods.
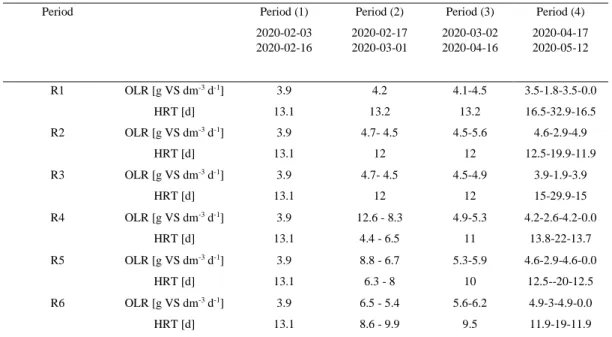
Table 3 The scenarios applied in the six lab-scale reactors during the different periods of the experiment
Period Period (1) 2020-02-03 2020-02-16 Period (2) 2020-02-17 2020-03-01 Period (3) 2020-03-02 2020-04-16 Period (4) 2020-04-17 2020-05-12 R1 OLR [g VS dm-3 d-1] 3.9 4.2 4.1-4.5 3.5-1.8-3.5-0.0 HRT [d] 13.1 13.2 13.2 16.5-32.9-16.5 R2 OLR [g VS dm-3 d-1] 3.9 4.7- 4.5 4.5-5.6 4.6-2.9-4.9 HRT [d] 13.1 12 12 12.5-19.9-11.9 R3 OLR [g VS dm-3 d-1] 3.9 4.7- 4.5 4.5-4.9 3.9-1.9-3.9 HRT [d] 13.1 12 12 15-29.9-15 R4 OLR [g VS dm-3 d-1] 3.9 12.6 - 8.3 4.9-5.3 4.2-2.6-4.2-0.0 HRT [d] 13.1 4.4 - 6.5 11 13.8-22-13.7 R5 OLR [g VS dm-3 d-1] 3.9 8.8 - 6.7 5.3-5.9 4.6-2.9-4.6-0.0 HRT [d] 13.1 6.3 - 8 10 12.5--20-12.5 R6 OLR [g VS dm-3 d-1] 3.9 6.5 - 5.4 5.6-6.2 4.9-3-4.9-0.0 HRT [d] 13.1 8.6 - 9.9 9.5 11.9-19-11.9
3.3 Analysis parameters and methods
During the experiment, primary sewage sludge from Käppala WWPT wascollected and
thickened once every two weeks, to be analyzed for relevant parameters for the anaerobic digestion process, like TS, VS, COD, CODs, pH, NH4-N, Kjeldahl-N. The first feeding and the last digested sludge were also analyzed for fat and proteins to determine the fat and protein content in the primary sludge. The raw sludge was kept at a temperature of 4˚C for the feeding of the digesters. The digested sludge was daily analyzed for pH. The methane concentration in the produced biogas was also daily measured. The digested sludge was weekly analyzed for TS, VS, COD, CODs, NH4-N, VFA, and ALK.
3.3.1 pH, TS, and VS
The pH, TS, and VS were analyzed according to the standard method APHA et al., (1995) before and after the digestion, to evaluate the physicochemical change in the sludge characteristics.
3.3.2 Alkalinity
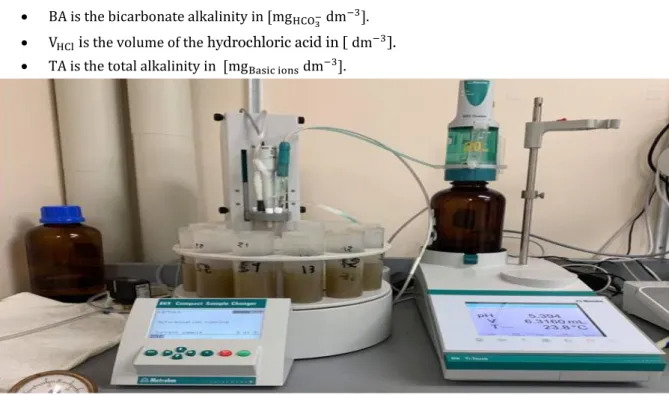
The alkalinity of the digested sludge was analyzed once a week through a titration robot connected with an 896 Compact Sampler Changer (Metrohm, 2020). The digested sludge was first centrifuged at 4000 rpm for 20 minutes Thermo Scientific, (2020) to separate the
liquid part of the sewage sludge from the substantial part, and then analyzed by the titration robot (see Figure 5). The titration robot mixed the sample with 0.05 M hydrochloric acid (HCl) to reduce the pH of the sample to 5.4 to determine the BA. The pH of the sample was reduced to 4.5 to determine the TA. BA and TA were then calculated using the following equations 7 and 8 (SS-EN ISSO 9963-1 & SS-EN ISSO 9963-2 ) Jarvis & Schnurer, (2009).
𝐵𝐴 = 380 ∗ 𝑉𝐻𝐶𝑙 Equation 7
𝑇𝐴 = 380 ∗ 𝑉𝐻𝐶𝑙 Equation 8
• BA is the bicarbonate alkalinity in [mgHCO3− dm−3].
• VHCl is the volume of the hydrochloric acid in [ dm−3].
• TA is the total alkalinity in [mgBasic ions dm−3].
Figure 5: Alkalinity analyses of the digested sludge by the titration robot. 50 mL digested sludge liquid in the different test tubes are being analyzed with a blue pH-meter, a white mixer, a nitrogen gas tube, and a 0.05 M hydrochloric acid (HCl) tube.
3.3.3 VFA, NH4-N, COD and CODs
The VFA of the digested sludge was analyzed, filtering the sludge with a suction filter with a pore size of 0.45 μm Tisch Scientific, (2020). The filtered sludge was then analyzed for VFA using LCK 365 cuvette test from HACH LANGE, which was later measured by a
spectrophotometer. The total chemical oxygen demand COD and the filtered CODs were analyzed the same way as the VFA, except that the sample of the sludge analyzed for the total COD was not filtered but diluted to a specific volume. The total COD and the filtered CODs were analyzed using LCK 114 cuvette test from HACH LANGE, which was later measured by a spectrophotometer. The ammonium NH4-N was analyzed the same way as the COD, with an LCK 303 cuvette test from HACH LANGE.
3.3.4 Methane concentration
The methane concentration in the produced biogas was analyzed every day before the feeding process. This was done taking 5 milliliters of the produced gas (with a 5 mL syringe) through
the membrane gas sampling port, and injecting it into the NaOH solution containing the pH indicator in an Einhorn pipe meter (see Figure 6). The percentage of the methane contained in this biogas was then calculated using equation 9 below:
%𝐶𝐻4 =
𝑉𝐶𝐻4
𝑉𝐵𝑖𝑜𝑔𝑎𝑠 Equation 9
• CH4 is the methane content in the produced biogas [%].
• 𝑉𝐶𝐻4 is the volume of methane read on the Einhorn pipe meter [mL].
• 𝑉𝐵𝑖𝑜𝑔𝑎𝑠 is the total volume of the sampled biogas [mL].
Figure 6: Measurement of methane concentration in the produced biogas, using the membrane gas sampling port and the NaOH solution containing the pH indicator, in an Einhorn pipe meter.
3.3.5 Free ammonium NH3-N
The amount of free ammonium NH3-N in the primary and the digested sludge was determined from the measured NH4-N in the sludge, according to equation 10 Gallert & Winter, (1997); Olsson et al., (2018).
𝑁𝐻3− 𝑁 =
𝑁𝐻4+−𝑁∗10𝑝𝐻 𝑒(
6344
273+𝑇)+10𝑝𝐻 Equation 10
• 𝑁𝐻3− 𝑁 is the concentration of free ammonia in the digested sludge in [g L-1].
• 𝑁𝐻4+− 𝑁 is the concentration of free ammonium [g L-1].
• 𝑇 is the temperature in [oC].
• 𝑝𝐻 is the value of pH.
3.3.6 Nitrogen mineralization
The nitrogen mineralization was determined using the equation below: 𝑀𝐿 = ((𝑁𝐻4 +−𝑁) 𝐷𝑖𝑔𝑒𝑠𝑡𝑒𝑑 𝑠𝑙𝑢𝑑𝑔𝑒−(𝑁𝐻4 +−𝑁) 𝑃𝑟𝑖𝑚𝑎𝑟𝑦 𝑠𝑙𝑢𝑑𝑔𝑒 (𝑁𝑂𝑟𝑔) 𝑃𝑟𝑖𝑚𝑎𝑟𝑦 𝑠𝑙𝑢𝑑𝑔𝑒 ) ∗ 100 Equation 11
• 𝑀𝐿 is the nitrogen mineralization [%].
• (𝑁𝐻4+− 𝑁)Digested sludge is the concentration of free ammonium in the digested sludge [g L-1].
• (𝑁𝐻4+− 𝑁)Primary sludge is the concentration of free ammonia in the primary sludge [g L-1].
• (𝑁𝑂𝑟𝑔)Primary sludge is the organic N in the primary sludge [g L-1].
3.3.7 Degree of degradation
The degree of degradation was determined according to Schnurer & Jarvis, (2017). 𝐷𝑒𝑔𝑟𝑎𝑑𝑎𝑡𝑖𝑜𝑛 = 𝛼 = (1 − (𝑇𝑆𝑂𝑢𝑡∗𝑉𝑆𝑂𝑢𝑡
𝑇𝑆𝐼𝑛∗𝑉𝑆𝐼𝑛 )) ∗ 100 [%] Equation 12
• 𝛼 is the degradation degree in [%].
• 𝑇𝑆𝑂𝑢𝑡 is the TS amount in the digested sludge in [%].
• 𝑉𝑆𝑂𝑢𝑡 is the amount of VS in the digested sludge in [%].
• 𝑇𝑆𝐼𝑛 is the TS amount in the primary sludge in [%].
• 𝑉𝑆𝐼𝑛 is the amount of VS in the primary sludge in [%].
3.3.8 Process stability
The process stability was examined, looking at the ratio between VFA and TA as proposed by Svenskt Vatten, (2019).
• 𝑉𝐹𝐴
𝑇𝐴 < 0.3 stable process.
• 𝑉𝐹𝐴
𝑇𝐴 = 0.3 𝑡𝑜 0.5 small instability in the process.
• 𝑉𝐹𝐴
𝑇𝐴 > 0.5 real instability in the process.
• 𝑉𝐹𝐴
𝑇𝐴 > 1 There is a significant risk for a sudden reduction of gas production.
• 𝑉𝐹𝐴 is the volatile fatty acid in [mg L-1].
• 𝑇𝐴 is the total alkalinity in [mg L-1].
3.4 Theoretical methane potential
For the estimation of the theoretical methane yield in the primary feeding sludge and the digested sludge, the substrates were analyzed for lipids, protein, and carbohydrates. The protein content was determined using the Kjeldahl method for organic nitrogen analysis, according to Väänänen & Koivistoinen, (1996). The Kjeldahl method for organic nitrogen analysis consists of multiplying the deducted nitrogen content by 6.25, which is the conversion factor used for the protein determination in food samples.
The primary purpose of this was to evaluate how the different components in the primary feeding sludge had contributed to the production of the generated methane gas. The purpose was also to investigate the wasted methane potential, in connection with the OLR and HRT, in the digesters. According to the German Standard Verein Deutscher Ingenieure, (2006),
lipids in primary sludge produce 1000.8 NmL g-1 VS-1 methane, protein produce 480 NmL g-1
VS-1 methane, and carbohydrates generate 375 NmL g-1 VS-1 methane. The theoretical
methane production values from the different substrates were determined from the given theoretical biogas yield (see Table 4).
Table 4 Theoretical methane yield assumption
Substrate type
Theoretical biogas yield [NL kg-1 VS-1]
Theoretical CH4/CO2 composition [%/Volume]
Carbohydrate 750 50%CH4 50%CO2
Fats (Lipids) 1390 72%CH4 28% CO2
Proteins 800 60%CH4 40% CO2
The carbohydrates, estimated as the remaining portion of organic material in each substrate, were determined using equation 13, the theoretical methane potential in the sludge using equation 14, and the methane yield (or specific methane production) using equation 15.
𝐶𝑎𝑟𝑏𝑜ℎ𝑦𝑑𝑟𝑎𝑡𝑒 𝑐𝑜𝑛𝑡𝑒𝑛𝑡 [𝑊%] = 100[𝑊%] − 𝐻2𝑂[𝑊%] − 𝐼𝑛𝑜𝑟𝑔𝑎𝑛𝑖𝑐 𝑐𝑜𝑛𝑡𝑒𝑛𝑡[𝑊%] − 𝐿𝑖𝑝𝑖𝑑𝑠[𝑊%] − 𝑃𝑟𝑜𝑡𝑒𝑖𝑛𝑠[𝑊%] 𝐶𝑎𝑟𝑏𝑜ℎ𝑦𝑑𝑟𝑎𝑡𝑒 𝑐𝑜𝑛𝑠𝑡𝑒𝑛𝑡 [𝑊%] = 𝑉𝑆 − 𝐿𝑖𝑝𝑖𝑑𝑠[𝑊%] − 𝑃𝑟𝑜𝑡𝑒𝑖𝑛𝑠[𝑊%] Equation 13 𝐶𝐻4_𝑃𝑜𝑡𝑒𝑛𝑡𝑖𝑎𝑙_𝑇ℎ𝑒𝑜𝑟𝑒𝑡𝑖𝑐𝑎𝑙= 𝐿𝑖𝑝𝑖𝑑𝑠[𝑊%] ∗ 𝐵𝑖𝑜𝑔𝑎𝑠𝑃𝑜𝑡𝑒𝑛𝑡𝑖𝑎𝑙𝑖𝑛𝐿𝑖𝑝𝑖𝑑∗ 72% + 𝑃𝑟𝑜𝑡𝑒𝑖𝑛𝑠[𝑊%] ∗ 𝐵𝑖𝑜𝑔𝑎𝑠𝑃𝑜𝑡𝑒𝑛𝑡𝑖𝑎𝑙𝑖𝑛𝑃𝑟𝑜𝑡𝑒𝑖𝑛∗ 60% + 𝐶𝑎𝑟𝑏𝑜ℎ𝑦𝑑𝑟𝑎𝑡𝑒 𝑐𝑜𝑛𝑡𝑒𝑛𝑡 [𝑊%] ∗ 𝐵𝑖𝑜𝑔𝑎𝑠𝑃𝑜𝑡𝑒𝑛𝑡𝑖𝑎𝑙𝑖𝑛𝐶𝑎𝑟𝑏𝑜ℎ𝑦𝑑𝑟𝑎𝑡𝑒∗ 50% Equation 14 𝑆𝑝𝑒𝑐𝑖𝑓𝑖𝑐 𝐶𝐻4 𝑃𝑟𝑜𝑑𝑢𝑐𝑒𝑑 = 𝑉𝐶𝐻4 𝑄𝑉𝑆_𝑖𝑛 Equation 15 𝑄𝑉𝑆_𝑖𝑛= 𝑄𝑖𝑛∗ 𝑇𝑆 ∗ 𝑉𝑆 Equation 16
• 𝐶𝑎𝑟𝑏𝑜ℎ𝑦𝑑𝑟𝑎𝑡𝑒 𝑐𝑜𝑛𝑡𝑒𝑛𝑡 is the carbohydrate content in the sewage sludge [%]
• 𝑉𝑆 = 100[𝑊%] − 𝐻2𝑂[𝑊%] − 𝐼𝑛𝑜𝑟𝑔𝑎𝑛𝑖𝑐 𝑐𝑜𝑛𝑡𝑒𝑛𝑡[𝑊%] is the volatile solids content.
• 𝑃𝑟𝑜𝑡𝑒𝑖𝑛𝑠[𝑊%] = 𝑁𝑂𝑟𝑔∗ 𝐹 is the protein content in the sludge. And 𝐹 here is the conversion
factor used for protein determination in food samples. • Lipids[W%] is the fat content in the sludge.
• 𝑁𝑂𝑟𝑔 is the organic nitrogen content in the substrate
• CH4_Potential_Theoretical is the total theoretical methane potential in the sludge [NmL g-1 VS-1].
• 𝐵𝑖𝑜𝑔𝑎𝑠𝑃𝑜𝑡𝑒𝑛𝑡𝑖𝑎𝑙𝑖𝑛𝐿𝑖𝑝𝑖𝑑 is the theoretical biogas potential in the lipid in the sludge [NmL g-1 VS-1].
• 𝐵𝑖𝑜𝑔𝑎𝑠𝑃𝑜𝑡𝑒𝑛𝑡𝑖𝑎𝑙𝑖𝑛𝑃𝑟𝑜𝑡𝑒𝑖𝑛 is the theoretical biogas potential in the proteins in the sludge [NmL g-1 VS-1].
• 𝐵𝑖𝑜𝑔𝑎𝑠𝑃𝑜𝑡𝑒𝑛𝑡𝑖𝑎𝑙𝑖𝑛𝐶𝑎𝑟𝑏𝑜ℎ𝑦𝑑𝑟𝑎𝑡𝑒 is the theoretical biogas potential in carbohydrates in sludge [NmL g-1 VS-1].
• 𝑆𝑝𝑒𝑐𝑖𝑓𝑖𝑐 𝐶𝐻4 𝑃𝑟𝑜𝑑𝑢𝑐𝑒𝑑 is the specific methane production per gram fed VS [𝑁𝑚𝐿 ∗ 𝑔−1𝑉𝑆−1]
• VCH4 is the volume of the produced methane in [𝑁𝑚𝐿]
3.5 Mass balance
The mass balance between the fed sewage sludge, the produced methane, and the remaining organic matter in the digested sludge was determined by analyzing the substrate composition in both the primary sludge (at the beginning of the experiment) and the digested sludge (at the end of the experiment).
[𝑘𝑔] 𝑉𝑆𝑖𝑛= [𝑘𝑔] 𝑉𝑆𝐶𝑜𝑛𝑣𝑒𝑟𝑡𝑒𝑑 𝑖𝑛𝑡𝑜 𝐶𝐻4+ [𝑘𝑔] 𝑉𝑆𝑖𝑛 𝑑𝑖𝑔𝑒𝑠𝑡𝑒𝑑 𝑠𝑙𝑢𝑑𝑔𝑒 →
[𝑘𝑔]𝑉𝑆𝐶𝑜𝑛𝑣𝑒𝑟𝑡𝑒𝑑 𝑖𝑛𝑡𝑜 𝐶𝐻4 =[𝑘𝑔] 𝑉𝑆𝑖𝑛− [𝑘𝑔] 𝑉𝑆𝑖𝑛 𝑑𝑖𝑔𝑒𝑠𝑡𝑒𝑑 𝑠𝑙𝑢𝑑𝑔𝑒 Equation 17
• [𝑘𝑔]𝑉𝑆𝐶𝑜𝑛𝑣𝑒𝑟𝑡𝑒𝑑 𝑖𝑛𝑡𝑜 𝐶𝐻4 is the theoretical methane yield converted to methane through the
anaerobic digestion.
• [𝑘𝑔] 𝑉𝑆𝑖𝑛 is the theoretical methane yield in the primary feeding sludge [kg].
• [𝑘𝑔] 𝑉𝑆𝑖𝑛 𝑑𝑖𝑔𝑒𝑠𝑡𝑒𝑑 𝑠𝑙𝑢𝑑𝑔𝑒 is the theoretical methane yield in the digested sludge in [kg].
The mass balance between the theoretical methane yield in the feeding sludge and the average specific methane potential achieved by the different reactors was also determined to investigate how much of the theoretical methane yield in the feeding sludge that was actually produced by the digesters (see equation 18).
𝐶𝐻4𝑇𝑟𝑎𝑛𝑠𝑓𝑜𝑟𝑚𝑒𝑑 = 1 −
𝐶𝐻4𝑡ℎ𝑒𝑜_𝑃𝑆−𝐶𝐻4𝑆𝑝𝑒𝑐𝑖𝑝ℎ𝑖𝑐
𝐶𝐻4𝑡ℎ𝑒𝑜 Equation 18
• 𝐶𝐻4𝑇𝑟𝑎𝑛𝑠𝑓𝑜𝑟𝑚𝑒𝑑 is the transformed methane yield in [%].
• 𝐶𝐻4𝑡ℎ𝑒𝑜_𝑃𝑆 is the theoretical methane yield in the feeding sludge in [N-L kg-1 VS-1].
• 𝐶𝐻4𝑆𝑝𝑒𝑐𝑖𝑝ℎ𝑖𝑐 is the average specific methane potential of the reactors in [N-L kg-1 VS-1].
3.6 Forecasting of the future OLR at Käppala
To find out when a third digester will be needed at Käppala, in order to be able to digest the future high OLR, a forecasting model was used. The model, which was based on Käppala’s prediction model, was built in excel, assuming the future increase in the number of people connected to the Käppala WWTP. The assumption was based on the increase in the number of people during recent years. With this data, the specific amount of primary sludge produced per person could be calculated using the equation below:
𝑆𝑝𝑒𝑐𝑖𝑓𝑖𝑐_𝑃𝑆𝑃𝑟𝑜𝑑𝑢𝑐𝑒𝑠/𝑝 = 𝑇𝑜𝑡𝑎𝑙_𝑃𝑆𝑃𝑟𝑜𝑑𝑢𝑐𝑒𝑠 𝑁𝐶𝑢𝑠𝑡𝑜𝑚𝑒𝑟 Equation 19 𝑇𝑜𝑡𝑎𝑙𝑃𝑆𝑃𝑟𝑜𝑑𝑢𝑐𝑒𝑠= 𝑇𝑆𝑡ℎ𝑖𝑐𝑘𝑒𝑛𝑒𝑑 𝑠𝑙𝑢𝑑𝑔𝑒 100 ∗ 𝑄𝑖𝑛 Equation 20
• 𝑆𝑝𝑒𝑐𝑖𝑓𝑖𝑐_𝑃𝑆𝑃𝑟𝑜𝑑𝑢𝑐𝑒𝑠/𝑝 is the specific amount of sludge produced per person a day in [g d-1].
• 𝑇𝑜𝑡𝑎𝑙𝑃𝑆𝑃𝑟𝑜𝑑𝑢𝑐𝑒𝑠 is the total produced primary sewage sludge at Käppala per day in [g d-1].
• 𝑁𝐶𝑢𝑠𝑡𝑜𝑚𝑒𝑟: is the number of people connected to the Käppala WWTP.
• 𝑇𝑆𝑡ℎ𝑖𝑐𝑘𝑒𝑛𝑒𝑑 𝑠𝑙𝑢𝑑𝑔𝑒 is the TS amount in the thickened sludge of this pilot experiment in [%].
• 𝑄𝑖𝑛: is the inflow of the thickened sludge into the full-scale digester R100 [g d-1].