Degree Project, 15 credits, for the degree of master program in Food
and Meal Science
Autumn Semester 2020
Department of Food and Meal Science
Reducing Meat Consumption: A
Mixed-Methods Study Investigating Attitudes of
Young Adult Omnivores
ii
Author
Dimah Albenny
Title
Reducing Meat Consumption: A Mixed-Methods Study Investigating Attitudes of Young Adult Omnivores.
Supervisor
Elisabet Rothenberg
Examiner
iii
Abstract
Background
Meat is one of the most nourishing and highly consumed foods, but the controversy around the consumption of meat products, and the negative effects around the consumption of meat products led to increased scholarly attention on the user willingness to alter their meat consumption.
In Sweden, a guideline by the Livsmedelsverket (The Swedish National Food Agency) in 2015 encouraged people to consume less red and processed meat. This was because 72 per cent of men and 42 per cent of women in Sweden have individual consumption levels that exceed the 500 grams per week of red and processed meats as recommended by the World Cancer Research Fund.
Objective:
This planned mixed-methods study inquires about the attitudes of young adult omnivores towards the reduction of meat intake, their expected liking of changing dietary habits, and motivation towards the reduction of meat consumption in Sweden. Changing dietary habits in the current context refers to the participant’s willingness to favour meat alternatives.
Methods:
The current study is a convergent mixed method design using both a quantitative survey and qualitative interviews to collect primary data.
Results and conclusion:
The participants from both the qualitative and quantitative study are broadly worried about the health problems associated with high meat consumption and motivation for reducing meat consumption was based on health as well as ethical issues. Being opposed to reducing meat consumption is a common position for young adult omnivores.
Keywords:
Negative effects, Reduction of meat consumption, Meat alternatives, Expected liking, Consumer willingness, Diet habits and attitudes, Motivation toward meat consumption.
iv
Sammanfattning Bakgrund:
Kött är ett av de mest näringsrika och mest konsumerade livsmedlena. Med anledning av att man funnit negativa effekter av en hög konsumtion av kött har man vetenskapligt alltmer börjat intressera sig för konsumentens vilja att ändra sin köttkonsumtion.
I Sverige uppmanade Livsmedelsverket Sveriges befolkning att konsumera mindre rött kött och bearbetade köttprodukter. Bakgrunden till detta var att 72 % av männen och 42 % av kvinnorna i Sverige har individuella konsumtionsnivåer som överstiger 500 gram av rött kött och
bearbetade köttprodukter per vecka, vilket är en maxrekommendation från Världscancerforskningsfonden.
Mål:
Denna blandmetodstudie undersöker attityden för att minska köttkonsumtionen hos unga vuxna allätare i Sverige, deras förväntade åsikter kring förändrade kostvanor samt deras motivation att minska sin köttkonsumtion.
Metoder:
I den aktuella studien ingår en metoddesign som innefattar både en kvantitativ undersökning och kvalitativa intervjuer för att samla in primära data.
Resultat och slutsats:
Deltagarna från både den kvalitativa och den kvantitativa undersökningen är i stort sett överensstämmande och visar att försökspersonerna är oroliga för de hälsoproblem som är förknippade med hög köttkonsumtion och deras motivation för att minska köttkonsumtionen baserades på frågor kring hälsa och etik. Det var vanligt förekommande bland
försökspersonerna att vara bunden till köttkonsumtion.
Nyckelord:
Negativa effekter av köttkonsumtion, Minskning av köttkonsumtion, Köttalternativ, Förväntade åsikter, Kostvanor och attityder, Motivation att minska köttkonsumtion
v
Table of Contents
Page Introduction ... 8 Aim ... 10 Literature Review ... 11Health effects of meat consumption ... 12
Effects of meat consumption on the environment ... 14
Habit attitudes towards reduction of meat consumption ... 16
Diet, motivation, and ethical attitudes towards reduction of meat consumption ... 17
Literature deficiencies ... 18
Materials and Methods ... 19
Sample size ... 19
Data Collection ... 20
Validity and Reliability ... 22
Data analysis ... 23
Ethical considerations ... 27
Results 30 General information ... 30
Qualitative data results ... 31
Quantitative data results ... 37
Discussions ... 44
Attitudes towards the reduction of meat consumption ... 45
Changing dietary habits ... 47
Motivation towards meat reduction ... 48
Conclusion ... 50
vi
Appendices ... 59
A Quantitative questionnaire ... 59
B Qualitative questionnaire ... 67
C Overview of the research design ... 75
D Descriptive statistics for the quantitative data ... 76
E Normality distribution of the regression residuals ... 77
F Homoscedasticity of the regression residuals ... 78
Tables 1 The participants' inclusion and exclusion criteria ... 18
2 Questionnaire reproducibility testing ... 23
3 The characteristics of participants in the qualitative and quantitative part of the study, respectively. ... 30
4 Classification of participants' attitudes towards meat consumption ... 39
6 Summary of the hierarchical regression model ... 38
7 ANOVA of the hierarchical regression model ... 39
8 The parameter estimates for the model ... 42
Figures 1 Attitude by the participants in the qualitative part of the study towards meat consumption, presented as the number of keyword mentions ... 31
2 Habits by the participants in the qualitative part of the study towards meat consumption, presented as the number of keyword mentions ... 32
3 Ethical attitude by the participants in the qualitative part of the study towards animal suffering and killing, presented as the number of keyword mentions ... 33
4 Motivation by the participants in the qualitative part of the study towards meat consumption, presented as the number of keyword mentions ... 34
5 Attitude by the participants in the qualitative part of the study towards health effects of meat consumption, presented as number of keywords mentions ... 35
vii
6 Attitude by the participants in the qualitative part of the study towards the environmental impact of meat consumption, presented as the number of keyword mentions ... 36
8
Introduction
Meat is one of the most widely consumed and nourishing foods, yet high consumption has frequently been linked to negative effects on the environment and human health (Bis-Souza et al., 2019; Tarrega et al., 2020). In recent years, there has been increased research on the psychological and sociological impacts of consuming meat products. Some of the research relates to human motivation for consuming meat (Milford et al., 2019), influential factors to meat consumption (Horgan et al., 2019), and the effect of demographics on meat consumption (Min et al., 2015).
The negative environmental and human health effects of meat products have led to increased scholarly attention on the willingness of users to alter meat consumption (Malek et al., 2019). Moreover, there has research on encouraging meat users to make a behavioural change (Weibel et al., 2019) and sensitizing people on the negative environmental effects of meat production (Sanchez-Sabate & Sabaté, 2019). As well, some researchers have examined whether leading food retailers might influence consumers to accept meat alternatives (Gravely & Fraser, 2018) and others have examined whether mixed meat and vegetable diet would be an appealing meat alternative to consumers (Tarrega et al., 2020).
Consequently, scholars within the food science industry have recently focused on the production of these meat substitutes with the ambition not to affect texture and taste qualities. For example, Kumar (2019) examined the use of fat replacers to develop low fat processed meat products without the loss of texture and taste qualities. Other examined areas include; meat processed with dietary fibres (Barretto et al., 2015) improving meat microbiological stability (Saldaña et al., 2018), replacing meat fat content (Bis-Souza et al., 2019), new meat fermentation processes (Maere et al., 2018), and adding probiotics as well as prebiotic microorganisms to meat products (Neffe-Skocińska et al.,
9
2016). Few studies have focused on measuring the attitudes and perceptions of adult omnivores towards reducing their meat consumption (Tarrega et al., 2020; Bis-Souza et al., 2019; Milford et al., 2019; Horgan et al., 2019; Min et al., 2015). Furthermore, the few studies measuring the attitudes and perceptions of reducing meat consumption among adult omnivores have primarily been from a quantitative perspective and lack understanding from a qualitative approach (Bis-Souza et al., 2019; Tarrega et al., 2020; Milford et al., 2019; Horgan et al., 2019; Min et al., 2015).
In Sweden, a guideline by the Livsmedelsverket (the Swedish National Food Agency) in 2015 encouraged people to consume less red and processed meat (Darnerud & Ilbäck, 2014). About 72 percent of men and 42 percent of women in Sweden have individual consumption levels that exceed the 500 grams per week of red and processed meats recommended by the World Cancer Research Fund (WCRF; Bjerselius, Konde, & Färnstrand, 2014). On average, Swedish women consume 480 grams of red and processed meats per week, whereof 35 percent is processed meat. Swedish men on average consume 800 grams of red and processed meats per week, whereof 35 percent is processed meat. In addition, when the average of the highest meat consumers was computed (5 percent of individuals with the highest consumption), it was established that Swedish men consumed 1670 grams and Swedish women consumed 1000 grams of red and processed meats per week (Bjerselius, Konde, & Färnstrand, 2014). These statistics highlight the need to investigate the attitude, perception, and motivations towards the reduction of meat consumption in Sweden, particularly red and processed meats. A study of reducing meat consumption is significant for several reasons.
First, understanding consumer motivations and habits toward meat consumption can help reveal their meat “involvement”. Involvement is a crucial characteristic that shapes consumer response towards food products according to Hung et
10
al. (2016). In this case, involvement reveals the perceived personal importance or interest evoked by meat products. For example, how users make decisions towards meat products, the importance of meat to a person, and the feelings of pleasure it provokes. This would help food manufactures and policymakers come up with strategies to change consumer motivations and habits towards meat consumption.
Second, a fundamental decision confronting all societies’ concerns climate change. Research has found that meat production has a direct impact on the environment through the conversion of land for agriculture (Ramankutty & Foley, 1999), over-grazing (De-Sy et al., 2015), over-fertilization of grazing areas (Graesser et al., 2015), and greenhouse gas (GHG) emissions (Godfray et al., 2018). This study examines the perception of meat consumers towards the environmental impact of meat production. Knowledge of the attitude of meat consumers towards the environmental impact of meat production can serve as input for policymakers in making meat production policies.
Third, analyzing consumer perception towards their dietary needs, health, and habit of meat consumption can help stakeholders come up with strategies that improve consumers' confidence as well as motivation in reducing meat consumption. To this end, the study examines perception of the participants towards changing their dietary habits. Changing dietary habits in the current context refers to the participant’s willingness to favour meat alternatives (Tarrega et al., 2020). Furthermore, food science practitioners and other stakeholders would understand the factors that both positively and negatively influence the reduction of meat consumption in Sweden.
Aim
This mixed-methods study inquires about the attitudes of young adult omnivores towards meat consumption, changing dietary habits, and motivation towards the
11
reduction of meat consumption in Sweden. A convergent mixed-methods study is used to discuss the observed differences and similarities between qualitative (text) and quantitative (numeric) data. The study answers the following specific questions:
(1) What are the common attitudes among young adult omnivores towards meat consumption in Sweden?
(2) What is the agreement between the quantitative and the qualitative findings on young adult omnivores’ attitude towards changing dietary habits on meat consumption in Sweden?
(3) Do the young adult omnivores have the motivation to reduce their meat consumption?
Literature Review
Few studies have focused on measuring the attitudes and perceptions of meat users towards reducing their consumption. Nonetheless, meat consumption and the quantities of consumed meat have been rising, fuelled by increasing income levels as well as significant population growth according to the Food and Agriculture Organization (FAO, 2018). The FAO (2018) dataset contained projections on meat products, besides other agricultural commodities, and included data on production, output, prices, trade balance, consumption, ending stocks, and transformation, etc. The data dates back to 1970 and covered up to 2018. Advanced analyses indicate major changes in the type of consumed meats towards increased intake of pork and chicken. Moreover, and more important to the current study, a greater proportion of the consumed meat is often processed before purchase (FAO, 2018).
12
Health effects of meat consumption
In most western countries, statistics show that the mortality rates are moderately higher for individuals with high intake of both red and processed meat than individuals with low consumption levels (Wolk, 2016). However, there have been no similar associations between mortality and consumption of poultry meat (Jackson et al., 2016; Rohrmann et al., 2013). Strong evidence of the negative effects of processed red meat consumption on human health was found on colorectal cancer. For example, the International Agency for Research on Cancer (IARC) categorized processed red meat as a carcinogen to human health. This was because of the association between processed red meat and colorectal cancer. According to Bouvard et al. (2015), red meat is generally categorized as possibly carcinogenic because it correlates with colorectal cancer.
According to global estimates by IARC, 34,000 cancer-related deaths annually are related to high processed meat diets. Furthermore, high red meat diets might be attributable to approximately 50,000 cancer-related deaths per year globally if the reported link between red meat and cancer were proved as causal (IARC, 2015). The average processed meat intake in Europe calculated based on IARC classification would result in a 9% increase of colorectal cancer risk (Micha, 2015). High processed meat consumption has been linked to increased stomach cancer risk, but no strong evidence it might increase the risk of other cancers. These IARC classifications of red meat were based on the analysis of epidemiology data and mechanistic evidence from 800 human and animal studies (IARC, 2015). The study hypotheses established that using nitrite to preserve meats, smoking of meat, and cooking of meat at high temperatures produces different carcinogenic compounds such as N-nitroso compounds (NOCs), polycyclic aromatic hydrocarbons (PAHs), and heterocyclic aromatic amines (HAAs; Turesky, 2018). Also, the ingestion of heme from meat catalyses the formation of lipid peroxidation products (LPOs) and NOCs
13
in the digestive tract. These carcinogenic compounds form DNA adducts, which are covalent modifications of the DNA that can initiate carcinogenesis (IARC, 2015).
Consumption of processed meat has been further linked with increased risk to other diseases, albeit non-conclusive evidence. For instance, studies have reported high processed meat intakes are attributable to a moderate increase in mortality risk from cardiovascular illness (Rohrmann et al., 2013). The research suggested that high processed meat intake was responsible for an increased risk of diabetes (Wolk, 2016), and weight gain (Vergnaud et al., 2010).
In Western countries, reduced meat intake is an indicator of a healthy lifestyle, but in developing countries, reduced meat intake is an indicator of poverty and is correlated with risk factors of poor health (Farvid et al., 2017). For example, a meta-analysis in Asia and a recent Iranian cohort study suggested that meat consumption was significantly lower compared with the United States (US). Importantly, the studies found no correlation with the overall risk of mortality, cancer-related mortality, or mortality from cardiovascular illnesses (Farvid et al., 2017).
Nonetheless, red meat is highly nutritious, especially from naturally fed and raised animals. Red meat richly contains vitamin B12, a vital nutrient for proper functioning of the human body system. Research has found evidence that red meat can significantly contribute to the overall vitamin D intake, particularly for individuals consuming less oily fish diet or have limited exposure to direct sunlight (Wyness et al., 2011). Red meat contains 25-hydroxycholecalciferol, which is a vitamin D metabolite that is assimilated more easily and quickly than vitamin D from other dietary forms. For individuals with limited exposure to direct sunlight, red meat provides protection against rickets, which is caused by severe deficiency of vitamin D (Dunnigan & Henderson, 1997).
14
Additionally, red meat primarily contains heme iron, which is utilized and absorbed much more efficiently compared with the non-heme iron contained in plant – based foods (Wyness et al., 2011). According to Wyness et al. (2011) red meat is a rich source of zinc, which is highly bioavailable, and the smallest amount of red meat can significantly increase utilization of zinc from all other food sources. Zinc is a vital nutrient that is important for many physiological functions such as structure in some enzymes and proteins, as well as regulating gene expression (Hunt, 2003). Finally, red meat significantly contains other minerals including copper, cobalt, magnesium, chromium, phosphorus, selenium, and nickel (Wyness et al., 2011).
Overall, while meat has been linked to cancer- and cardiovascular-related deaths, meat still contains essential nutrients that are important for the body to perform its vital functions, such as high quality protein, essential amino acids, as well as micronutrients including iron, vitamin B12, and zinc (Wolk, 2016). However, these nutrients can still be obtained without eating meat by consuming a wide variety of other foods according to a study in the United Kingdom (Appleby et al., 2015).
Effects of meat consumption on the environment
Over the past 20 years, researchers in the life-cycle field have examined greenhouse gas (GHG) emissions (Godfray et al., 2018). The agricultural sector accounts for 25.5% of total global emissions. Methane is among the most significant GHGs, which has 21 times more potential for global warming compared with carbon dioxide. Ruminant livestock such as cows contributes the biggest share of total methane emission (Godfray et al., 2018). The emission produced by cows is not only related to environmental problems but is linked to energy losses. Research has found that meat produced increases GHG emissions per kcal than the production of plant-based foods. This is because, at each trophic level in the food web, the energy is lost (Godfray et al., 2018). There are four trophic levels:
15
producers that make their food (plants and algae), primary consumers (herbivores that consume plants), secondary consumers (carnivores that consume herbivores), and tertiary consumers (carnivores that consume other carnivores). At each trophic level, energy loss occurs as metabolic heat as organisms eat other organisms from the preceding trophic level (Godfray et al., 2018). When the production of different types of meat was analyzed, ruminant production led to high emissions compared with non-ruminant mammals. Production of poultry led to fewer emissions compared with mammals. According to Godfray et al. (2018), these differences were contributed by the fact that 8% of beef production occurs in extensive, grass-fed–only systems. Grazing has a complex effect on the environment such as emissions through erosion and overgrazing. The system of meat production is important to the environment. Per output unit, intensive rearing of animals produces fewer emissions compared with extensive systems.
Furthermore, the most significant direct impact of meat production on the environment is through the conversion of land for agriculture (Ramankutty & Foley, 1999). This includes converting natural habitats to grasslands for livestock grazing and to arable land for grain as well as soya production for livestock consumption. For example, De-Sy et al.'s (2015) analysis of South American rainforest conversion suggested that approximately 71% of conversion was for cattle ranching. Furthermore, another 14% conversion was for commercial cropping, which included soya for animal feed (Graesser et al., 2015). For the last two decades, soya exports from South America to the rest of the world had dramatically increased to constitute one of the leading global commodity flows. In Europe and the US, most grazing areas are over-fertilized. Meaning the soil is overloaded with contaminants, particularly phosphorus and nitrogen, which contaminate surface and groundwater. The production of livestock negatively affects the environment through overgrazing, which has deleterious effects in drylands (Graesser et
16
al., 2015). The higher offtake from the ecosystem by livestock (compared with wild herbivores offtake) reduces and changes the diversity of plant species. Eventually, the trampling on slopes and reduced plant cover results in soil erosion as well as additional biodiversity loss (Graesser et al., 2015).
Habit attitudes towards reduction of meat consumption
The negative effects of meat consumption have led to increased scholarly attention on the user willingness to alter meat consumption (Malek et al., 2019). For example, Ruby (2012) through a meta-analysis reviewed the existing literature, studying vegetarianism motivations and existing dietary variants of meat reduction. The study examined the different attitudes, perspectives, values, and distinct gender differences between vegetarians and omnivores. The results indicated that non-omnivores were intensely criticised in traditionally farm-based cultures, in which meat contributed a significant percentage to the economy. Cultural shaped emotions and norms had a strong effect on the user’s sense of immoral and moral attitudes. Based on the findings, the author recommended a broader analysis of meat consumption attitudes across different cultures.
Moreover, Lupton and Turner (2018) examined the attitudes of Australian participants towards a range of insect-based ingredients and laboratory-cultured meat combined using a three-dimensional (3D) printer. Data were collected using online surveys and discussions. The results showed that the food consumption priorities of the participants centred on qualities of taste, naturalness, and health. Meaning, 3D printed meat products were considered unnatural, and hence not fresh, not nutritious, lacking taste, and potentially harmful. Based on the findings, the authors concluded that the acceptability and appeal of using 3D printing technologies to combine ingredients like insects or cultured meat had to overcome major cultural obstacles.
17
Furthermore, Weinrich and Elshiewy (2019) analyzed the preferences of consumers towards meat alternatives based on microalgae. A quantitative conjoint analysis was performed involving 938 consumers in Germany, France, and the Netherlands to reveal user willingness as well as preferences to reduce meat consumption. The results revealed that non-frequent meat consumers had a high likelihood of reducing meat consumption by choosing meat alternatives based on microalgae. Nonetheless, frequent meat consumers showed significant difficulties with the reduction of their meat consumption. Based on the results, the study recommended the need for future research to understand user attitudes towards the reduction of meat consumption.
Diet, motivation, and ethical attitudes towards reduction of meat
consumption
Siegrist and Hartmann (2019) examined the ethical effect of health consciousness, food preference, and disgust sensitivity on the consumption of organic meat. The study analyzed quantitative data drawn from 5586 participants of German and French origin in Switzerland. The results showed that omnivores with low levels of meat consumption, understanding the unethical effects of meat production, and low sensitivity of food disgust were more likely to reduce meat consumption. Also, high health consciousness, being young, female, and better education were other factors associated with the reduction of meat consumption. Based on these findings, the study concluded that high consumer knowledge of the ethical and environmental effects of foods would lead to a viable reduction of meat consumption.
Finally, Tarrega et al. (2020) investigated the readiness of omnivores to introduce 100 per cent vegetable protein and mixed beef-vegetable protein into their diet. Quantitative data was collected from 251 participants using a structured questionnaire focusing on habits, diet, ethics, health, the environment, and hedonism. The findings
18
revealed that the motivations of consumers favourable towards their reduction of meat consumption were based on health and ethics issues, whereas consumers opposed to reduction of their meat intake alluded to dietary and enjoyment habit. Based on the study findings, the authors concluded that meat alternatives could be a reliable, yet timid, option for attached omnivores (individuals opposed to reducing their meat consumption). However, unattached omnivores (individuals unopposed to reducing their meat consumption) would consider 100 per cent vegetable protein and mixed beef-vegetable protein a worthy alternative to meat.
Literature deficiencies
Overall, the aforementioned studies have examined attitudes and perceptions of consumers towards meat consumption, albeit from a quantitative perspective. Despite the increasing interest in the reduction of meat consumption, it is surprising that so little empirical research has been conducted on the topic in Sweden, especially from the qualitative perspectives. This is despite the significant evidence linking processed and red meat with negative effects on the environment and human health (Bis-Souza et al., 2019; Tarrega et al., 2020). Bullock et al. (2017) suggested that quantitative design is suitable for measuring attitude, opinion, and behavior. Quantitative designs are suitable for answering questions dealing with quantity such as when, how often, who, how much, or how many. However, the quantitative design is suitable to extend the understanding of a research area. On the contrary, a qualitative design is suitable when there is little knowledge concerning a specific issue and is applied to measure a variable’s quality. Research on the attitude and perceptions of consumers towards meat consumption is especially scarce in Sweden. Therefore, because of the limited research in Sweden, it is suitable for this study to use a mixed-study design to enable the researcher to get a deeper understanding of the topic (Creswell, 2014). A qualitative focus would help gain an in-depth perspective on attitudes
19
and perceptions of consumers towards meat consumption. The in-depth perspective would benefit academia by providing new insight into the existing literature on consumer attitudes towards meat intake and perceptions of meat alternative foods in Sweden.
Materials and Methods
Sample size
The target population of this convergent mixed-methods study is young adult omnivores in Mälardalen University, Västerås, Sweden. This aligns with the prior research by Tarrega et al. (2020) that involved young adult omnivores. Mälardalen University has a population of 5,000 students. The educational programs offered by Mälardalen University include business courses, communication, engineering courses, health sciences, law, computer and information sciences, as well as mathematics. Additionally, approximately 95% of the students are below the age of 35 years (Mälardalen University, 2020). The simple random sampling technique is used to sample the participants, which is calculated using Yamane’s sampling formula, assuming a 0.5 margin of error. The margin of error indicates how many percentage points the results will vary from the actual population value (Yamane, 1973).
𝑛 = 5000
(1 + 5000 𝑥 (0.05)2)
𝑛 = 370.33
Hence, the study samples 370 young adults from Malardalens University in Västerås, Sweden to participate in the study. Data collection for the qualitative part of the study is from 30 out of the 370 participants included in the study and the remaining 340 participants are included in the quantitative part of the study. To this end, the process begins with an initial random selection of 370 participants out of the 5000 students for inclusion
20
in the study. Out of the 370, the researcher then randomly selects 340 participants for inclusion in the quantitative part of the study and 30 participants to take part in the qualitative part of the study.
Access is granted from the university’s student database from the dean of studies. The study uses a simple random technique to sample the participants for both the qualitative and quantitative parts of the study. This means that all the students have an equal chance of inclusion in either part of the study if they satisfy the inclusion criteria. The participants' inclusion and exclusion criteria are presented in table 1.
Table 1
The participants' inclusion and exclusion criteria
Inclusion Criteria Exclusion Criteria
• Students at Mälardalens University in Vasteras
• Following any restrictive diet including reduced calorie intake or avoidance of specific foods
• Omnivore consumer of red meat at least once a week
• Age of 18 and 35 years old
To screen the participants, both the inclusion and exclusion criteria are included in the questionnaire’s profile section, where participants are requested to indicate their age and dietary habits. Where a participant’s response violates the inclusion or exclusion criteria of the web-based survey, the data collection would end. Similarly, where the participant’s response violates the inclusion or exclusion criterion of the qualitative questionnaire, the researcher would end the interview.
Data Collection
In this mixed-methods approach, data is collected simultaneously using a questionnaire adapted from the study by Tarrega et al. (2020) to measure young adult omnivore’s attitude towards meat consumption, changing their dietary habits, and
21
motivation towards the reduction of meat consumption in Sweden. The rationale for using convergent mixed methods is to collect both qualitative and quantitative data in the same phase of the research process. Meaning both methods are equally assessed, independently analyzed, and the results triangulated to establish the differences or similarities between the responses.
Quantitative data is collected using a web-based survey. A questionnaire is developed to assess the participant’s attitudes towards meat consumption, changing dietary habits, and motivation towards the reduction of meat consumption. The questionnaire comprises 36 statements (see Appendix A), all adapted from the previous questionnaire by Tarrega et al. (2020), that covered six aspects (Diet, Habits, Ethics, Motivation, Health, and Environment).
The study participants rate their level of agreement with each statement using a 7-point Likert scale represented as:
• 1 = Strongly disagree • 2 = Mostly disagree • 3 = Somewhat disagree • 4 = Neither disagree nor agree • 5 = Somewhat agree
• 6 = Mostly agree • 7 = Strongly agree
The order of presenting the statements in the questionnaires is varied following a balanced design, where some statements are reverse coded. Similar to the study by Tarrega et al. (2020), the participants are grouped into PRO-meat reduction, ANTI-meat reduction, and intermediate (INTERM-) groups based on their scoring of these statements.
22
The qualitative data is collected using face-to-face interviews. A qualitative questionnaire (see Appendix B) is framed based on the six themes in the quantitative questionnaire (Diet, Habits, Ethics, Motivation, Health, and Environment). Several follow up questions are prompted based on the responses given by the respondents to allow the elaboration of answers as recommended by Johannesson and Perjons (2014). The researcher uses appointment to book interview time with the participants sampled for the qualitative study. It is estimated that each interview takes approximately 40 minutes to complete. Once a suitable time and date are agreed upon, the face-to-face interviews for qualitative data collection take place. Both the quantitative and qualitative participants have a maximum period of 21 days to give their responses. The researcher sends reminders every 7 days to help increase the response rate. An overview of the research methodologies for both the quantitative and qualitative data is presented in Appendix C.
Validity and Reliability
The questionnaire’s content validity needs testing to ensure the collected data is both reliable and accurate. Tarrega et al. (2020) established that their questionnaire Cronbach's α values were higher than 0.6 for all the six dimensions. This indicated the statements had good reliability for measuring the attitudes and perception of consumers regarding each element related to reducing meat consumption. The researcher carries out a reproducibility study to test the questionnaire using pilot testing.
In the study, piloting is done on 20 participants for the quantitative design, who are recruited from the target population but excluded from the main study. The pilot study ensures any questionnaire errors are identified and corrected early to collect reliable and valid data. Table 2 below presents Cronbach’s alpha findings from the questionnaire piloting. As table 2 presents, all the variables have Cronbach’s alpha value of >.7, indicating good internal data reliability similar to the study by Tarrega et al. (2020).
23
Table 2
Questionnaire reproducibility testing
Variable No of
Items
Cronbach’s alpha
Diet attitude 7 .910
Attitude toward meat alternatives 5 .892
Ethical attitude of animal suffering 6 .702
Motivations towards meat consumption 8 .766
Attitude toward health effects 5 .776
Environmental concerns 5 .792
In addition, qualitative data need testing for reliability. The intercoder agreement proposed by Creswell and Clark (2018) helps achieve the reliability of the collected qualitative data. This procedure involves establishing a codebook, and then several individuals code the transcript of the collected data. Comparison of the coded transcripts is done to establish any differences or similarities in the coding. The data is considered reliable if there are minimal differences in the coding.
Data analysis
Qualitative data analysisThe interpretation of the qualitative data involves the classification of data into meaningful and relevant categories before performing the thematic analysis (Saunders et al., 2016). During the categorization process, the collected raw data is organized into meaningful themes or categories, which are used to establish a codebook. The next analysis phase involves assigning relevant units of data to the identified themes. The researcher groups the qualitative data into relevant units, which allows thematic analysis. Because the aim is for the qualitative results to complement the quantitative findings, answers for each question are associated with the 36 statements in the study using keywords. For example, “if a participant indicates that it is a must to eat meat every day”, then such answer is related
24
with the keywords “meat is irreplaceable” and associated with the statement “meat is irreplaceable in my diet”. Some of the other possible keywords include “unnatural”, “unhealthy”, “tasteless”, and “provides energy”, among others. A question can contain several keywords, indicating multiple responses. To this end, the researcher counts the number of mentions for each keyword (which is associated with each of the 36 statements) and the results are reported. Additionally, some direct quotations are considered important and are highlighted for inclusion in reporting the findings. A chart is developed, which records the pennames assigned to the participants as the main identification feature. Quantitative data analysis
The statistical data analyses use the procedures described in the following paragraphs. Because the quantitative study collected Likert-type data, the aim is to establish the central tendency (where most participants have an agreement) and the spread of the responses (the level of agreement between participants). Two key statistics allowing this kind of analysis include the median and Inter-Quartile Range (IQR) of each item. The median shows the central tendency and IQR shows the level of agreement from the dispersion of the responses.
Multiple linear regression is a popular and the simplest statistical method that uses a set of explanatory variables to predict the outcome of a response variable (Field, 2013). This makes multiple linear regression suitable in the study to predict the attitude of participants towards the reduction of their meat consumption. To perform multiple linear regression, the sum of the Likert items for each of the six explanatory variables (Diet, Habits, Ethics, Motivation, Health, and Environment) is computed to derive the Likert scale score for each variable. The measurement level of the sum is treated as an interval scale if each variable has five or more items. According to Glass et al. (1972), and Lubke and
25
Muthen (2004), transforming Likert-type data into interval data can allow parametric tests to be performed where assumptions for each test are not violated.
To derive the dependent variable (the response variable), the individual sum of the 36 items allows the researcher to compute the average score for each participant, and the participants are grouped as PRO-meat reduction, ANTI-meat reduction, and INTERM groups. The groups include: Pro (participants willing to reduce their consumption of meat, mean scores spanning 4.6 to 7), Anti (participants not willing to reduce their consumption of meat, mean scores spanning 1 to 3.5), and Interm (participants having intermediate attitude between Anti and Pro, mean scores spanning 3.6 to 4.5).
Multiple linear regression is applied to analyse the relationship between the explanatory variables (from herein referred to as the independent variables – IV’s) and the response variable (from herein referred to as the dependent variable - DV). The “enter” method is used, where all the covariates are entered at once and their level of significance determined. The model is represented by the following expression
Y = β0 + β1X1 + β2X2 + β3X3 + β4X4 + β5X5 + β6X6 + β7X7 + β8X8 Ԑ
Where
• Υ= attitude towards the reduction of meat consumption (PRO, ANTI, and INTERM group)
• β1…Β8= coefficients of determination
• Х1 = Diet attitudes towards meat consumption
• Х2= Habits towards meat consumption
• Х3= Ethics toward animal suffering and killing
• Х4= Motivation of meat consumption
• Х5= Health attitudes towards meat consumption
• Х6= Environment attitudes towards meat consumption
• Х7= Age
26 • Ԑ = Error term
This expression represents the correlation between the IV’s and the dependent variable DV as a weighted average. In this case, the (β’s) are the regression weights and the primary regression assumption is that each of the IV has an additive effect. Gender and age of the participants are used as control variables. Four assumptions are made by the researcher in using the regression model: the data is normally distributed, there is linearity (a linear relationship between the DV and IVs), the residuals are homoscedastic, and there is no multicollinearity.
Homoscedasticity test is done to check whether the residuals have an equal distribution. To test the homoscedasticity of the regression residuals, a visual examination is done on the Predicted Probability (P-P) plot of the standardized residuals. Regression residuals are normally distributed randomly around 0, which provides a relatively even distribution.
To check whether data is normally distributed, the P-P plot is visually examined to check the distribution of the regression residuals. As proposed by Berry and Feldman (1985), the regression residuals should follow the diagonal normality line for data to have a normal distribution. To test linearity and multicolinearity, the variance inflation factor (VIF) values and Tolerance values from the multiple linear regression test are applied. Multicolinearity between the independent variables results in a strong correlation. The VIF values for the IV’s should have scores spanning >1 and <10. Moreover, the tolerance values are the reciprocal of the VIF values. The IV’s should have tolerance values of >.10. Both the tolerance values and VIF values indicate there is linearity and there is no multicolinearity.
27
Ethical considerations
Generally, there are various ethical considerations made in the study. When approaching the study participants, the researcher explains the aim and purpose of study. As well, the researcher makes it clear that there are no risks, costs, or benefits for participating in the study. Furthermore, the researcher assures the participants that reasonable precaution is taken to protect the participant’s responses and identity such as not revealing identification information such as an address, name, phone number, or phone number.
The researcher has the responsibility of selecting a site and population of study without any deliberated interests. Similarly, the study uses a questionnaire from a previous study (Tarrega et al., 2020). This allows the maintaining of the objectivity required for quantitative research and the full expression of varying perspectives needed in qualitative research (Creswell, 2014).
The researcher has the ethical responsibility of not pressuring participants into signing consent forms. Participation in the study is voluntary and participants receive all the instructions for the consent form to decide freely their participation in the study. Moreover, participants receive all the instructions that remind them about the purpose of the study. Other ethical issues considered involve ensuring no suppressing, inventing, or falsifying findings to satisfy the needs of the researcher or the study audience (Creswell, 2014).
Citations provide credit for other works paraphrased and quotation marks indicate the exact words claimed from others throughout the study (Johannesson & Perjons, 2014). This is because the researcher has the ethical responsibility of ensuring work by others is not presented as their own. This study maintains confidentiality of any information that could harm participants and the participants retain the ownership of their responses as
28
well as exercise their independence in decision-making. Regarding data storage, the researcher securely stores data in a password-protected drive, before permanently deleting the data after the master thesis is completed (Veal & Darcy, 2014).
Qualitative study ethical consideration
The researcher has the ethical responsibility of pre-anticipating the possibility of disclosure of harmful information during the interview process (Veal & Darcy, 2014). The qualitative questionnaire does not include any questions that might be considered ethically sensitive. The qualitative data ensures the anonymity of participants throughout the study by not collecting contact information and using pennames throughout the reporting of the findings. The ethical code for the researcher is to protect the participant’s privacy and convey the protection to all involved individuals. The researcher has an ethical responsibility of not withholding important results and not to report the thematic results based on personal inclinations (Creswell, 2014). As such, the study reports the full range of qualitative findings, including results that contradict the study themes (Johannesson & Perjons, 2014). Similarly, the researcher does not support and embrace the participants’ perspectives in the study by “taking sides” and only presenting the findings that place the participants favorably. Finally, the researcher uses pseudonyms for participants in qualitative research to protect their identity.
Quantitative study ethical considerations
The quantitative questionnaire does not include any questions that might be considered ethically sensitive. The quantitative study protects the anonymity of participants throughout the data collection process by not collecting names or contact information. During quantitative data analysis, the researcher has an ethical responsibility of not disregarding data that is contrary to the personal understanding of the topic (Veal & Darcy,
29
2014). The data analysis reflects the performed statistical tests in full and no results are underreported. The interpretation of data provides an accurate account of the collected information (Creswell, 2014).
30
Results
This chapter reports the findings from the data analysis and interpretation of the results from the qualitative as well as quantitative results. From the quantitative study, 51 responses from the quantitative study failed the inclusion or exclusion criterion, that gives 289 valid responses out of a sample of 340 participants. Moreover, data were collected from 28 participants out of the 30 participants selected for the qualitative study; meaning that two participants did not pass the inclusion or exclusion criterion. The participants in the qualitative part of the study were assigned pennames to protect their identity, from SP1 to SP28.
General information
Table 3
The characteristics of participants in the qualitative and quantitative part of the study, respectively. Quantitative Qualitative N Percent N Percent Gender Male 189 65 16 57 Female 100 35 12 43 Age 18 to 25 years 96 33 9 32 26 to 35 years 193 67 19 63 Diet Habits
Currently following a restrictive diet 0 0 0 0
I am currently avoiding meat products 0 0 0 0
My diet is purely vegetables 0 0 0 0
My current diet includes meat products 289 100 28 100
Total 289 100 28 100
The participants were requested to provide basic information such as age, gender, and current diet habits. Based on the findings illustrated in table 3, the majority of the study participants were males for both the quantitative (65%, N=189) and the
31
qualitative (57%, N=16) studies. Finally, the diet for all the qualitative and quantitative participants included meat products. Table 3 gives sample characteristics of participants in the qualitative and quantitative part of the study, respectively
Qualitative data results
This section reports the results from the qualitative study. Diet attitudes towards meat consumption
Figure 1: Attitude by the participants in the qualitative part of the study towards meat consumption, presented as the number of keywords mentions
The first theme examined in the qualitative study was related to diet attitude towards meat consumption. The majority of the participants had similar feelings and thoughts; however, each participant still had some distinct narrative to tell about their lifestyle. Their attitudes and lifestyles are personal stories that are different from the individuals themselves. Most of the keywords mentioned frequently in this variable related to meat being irreplaceable. As figure 1 presents, meat being irreplaceable was
0 2 4 6 8 10 12 14 It is possible to have an adequate diet without eating meat I need to eat meat to stay full for longer
Meat is irreplaceable in my diet I need to eat meat to have enough energy Eating meat is important for a complete diet All things considered, meat is necessary in the human diet If I couldn't eat meat I would feel weak No of Mentions
32
mentioned 13 times. Furthermore, the participants mentioned that they needed to eat meat to have a complete diet and enough energy.
For example, participant SP8 noted that eating meat “provided more energy than other foods like vegetables, pasta or rice”, and made him stay longer without getting hungry. According to participant SP24, failing to eat meat for a day would make him have less energy and nothing would replace meat in his diet. However, some participants mentioned that they would not have a problem reducing their meat consumption. For example, participant SP7 mentioned that she was a vegetarian when growing up but got influenced to eating meat by her spouse after getting married.
Habit towards meat consumption
Figure 2: Habits by the participants in the qualitative part of the study towards meat consumption, presented as the number of keywords mentions
The study established from the qualitative data that the participants could not picture themselves without eating meat regularly as figure 2 presents. Whereas the participants acknowledged that there were good alternatives to meat consumption, most
0 2 4 6 8 10 12 14 16 I will consider changing my habits
only if other also change theirs
Nowadays there are good alternatives to meat consumption
It is easy to have a
meat-free diet myself withoutI don't picture eating meat
regularly
I would feel fine with a meatless diet
33
of the participants indicated that they would only consider meat alternatives if they "tasted good, had sufficient nutrients, and were not expensive". According to some of the participants, they considered meat healthier than any vegetable or manufactured meat alternative. For example, participant SP19 mentioned that she had tried a meatless diet for three months and ended up gaining weight, feeling hungrier, as well as weak.
Ethics toward animal suffering and killing
Figure 3: Ethical attitude by the participants in the qualitative part of the study towards animal suffering and killing, presented as the number of keywords mentions
From the qualitative data, it was established that the participants would have no problems eating meat even if they saw an animal being killed (no of mentions=18) as figure 3 presents. The majority of the participants considered the killing of animals for meat as part of the food chain and they did not think it was wrong. For example, participant SP21 mentioned, “it is ethical because it sustains the food chain, the same way the animals consume plants”. However, a few of the participants acknowledged that they had problems with animals being killed and their suffering. For instance, SP2 highlighted
0 2 4 6 8 10 12 14 16 18 20 It would be difficult for me to watch an animal being killed for food
purposes
If I had to kill the animals myself, I would probably stop eating meat
If I saw an animal being killed, I would have no problems eating it Eating meat reminds me of
the death and suffering of the
animals
I feel bad when I think about eating meat because of the animal suffering When I think about eating meat I feel guilty
34
that sometimes he feels guilty when thinking about the suffering of animals; however, this does not affect his meat consumption. Also, SP3 mentioned that he felt too guilty when thinking about the death and suffering of the animals.
Motivations of meat consumption
Figure 4: Motivation by the participants in the qualitative part of the study towards meat consumption, presented as the number of keywords mentions
Based on the findings of figure 4, the participants in the qualitative part of the study would be sad if they were forced to stop their meat consumption. According to SP17, the nutrients contained in meat are essential to the body, and it would be difficult to find another food that can provide a similar amount of nutrients. The participants love meals with meat because it made them stay full for longer. As such, the meat had to be part of their diet. Some participants stated that eating meat was one of the good pleasures in life. For example, SP5 mentioned that meat is tasty and full of proteins as well as other nutrients. Figure 4 presents a summary of the findings, which are presented as the number of mentions for keywords associated with each factor.
0 2 4 6 8 10 12 14 16 18 20 If I was forced to stop eating meat I would feel sad
Nothing can compare with a
good steak
Eating meat is one of the good pleasures in life
I am a big fan of
meat I love meals withmeat meat very muchI love eating No of mentions
35 Health attitudes towards meat consumption
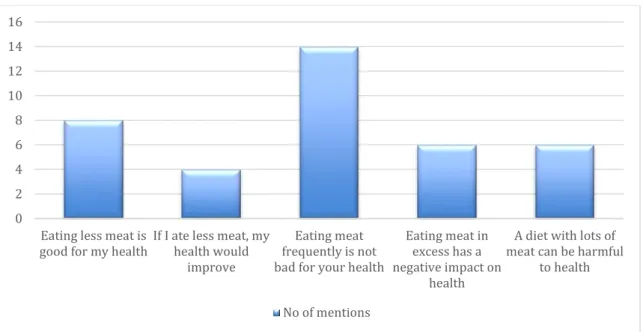
Figure 5: Attitude by the participants in the qualitative part of the study towards health effects of meat consumption, presented as number of keywords mentions
The participants in the qualitative part of the study showed differing opinions about the effect of meat consumption on health. While some participants indicated that eating meat in excess has a negative impact on health, others thought eating meat frequently was not bad for their health. For example, participant SP4 considered meat good for his health, full of essential nutrients, and that nothing could provide similar energy levels. It should be highlighted that the participants who considered meat healthy were sceptical about the production of vegetables and other meat alternatives.
They considered processed vegetables and other meat alternatives unnatural, not tasty, and expensive. In addition, some of the participants indicated eating less meat was good for their health, by eating less meat, their health would improve, and a diet with lots of meat can be harmful to health. For instance, participant SP8 thought that her body would feel better if she reduced meat consumption, especially processed meat. Figure 5 presents the results.
0 2 4 6 8 10 12 14 16
Eating less meat is
good for my healthIf I ate less meat, myhealth would improve
Eating meat frequently is not bad for your health
Eating meat in excess has a negative impact on
health
A diet with lots of meat can be harmful
to health No of mentions
36
Environmental attitudes towards meat consumption
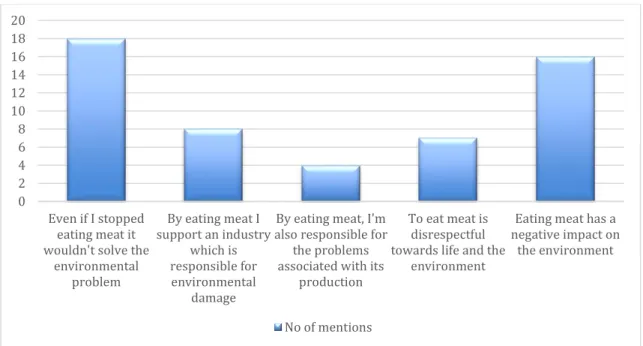
Figure 6: Attitude by the participants in the qualitative part of the study towards the environmental impact of meat consumption, presented as the number of keywords mentions
The qualitative study findings established that most of the participants believed that even if they stopped eating meat, it would not solve the environmental problems. The majority claimed that other industries such as the transport sector were more damaging to the environment than meat production. For example, participant SP1 mentioned that the environment would not be better just because she reduced her meat consumption. This was because the meat production industry was smaller compared to other industries that destroy nature and the environment. As well, SP5 suggested that the environmental issue was bigger than meat production; however, if there were proof that meat production affected the environment more than other factors, he would consider reducing meat consumption.
0 2 4 6 8 10 12 14 16 18 20 Even if I stopped eating meat it wouldn't solve the
environmental problem By eating meat I support an industry which is responsible for environmental damage
By eating meat, I'm also responsible for
the problems associated with its
production
To eat meat is disrespectful towards life and the
environment
Eating meat has a negative impact on
the environment
37
Nevertheless, some of the participants thought that eating meat had a negative impact on the environment and was disrespectful towards life. According to SP13, “… the industrial production of meat is affecting the environment badly since it disrupts the biological clock. This is because meat-farms tamper with the animals’ biology and give them different medicines and supplements to make them grow faster for the changing food industry. This in turn ruins the natural biological cycle and clock of nature”. Figure 6 presents the study findings.
Quantitative data results
This section reports the attitude of the participants towards meat consumption, changing dietary habits, and motivation towards the reduction of meat consumption based on the quantitative study. The quantitative study included 36 statements and the participants ranked their level of agreement for each statement using a 7-point Likert scale (“1”=strongly disagree and “7” = strongly agree). Table 3 illustrates the descriptive statistics of the quantitative study.
Corresponding concern on health and excessive meat consumption appeared to be the most potent reason for the willingness of the participants to reduce meat consumption. The quantitative study participants agreed that they love eating meat very much (Median=5, IQR=1), however, eating meat in excess negatively impacts health (Median=6, IQR=2). Watching the killing of animals was the key concern on ethics with a high agreement (median=5). The participants admitted that they would stop taking meat if they had to kill animals themselves.
Both these results on habit and health indicate that all the participants were generally worried about the health problems associated with high meat consumption. However, the ethical aspects of animal welfare were important only to some individuals.
38
Concerning the dimensions related to being attached to meat (diet and motivations), motivation was the major reason for the participant’s reluctance to reduce their meat consumption. On diet, 50% of the participants disagreed they would feel weak if they did not eat meat (Median=2.00, IQR=4.00). Nonetheless, the participants agreed that eating meat is part of a balanced diet (median=4, IQR=5). On motivation, the participants agreed that they love meals with meat (Median=5, IQR=3). There was also high agreement on the available good meat alternatives in the market (Median=5, IQR=1). Concerning the environment, 50% of the participants strongly agreed that eating meat negatively impacts the environment (Median=6, IQR= 2). The rest of the results are presented in Appendix D.
The mean score for each participant was computed from all the 36 statements to classify the attitude towards meat reduction into three groups. The participants from the quantitative study were categorized as Pro-group, Anti-group, or Interm-group as presented in Table 4. The categorization was based on the participant’s attitude towards consuming meat and its reduction. Out of 289 participants, 62 participants (21%) were categorized as favoring the reduction of meat consumption (Pro-group), 28 participants (10%) were categorized as being against the reduction of meat consumption (Anti-group), and 199 participants were categorized as intermediate (Interm-group).
The majority of the participants in all three groups were male. However, the differences were more pronounced among the anti-group (71%) and pro-group (71%). Similarly, the highest consumers are likely to have an anti-reduction attitude because of pleasure and satisfaction reasons. More women are classified in the Interm-group as compared with the other groups. This means that women are likely to consider their red meat consumption levels as average, hence no need for alteration. Moreover, the 26 to 35
39
years of age category has the majority of the participants across all the three groups. The age variations may be explained by the overall age distribution of the sample (33% = 18 <25 years, 67% = 26 >35 years).
Table 4
Classification of participants' attitudes towards meat consumption
Classification Male Female 18>25 years 26>35 years Total % % % % N % Anti-group 71 29 29 71 28 10 Interm-group 63 37 32 68 199 69 Pro-group 71 29 39 61 62 21
Multiple linear regression
Multiple linear regression was performed to establish the relationships between the variables and determine the effect of gender as well as the age of the participants. The first step of the multiple regression analysis was to test the assumptions that the data is distributed normally and homoscedastic. Appendix E presents the normality distribution results of the regression model. The analysis established that the regression residuals conformed to the diagonal normality line indicated in the plot. This indicated that the regression followed a normal distribution.
The next step after the normality test is checking the homoscedasticity of the regression residuals. The analysis established that the data was homoscedastic as evidenced by the lack of an obvious pattern in Appendix F. There are points distributed above equally and below zero on the X-axis, and to the right as well as left of zero on the Y-axis.
40
Table 5
Summary of the hierarchical regression model
Model R R-Square Adjusted R-Square Error R-Square Change F- Change df1 df2 Sig. F. Change 1 .999a .997 .997 .025 .997 18331.6 6 282 .000 2 .999b .997 .997 .025 .0019 1.048 2 280 .352
Model 1 = relationship between the IV’s: diet, habit, ethics, motivation, health, and environment on the DV: meat consumption attitude.
Model 2 = Controlling the effect of age and gender of the participants Df= degree of freedom
The hierarchical regression model is presented in table 5. Model 1 estimated the relationship between the predictors: diet, habit, ethics, motivation, health, and environment on meat consumption attitude. In Model 2, the effect of gender and the age of the participants on the variables’ relationships was controlled. Model 1 explained 99.7% (R2 = .997) of the variance in meat consumption attitude.
Model 2 (controlling the age and gender of the participants) as a whole explained 99.7% of the variance in meat consumption attitude. The term in model 2 explained 0.19% (R2 = .073) of variance in meat consumption attitude as indicated by the
R-square change column. The level of change in significance for model 2 was not a statistically significant contribution as indicated by the change F=0.352.
Table 6 presents the ANOVA of the regression model. The results indicate
that the models as a whole were statistically significant: F (6. 282) = 18331.677. P < 0.001 for model 1 and F (8. 280) = 13753.704. P < 0.001 for model 2.
41
Table 6
ANOVA of the hierarchical regression model
Model
Sum of
Squares Df Mean Square F-Change Significance
1 Regression 70.995 6 11.832 18331.677 .000b Residual .182 282 .001 Total 71.177 288 2 Regression 70.996 8 8.874 13753.704 .000c Residual .181 280 .001 Total 71.177 288
Model 1 = relationship between the IV’s: diet, habit, ethics, motivation, health, and environment on the DV: meat consumption attitude.
Model 2 = Controlling the effect of age and gender of the participants Df= degree of freedom
The parameter estimates for the multiple regression models are presented in table 7. In model 1, all the variables were uniquely correlated with meat consumption attitude. For example, the diet dimension had the highest positive correlation (β =.708) with meat consumption attitude. In addition, habit was 18.5% (β =.185) positively correlated with meat consumption attitude, while the correlation for ethics = 38.1%, motivation = 41.6%, health = 25%, and the environment = 34.9%. After controlling for the gender and age of the participants in model 2, there was no significant change to the estimates.
42
Table 7
The parameter estimates for the model
Steps Beta β T-value P-value Tolerance VIF
1 (Constant) .007 .415 .678
Diet attitudes towards meat consumption .027 .708 161.145 .000 .469 2.132 Habit towards meat consumption .027 .185 58.529 .000 .906 1.104 Ethics toward animal suffering and killing .028 .381 113.662 .000 .806 1.240 Motivations of meat consumption .028 .416 112.645 .000 .666 1.502 Health attitudes towards meat consumption .026 .250 70.669 .000 .727 1.375 Environmental attitudes towards meat
consumption .026 .349 79.472 .000 .470 2.126
2 (Constant) .011 .650 .516
Diet attitudes towards meat consumption .027 .709 160.566 .000 .465 2.150 Habit towards meat consumption .027 .185 58.534 .000 .903 1.107 Ethics toward animal suffering and killing .028 .381 112.661 .000 .794 1.259 Motivations of meat consumption .028 .416 111.950 .000 .656 1.525 Health attitudes towards meat consumption .026 .250 70.612 .000 .724 1.381 Environmental attitudes towards meat
consumption .026 .350 78.849 .000 .461 2.171
Gender .000 .000 -.053 .958 .982 1.018
Age -.005 -.004 -1.447 .149 .951 1.052
Model 1 = relationship between the IV’s: diet, habit, ethics, motivation, health, and environment on the DV: meat consumption attitude.
Model 2 = Controlling the effect of age and gender of the participants β= standardized beta
VIF=variance inflation factor
In addition, linearity and multicolinearity were tested to ensure there was no strong correlation between the independent variables. As indicated by the VIF values, all the independent variables had scores spanning >1 and <10. Moreover, all the variables have tolerance values of >.10. Both the tolerance and VIF results indicate there is no multicolinearity.
In summary, diet attitudes towards meat consumption appear to have the strongest correlation with meat reduction attitude, followed by ethics toward animal
43
suffering and killing. All the covariates have a positive and significant correlation. Gender and age do not affect the correlations as evidenced in Table 8.