County Differences in Mortality among
Foreign-Born Compared to Native Swedes
1970-1999
Björn Albin, Katarina Hjelm, Jan Ekberg and Sölve Elmståhl
Linköping University Post Print
N.B.: When citing this work, cite the original article.
Original Publication:
Björn Albin, Katarina Hjelm, Jan Ekberg and Sölve Elmståhl, County Differences in
Mortality among Foreign-Born Compared to Native Swedes 1970-1999, 2012, Nursing
Research and Practice, (2012), art.id 136581.
http://dx.doi.org/10.1155/2012/136581
Copyright: Hindawi Publishing Corporation
http://www.hindawi.com/
Postprint available at: Linköping University Electronic Press
Hindawi Publishing Corporation Nursing Research and Practice
Volume 2012, Article ID 136581,9pages
doi:10.1155/2012/136581
Research Article
County Differences in Mortality among Foreign-Born Compared
to Native Swedes 1970–1999
Bj¨orn Albin,
1, 2Katarina Hjelm,
1Jan Ekberg,
3and S¨olve Elmst˚ahl
21School of Health and Caring Sciences, Linnaeus University, 351 95 V¨axj¨o, Sweden
2Centre of Labour Market Policy Research (CAFO), School of Business and Economics, Linnaeus University, 351 95 V¨axj¨o, Sweden 3Department of Health Sciences, Division of Geriatric Medicine, Lund University, 221 00 Lund, Sweden
Correspondence should be addressed to Bj¨orn Albin,bjorn.albin@lnu.se
Received 9 February 2012; Accepted 16 July 2012 Academic Editor: Rosa Benato
Copyright © 2012 Bj¨orn Albin et al. This is an open access article distributed under the Creative Commons Attribution License, which permits unrestricted use, distribution, and reproduction in any medium, provided the original work is properly cited.
Background. Regional variations in mortality and morbidity have been shown in Europe and USA. Longitudinal studies have found
increased mortality, dissimilarities in mortality pattern, and differences in utilization of healthcare between foreign- and native-born Swedes. No study has been found comparing mortality among foreign-native-born and native-native-born Swedes in relation to catchment areas/counties. Methods. The aim was to describe and compare mortality among foreign-born persons and native Swedes during 1970–1999 in 24 counties in Sweden. Data from the Statistics Sweden and the National Board of Health and Welfare was used, and the database consisted of 723,948 persons, 361,974 foreign-born living in Sweden in 1970 and aged 16 years and above and 361,974 matched Swedish controls. Results. Latest county of residence independently explained higher mortality among foreign-born persons in all but four counties; OR varied from 1.01 to 1.29. Counties with a more rural structure showed the highest differences between foreign-born persons and native controls. Foreign-born persons had a lower mean age (1.0–4.3 years) at time of death. Conclusion. County of residence influences mortality; higher mortality is indicated among migrants than native Swedes in counties with a more rural structure. Further studies are needed to explore possible explanations.
1. Introduction
Earlier studies have shown that mortality and morbidity vary in different parts of a country both in European countries and the US [1–4]. To our knowledge no study has compared mortality among foreign-born and native-born Swedes in relation to catchment areas such as counties. Geographical variation in mortality is due to influencing factors, in child-hood and in adultchild-hood, such as social class, employment status and social and physical environment [5], and unequal utilization of healthcare. Districts with high or low mortality could be identified in the UK [1]. Another investigation showed an association between area of residence and stom-ach cancer or stroke [3]. In Italy higher mortality for men was found in the north of the country compared to the south but the reversed pattern was evident for women [2].
Previous longitudinal studies of mortality, morbidity, and heath care utilization among foreign- and native-born Swedes during 1970–1999 have found increased mortality,
dissimilarities in mortality pattern, and differences in utiliza-tion of hospital care [6–8]. The results showed higher mor-tality and a 2.5 to 2.8 years lower mean age at time of death for foreign-born persons compared to the Swedish controls. The mortality pattern showed a significantly higher number of deaths among foreign-born from neoplasm, diseases of the
circulatory system, symptoms, signs, and ill-defined conditions,
and injury and poisoning, according to the International Classification of Diseases, ranging from 1.0% to 5.3% higher prevalence [7]. A tendency towards less healthcare utilization among migrants, especially men, as regards to the diagnosis groups symptoms, signs, and ill-defined conditions and injury
and poisoning has been found [8].
In Sweden, geographical differences in mortality and morbidity of the total population have been described [9,
10]. The average lifetime was found to be longer in the south-ern part of Sweden. Cancer was more frequent in the three largest cities, whereas accident as cause of death was more often found in rural areas. Differences in utilization
Table 1: Excluded and analysed persons related to country of birth, sex, and age.
Excluded male persons Analysed male persons Excluded female persons Analysed female persons
n Mean age 1970 Proportion excluded % n Mean age 1970 n Mean age 1970 Proportion excluded % n Mean age 1970 Swedish 54 729 31.5 24.5 168 702 39.4 36 578 32.2 15.9 193 272 42.0 Denmark 3 285 34.8 17.4 15 627 43.0 2 054 34.4 13.0 13 795 44.1 Finland 27 193 29.3 30.8 60 959 34.8 18 035 29.9 17.9 82 544 37.4 Norway/Iceland 3 654 32.9 21.6 13 236 45.7 2 875 33.4 11.4 22 413 48.0 Yugoslavia 3 518 32.6 23.3 11 598 31.8 2 519 33.1 23.2 8 362 31.1 Poland 462 35.4 9.8 4 253 44.6 354 35.2 6.7 4 925 44.6 Germany 2 613 34.6 15.5 14 291 41.6 2 123 36.4 9.7 19 675 45.0 Other European 10 442 34.2 23.2 34 510 42.0 6 577 34.9 18.9 28 229 46.0 Non-European 3 496 32.4 19.9 14 035 45.0 1 966 33.9 13.1 13 081 51.7 Stateless/unknown 66 30.6 25.5 193 50.2 75 30.7 23.2 248 55.8 Total 109 458 100 337 404 73 156 386 544
of healthcare in different age groups among elderly persons have been studied [11]. The study found fewer days in hospital care and fewer visits to a general practitioner in the oldest age group, 80+, during the last year before death.
Swedish society has changed during the last century due to international migration and foreign-born people living in Sweden constituted 2004 11.5 percent of the total population [12]. The population of foreign-born in Sweden shows a great mixture of different nationalities but is dominated by labour migrants from the Nordic countries, especially Fin-land, and European countries such as the former Yugoslavia, Germany, and Poland [12].
The differences in health found in previous investiga-tions, among foreign-born and native Swedes, could be a general pattern or vary in different parts of Sweden. Whether differences in healthcare services between county coun-cil areas are related to mortality among foreign born is unknown. In accordance with the Swedish Health and Med-ical Services Act, there should be no differences in healthcare services [13]. Earlier findings and the lack of studies in the area of geographical differences in mortality among foreign-born and native population warrant further studies.
The aim of this study was to describe and compare the county distribution of mortality among foreign- and Swedish-born persons during the years 1970–1999. The pattern will be discussed in relation to gender, year of birth, and age at death, testing the null hypothesis that no county differences in mortality exist between foreign-born and native Swedes.
2. Material and Methods
Data from Statistics Sweden (SCB) and the National Board of Health and Welfare Centre for Epidemiology covering the period 1970–1999 was analysed. The study population consisted of all 361,974 foreign-born persons aged 16 years and upward who were registered as living in Sweden in 1970, together with 361,974 matched Swedish controls for each person. The control was matched and was similar
in age (±3 year), sex, occupation, type of employer, and lived in the same county in 1970. Type of employment was divided into three groups (government, municipal, or other employer). Occupation was coded according to the Nordic Occupation Classification System (NYK), and county represented all the 24 county council areas in Sweden. This data relates to the situation on 1 November 1970 and was taken from the National Census of 1970, which was a total census and checked against the National Population Register (RTB), which included data up to 31 December 1999. Each person was given a code if they were deceased, still living in Sweden, had emigrated, or if no information was available. Information from the National Board of Health and Welfare Centre for Epidemiology on date of death and death diagnosis was added to the database. In total 906,564 people were included, 50 percent foreign-born persons.
A Swedish matched control could not be found for 20,518 of the foreign-born persons due to the matching criteria. Exclusion criteria were as follows: if no information was available or if a person had emigrated or migrated back (“remigrated”), thus in total 163,896 persons were excluded from the database. Persons were then also excluded if the information from the control subject was missing due to migration. In total 182,614 persons, 109,458 men and 73,156 women, were excluded from the database; see Table1.
The largest group of excluded foreign- born persons, 45,228 persons, consisted of persons born in Finland. In the original database 44,067 of them were coded as migrated (remigrated) and mortality among 37,904 (86%) of them could be analysed with data from the Population Register Centre in Finland. The analysis showed the same mortality risk among the excluded group as the Finnish-born persons who stayed in Sweden [6].
The database used for analysis finally consisted of 723,948 persons, 361,974 foreign-born and 361, 974 Swedish controls. Latest county of residence was used to distribute the study population in different geographical areas in Sweden. Mobility in Sweden between different counties showed a similar pattern. Among persons still living in 1990, 27.2%
Nursing Research and Practice 3 of foreign-born and 25.5% of Swedes had lived in the same
county during 1970–1990 (P < 0.001) and 81.1% versus 85.52% might have moved during the study period but were living the same county in 1990 as in 1970.
2.1. Characteristics of County Council Areas in Sweden. The
24 counties in Sweden differ with regard to population and area. The population varies from the largest one (Stockholm) with 1,860,872 inhabitants to the smallest (Gotland) with 57,535 inhabitants (SCB, 2004). The four most densely populated counties are, as in 1970, Stockholm, G¨oteborg och Bohus, Malm¨ohus, and ¨Osterg¨otland. Gotland, Blekinge, Kronoberg, and Kalmar represent the less populated and could be considered as more rural counties according to the national classification [14]. The different counties also vary in terms of area, which tends to be larger in the north of Sweden, Norrbotten is the largest, covering an area of 98,249.5 km2. In contrast, the smallest county (Blekinge) has
an area of 2,946.7 km2.
2.2. Statistical Analysis. Values from the total cohort sample
are given as numbers, means, and percentages. Comparisons were made by tests of significance with Mann-Whitney U test and Chi-square test. A value ofP < 0.05 was considered statistically significant [15]. Logistic regression analysis was performed and a model tested, adjusted for age and sex, with the two independent variables foreign-born and latest county of residence (categorical) and the dependent variable dead or alive. Uppsala County, with the lowest mortality, was used as reference.
Cox regression analysis was performed in two age groups: persons aged 60–69 years and 80 years or more. The analysis was adjusted for sex and age and tested the importance of being foreign born and latest county of residence (categori-cal). Uppsala was also in this analysis used as reference.
All analyses were performed using SPSS (Statistical Package for Social Sciences), version 11.5.
2.3. Ethics. Approval of the study was granted from the
Ethics Committee of Lund University, Sweden, after a review-ing process from all other university ethics committees in Sweden.
3. Results
3.1. Characteristics of Counties and Differences in Mortality in relation to being a Foreign-Born Person. The study
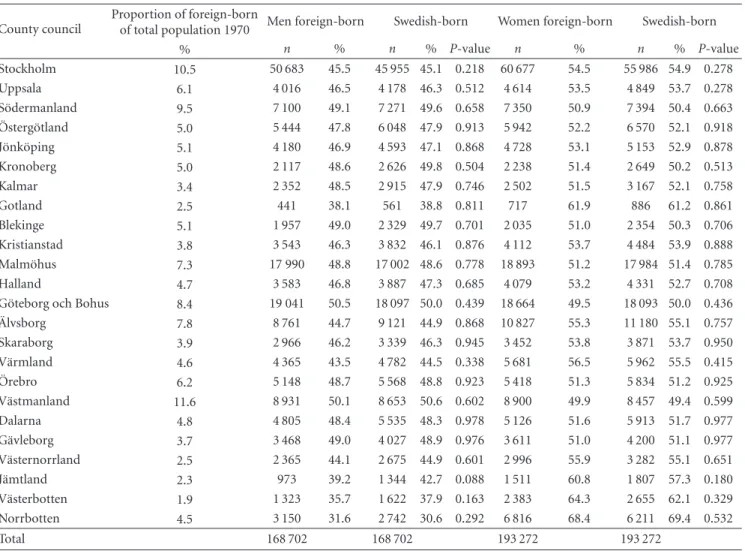
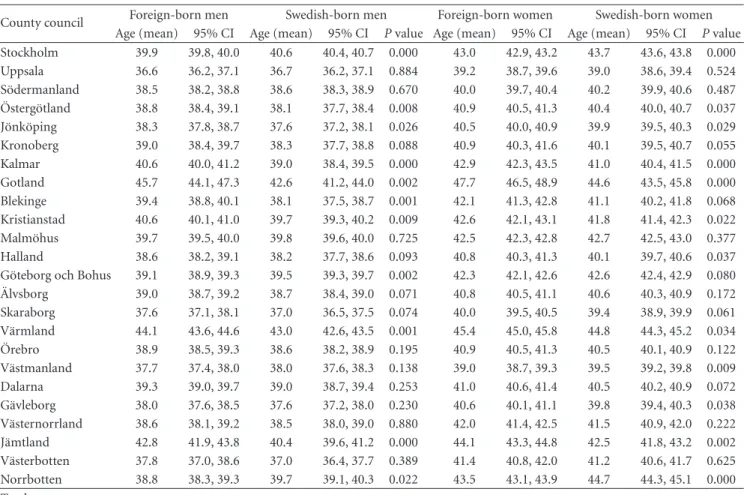
popula-tion was geographically distributed among the 24 different county council areas that made up the regional organization of Sweden in 1970. The major groups of foreign-born persons were found in the counties of Stockholm, G¨oteborg och Bohus, and Malm¨ohus; see Table2. There were no sig-nificant differences between foreign- and Swedish-born persons in the different counties in relation to sex. In four counties (Stockholm, G¨oteborg & Bohus, V¨astmanland, and Norrbotten), foreign-born persons had a significantly lower mean age than Swedish-born persons. The mean age was
significantly higher among foreign-born men than Swedish-born men in eight and significantly lower in three counties. Foreign-born women had a higher mean age in nine and a lower mean age in three compared to Swedish-born women (Table3).
During the studied period 1970–1999, a total of 116,063 foreign-born and 104,865 Swedish control persons had died. There was significant higher mortality for foreign-born persons than native Swedes in all counties with one exception, Norrbotten. The highest percentage of deceased among foreign-born persons was found in Gotland (43%), V¨armland (40.0%), and J¨amtland (37.4%). The largest difference in deceased subjects, with higher mortality among foreign-born than Swedish-born persons, was found in the rural counties of Gotland (7.6%), Blekinge (7.1%), Kalmar (5.9%), and Kronoberg (5.7%).
3.2. Influence of Gender on Mortality. There was significant
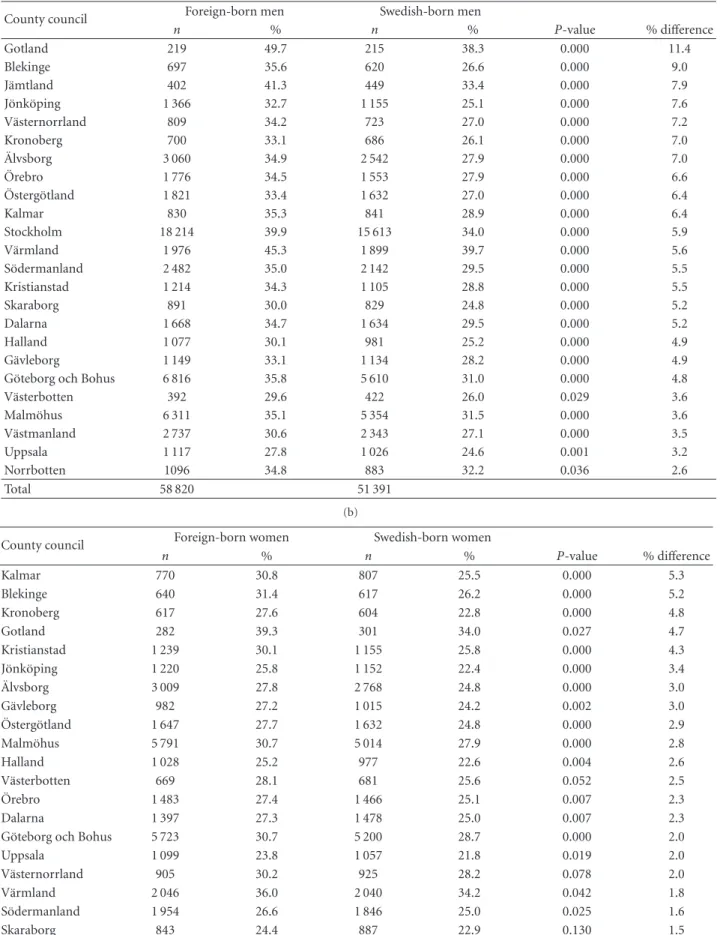
higher mortality in all counties for men and in 19 of the 24 counties for women (Tables4(a) and4(b)). The highest proportion of deceased foreign-born men was found in Gotland (49.7%), V¨armland (45.3%), and J¨amtland (41.3%), see Table4(a). The largest difference in percentage between
deceased foreign- and Swedish-born male persons was in Gotland (11.4%), Blekinge (9.0%), J¨amtland (7.9%), and J¨onk¨oping (7.6%). Foreign-born women had the highest percentage of deceased in Gotland (39.3%), V¨armland (36.0%), and Norrbotten (32.8%). The difference in per-centage between foreign- and Swedish-born deceased female persons was largest in the rural counties of Kalmar (5.3%), Blekinge (5.2%), Kronoberg (4.8%), and Gotland (4.7%); see Table4(b).
3.3. Influence of Age on Mortality. Mean age at time of
death was significantly lower for foreign- than Swedish-born men in all counties, ranging from 1.0 to 4.4 years, except for Kalmar and Gotland (Table 5). For women significant differences in mean age at time of death were found in 19 counties. There was a larger difference in mean age at time of death between foreign- and Swedish-born men than between foreign- and Swedish-born women in all counties. Differ-ences in survival time between foreign- and Swedish-born persons were studied in particular in two age groups of older persons, those aged 60–69 and 80+, using Cox regression analysis. In the age group 60–69 years, foreign-born persons had a significantly lower survival time in two counties, Norrbotten and V¨armland. No difference was found in any of the other counties. In the age group 80+ no significant differences were found.
3.4. Multifactorial Influence on Mortality. Logistic regression
analysis studying the influence of being foreign-born and latest county of residence on mortality showed that being foreign-born was, adjusted for age and sex, an independent influencing factor (P = 0.000, B = 0.242), as was county, except in four county council areas (Kronoberg, Kalmar, Kristianstad, Halland and Skaraborg) and the OR varied from 1.01 to 1.29; see Table6.
Table 2: Population in relation to sex and latest County Council of residence. County council
Proportion of foreign-born
of total population 1970 Men foreign-born Swedish-born Women foreign-born Swedish-born % n % n % P-value n % n % P-value Stockholm 10.5 50 683 45.5 45 955 45.1 0.218 60 677 54.5 55 986 54.9 0.278 Uppsala 6.1 4 016 46.5 4 178 46.3 0.512 4 614 53.5 4 849 53.7 0.278 S¨odermanland 9.5 7 100 49.1 7 271 49.6 0.658 7 350 50.9 7 394 50.4 0.663 ¨ Osterg¨otland 5.0 5 444 47.8 6 048 47.9 0.913 5 942 52.2 6 570 52.1 0.918 J¨onk¨oping 5.1 4 180 46.9 4 593 47.1 0.868 4 728 53.1 5 153 52.9 0.878 Kronoberg 5.0 2 117 48.6 2 626 49.8 0.504 2 238 51.4 2 649 50.2 0.513 Kalmar 3.4 2 352 48.5 2 915 47.9 0.746 2 502 51.5 3 167 52.1 0.758 Gotland 2.5 441 38.1 561 38.8 0.811 717 61.9 886 61.2 0.861 Blekinge 5.1 1 957 49.0 2 329 49.7 0.701 2 035 51.0 2 354 50.3 0.706 Kristianstad 3.8 3 543 46.3 3 832 46.1 0.876 4 112 53.7 4 484 53.9 0.888 Malm¨ohus 7.3 17 990 48.8 17 002 48.6 0.778 18 893 51.2 17 984 51.4 0.785 Halland 4.7 3 583 46.8 3 887 47.3 0.685 4 079 53.2 4 331 52.7 0.708 G¨oteborg och Bohus 8.4 19 041 50.5 18 097 50.0 0.439 18 664 49.5 18 093 50.0 0.436
¨ Alvsborg 7.8 8 761 44.7 9 121 44.9 0.868 10 827 55.3 11 180 55.1 0.757 Skaraborg 3.9 2 966 46.2 3 339 46.3 0.945 3 452 53.8 3 871 53.7 0.950 V¨armland 4.6 4 365 43.5 4 782 44.5 0.338 5 681 56.5 5 962 55.5 0.415 ¨ Orebro 6.2 5 148 48.7 5 568 48.8 0.923 5 418 51.3 5 834 51.2 0.925 V¨astmanland 11.6 8 931 50.1 8 653 50.6 0.602 8 900 49.9 8 457 49.4 0.599 Dalarna 4.8 4 805 48.4 5 535 48.3 0.978 5 126 51.6 5 913 51.7 0.977 G¨avleborg 3.7 3 468 49.0 4 027 48.9 0.976 3 611 51.0 4 200 51.1 0.977 V¨asternorrland 2.5 2 365 44.1 2 675 44.9 0.601 2 996 55.9 3 282 55.1 0.651 J¨amtland 2.3 973 39.2 1 344 42.7 0.088 1 511 60.8 1 807 57.3 0.180 V¨asterbotten 1.9 1 323 35.7 1 622 37.9 0.163 2 383 64.3 2 655 62.1 0.329 Norrbotten 4.5 3 150 31.6 2 742 30.6 0.292 6 816 68.4 6 211 69.4 0.532 Total 168 702 168 702 193 272 193 272
4. Discussion
The major findings in this study were that latest county of residence was an independent factor influencing mortality and that a variation with significantly higher mortality was found in all but one Swedish county among foreign-born persons compared with native Swedes. The highest difference compared to native controls of deceased foreign-born was found in counties with a more rural structure. Several factors might explain the noted differences, such as the size of the foreign-born population, differences in the healthcare system’s ability to deliver healthcare, social network, stress, and economic resources.
5. Strengths and Limitations
The study of regional differences in mortality among foreign-born and native Swedes 1970–1999 was based on data from Statistics Sweden and from the National Board of Health and Welfare Centre for Epidemiology.
The data used to establish the database originated from the Population and Housing Census of 1970, which is considered to be a total census as it was compulsory by
law to take part. The number of dropouts has not been estimated for the total census, only for some of the variables such as “occupation”, which Statistics Sweden estimates to be 3.5–4.5%. One can only speculate about whether participation in the census is related to health problems and whether dropout might differ between foreign-born and native healthy Swedes. It seems unlikely that the proportion of healthy foreign-born should be higher than native Swedes and thereby introduce selection bias. Another reason why migrants do not participate in the census could be language problems.
A Swedish matched control could not be found for 20,518 of the foreign-born persons due to the matching criteria. The geographical distribution of the excluded persons was not different from the distribution in the database used.
The excluded group varies in proportion with regard to country/region of birth. Excluded persons from Finland constitute the largest proportion (30.8%). A followup of Finns who had remigrated was performed and showed no differences in mortality from the group of Finns included in the study [6]. Persons born in Finland constitute the largest group of migrants living in Sweden and were also the largest migrant group in the database used. There are no reasons to
Nursing Research and Practice 5
Table 3: Population in relation to age (1970) and latest county council of residence.
County council Foreign-born men Swedish-born men Foreign-born women Swedish-born women Age (mean) 95% CI Age (mean) 95% CI P value Age (mean) 95% CI Age (mean) 95% CI P value
Stockholm 39.9 39.8, 40.0 40.6 40.4, 40.7 0.000 43.0 42.9, 43.2 43.7 43.6, 43.8 0.000 Uppsala 36.6 36.2, 37.1 36.7 36.2, 37.1 0.884 39.2 38.7, 39.6 39.0 38.6, 39.4 0.524 S¨odermanland 38.5 38.2, 38.8 38.6 38.3, 38.9 0.670 40.0 39.7, 40.4 40.2 39.9, 40.6 0.487 ¨ Osterg¨otland 38.8 38.4, 39.1 38.1 37.7, 38.4 0.008 40.9 40.5, 41.3 40.4 40.0, 40.7 0.037 J¨onk¨oping 38.3 37.8, 38.7 37.6 37.2, 38.1 0.026 40.5 40.0, 40.9 39.9 39.5, 40.3 0.029 Kronoberg 39.0 38.4, 39.7 38.3 37.7, 38.8 0.088 40.9 40.3, 41.6 40.1 39.5, 40.7 0.055 Kalmar 40.6 40.0, 41.2 39.0 38.4, 39.5 0.000 42.9 42.3, 43.5 41.0 40.4, 41.5 0.000 Gotland 45.7 44.1, 47.3 42.6 41.2, 44.0 0.002 47.7 46.5, 48.9 44.6 43.5, 45.8 0.000 Blekinge 39.4 38.8, 40.1 38.1 37.5, 38.7 0.001 42.1 41.3, 42.8 41.1 40.2, 41.8 0.068 Kristianstad 40.6 40.1, 41.0 39.7 39.3, 40.2 0.009 42.6 42.1, 43.1 41.8 41.4, 42.3 0.022 Malm¨ohus 39.7 39.5, 40.0 39.8 39.6, 40.0 0.725 42.5 42.3, 42.8 42.7 42.5, 43.0 0.377 Halland 38.6 38.2, 39.1 38.2 37.7, 38.6 0.093 40.8 40.3, 41.3 40.1 39.7, 40.6 0.037 G¨oteborg och Bohus 39.1 38.9, 39.3 39.5 39.3, 39.7 0.002 42.3 42.1, 42.6 42.6 42.4, 42.9 0.080
¨ Alvsborg 39.0 38.7, 39.2 38.7 38.4, 39.0 0.071 40.8 40.5, 41.1 40.6 40.3, 40.9 0.172 Skaraborg 37.6 37.1, 38.1 37.0 36.5, 37.5 0.074 40.0 39.5, 40.5 39.4 38.9, 39.9 0.061 V¨armland 44.1 43.6, 44.6 43.0 42.6, 43.5 0.001 45.4 45.0, 45.8 44.8 44.3, 45.2 0.034 ¨ Orebro 38.9 38.5, 39.3 38.6 38.2, 38.9 0.195 40.9 40.5, 41.3 40.5 40.1, 40.9 0.122 V¨astmanland 37.7 37.4, 38.0 38.0 37.6, 38.3 0.138 39.0 38.7, 39.3 39.5 39.2, 39.8 0.009 Dalarna 39.3 39.0, 39.7 39.0 38.7, 39.4 0.253 41.0 40.6, 41.4 40.5 40.2, 40.9 0.072 G¨avleborg 38.0 37.6, 38.5 37.6 37.2, 38.0 0.230 40.6 40.1, 41.1 39.8 39.4, 40.3 0.038 V¨asternorrland 38.6 38.1, 39.2 38.5 38.0, 39.0 0.880 42.0 41.4, 42.5 41.5 40.9, 42.0 0.222 J¨amtland 42.8 41.9, 43.8 40.4 39.6, 41.2 0.000 44.1 43.3, 44.8 42.5 41.8, 43.2 0.002 V¨asterbotten 37.8 37.0, 38.6 37.0 36.4, 37.7 0.389 41.4 40.8, 42.0 41.2 40.6, 41.7 0.625 Norrbotten 38.8 38.3, 39.3 39.7 39.1, 40.3 0.022 43.5 43.1, 43.9 44.7 44.3, 45.1 0.000 Total
believe that “remigrants” born in other countries differ from the Finnish group.
Selection bias has to be considered. The excluded persons had a lower mean age than the persons in the database, with the exception of persons born in the former Yugoslavia, but their Swedish control person of the same age was also excluded. Only 8.1% of the excluded persons had reached the age of 60–69 and 2.6% the age of 80+. There is no reason to assume that the excluded persons influenced the survival analysis using these two age groups, due to the low proportion of excluded persons above 60 years of age.
Latest county of residence has been used as a variable. Migration within Sweden might have occurred and labour migration by healthier persons to urban areas could explain the higher mortality in rural counties. However, the pattern of internal migration within Sweden showed similarities between born and native Swedes. Among foreign-born persons still living in Sweden 1990, 53.9% had changed county of residence during 1979–1999 but moved back to the same county 1990 as the one they lived in 1970, corresponding proportion for native Swedes was 60%.
6. Results
The rural counties had in common that the proportion of foreign-born persons in their populations was low compared
to the more urban counties. For some ethnic groups higher density in an area of persons from the same ethnic group has been shown to have a positive effect on self-rated health, limiting long-standing illness [16], and reduce odds of infants mortality [17]. Belonging to a small migrant group may be a risk factor; earlier studies have shown higher hospital rates for mental health problems in areas where migrants constitute a small proportion of the community [18]. The result has been interpreted as showing that if you belong to a larger migrant group it is likely that the stress connected with being a migrant could be reduced due to stronger social network [18]. Stress is also known to increase the susceptibility to other diseases such as diabetes and hypertension [19,20]. Furthermore, the ability of the healthcare systems, both hospitals and outpatient facilities, to handle and to investigate symptoms and signs among migrants is most likely to be poorer in counties with few migrants. It could be hypothesized that delay or misunderstanding in diagnosis and treatment and healthcare staff with insufficient “language skills” and understanding of cultural differences could influence mortality. In a previous study it was shown that symptoms, signs, and ill-defined condition were more common as cause of death among foreign-born compared to native Swedish persons [7].
Another explanatory factor could be differences in social networks in different geographical areas [21]. Poor social
Table 4: (a) Deceased men in relation to latest county council of residence, (b) Deceased women in relation to latest to county council of residence.
(a)
County council Foreign-born men Swedish-born men
n % n % P-value % difference Gotland 219 49.7 215 38.3 0.000 11.4 Blekinge 697 35.6 620 26.6 0.000 9.0 J¨amtland 402 41.3 449 33.4 0.000 7.9 J¨onk¨oping 1 366 32.7 1 155 25.1 0.000 7.6 V¨asternorrland 809 34.2 723 27.0 0.000 7.2 Kronoberg 700 33.1 686 26.1 0.000 7.0 ¨ Alvsborg 3 060 34.9 2 542 27.9 0.000 7.0 ¨ Orebro 1 776 34.5 1 553 27.9 0.000 6.6 ¨ Osterg¨otland 1 821 33.4 1 632 27.0 0.000 6.4 Kalmar 830 35.3 841 28.9 0.000 6.4 Stockholm 18 214 39.9 15 613 34.0 0.000 5.9 V¨armland 1 976 45.3 1 899 39.7 0.000 5.6 S¨odermanland 2 482 35.0 2 142 29.5 0.000 5.5 Kristianstad 1 214 34.3 1 105 28.8 0.000 5.5 Skaraborg 891 30.0 829 24.8 0.000 5.2 Dalarna 1 668 34.7 1 634 29.5 0.000 5.2 Halland 1 077 30.1 981 25.2 0.000 4.9 G¨avleborg 1 149 33.1 1 134 28.2 0.000 4.9 G¨oteborg och Bohus 6 816 35.8 5 610 31.0 0.000 4.8 V¨asterbotten 392 29.6 422 26.0 0.029 3.6 Malm¨ohus 6 311 35.1 5 354 31.5 0.000 3.6 V¨astmanland 2 737 30.6 2 343 27.1 0.000 3.5 Uppsala 1 117 27.8 1 026 24.6 0.001 3.2 Norrbotten 1096 34.8 883 32.2 0.036 2.6 Total 58 820 51 391 (b)
County council Foreign-born women Swedish-born women
n % n % P-value % difference Kalmar 770 30.8 807 25.5 0.000 5.3 Blekinge 640 31.4 617 26.2 0.000 5.2 Kronoberg 617 27.6 604 22.8 0.000 4.8 Gotland 282 39.3 301 34.0 0.027 4.7 Kristianstad 1 239 30.1 1 155 25.8 0.000 4.3 J¨onk¨oping 1 220 25.8 1 152 22.4 0.000 3.4 ¨ Alvsborg 3 009 27.8 2 768 24.8 0.000 3.0 G¨avleborg 982 27.2 1 015 24.2 0.002 3.0 ¨ Osterg¨otland 1 647 27.7 1 632 24.8 0.000 2.9 Malm¨ohus 5 791 30.7 5 014 27.9 0.000 2.8 Halland 1 028 25.2 977 22.6 0.004 2.6 V¨asterbotten 669 28.1 681 25.6 0.052 2.5 ¨ Orebro 1 483 27.4 1 466 25.1 0.007 2.3 Dalarna 1 397 27.3 1 478 25.0 0.007 2.3 G¨oteborg och Bohus 5 723 30.7 5 200 28.7 0.000 2.0 Uppsala 1 099 23.8 1 057 21.8 0.019 2.0 V¨asternorrland 905 30.2 925 28.2 0.078 2.0 V¨armland 2 046 36.0 2 040 34.2 0.042 1.8 S¨odermanland 1 954 26.6 1 846 25.0 0.025 1.6 Skaraborg 843 24.4 887 22.9 0.130 1.5
Nursing Research and Practice 7
(b) Continued.
County council Foreign-born women Swedish-born women
n % n % P-value % difference Norrbotten 2 235 32.8 2 090 33.6 0.298 0.8 Stockholm 19 140 31.5 17 289 30.9 0.015 0.6 V¨astmanland 2 065 23.2 1 927 22.8 0.515 0.4 J¨amtland 459 30.4 546 30.2 0.920 0.2 Total 57 243 53 474
Table 5: Deceased in relation to age at time of death and latest county council of residence.
County council Foreign-born men Swedish-born men Foreign-born women Swedish-born women Age (mean) 95% CI Age (mean) 95% CI P-value Age (mean) 95% CI Age (mean) 95% CI P-value
Stockholm 67.5 67.3, 67.7 70.6 70.4, 70.8 0.000 75.0 74.8, 75.2 76.9 76.7, 77.1 0.000 Uppsala 66.0 65.1, 66.8 69.1 68.2, 70.0 0.000 73.7 72.9, 74.5 75.2 74.4, 76.0 0.004 S¨odermanland 65.7 65.2, 66.3 70.1 69.5, 70.6 0.000 72.6 72.0, 73.2 74.8 74.2, 75.4 0.000 ¨ Osterg¨otland 66.2 65.5, 66.9 70.5 69.9, 71.1 0.000 73.5 72.8, 74.2 75.1 74.4, 75.7 0.002 J¨onk¨oping 66.3 65.6, 67.1 70.2 69.5, 71.0 0.000 72.9 72.1, 73.7 74.2 73.4, 75.0 0.013 Kronoberg 68.5 67.4, 69.5 71.5 70.6, 72.5 0.000 73.3 72.1, 74.4 75.5 74.5, 76.5 0.008 Kalmar 68.7 67.7, 69.7 70.4 69.6, 71.3 0.060 75.5 74.6, 76.4 75.8 75.0, 76.7 0.626 Gotland 72.4 70.7, 74.1 73.6 71.9, 75.2 0.310 78.0 76.6, 79.3 77.9 76.6, 79.3 0.979 Blekinge 67.9 66.9, 68.9 71.3 70.3, 72.3 0.000 74.4 73.3, 75.5 76.6 75.7, 77.6 0.005 Kristianstad 69.7 68.9, 70.4 72.2 71.5, 72.9 0.000 74.9 74.2, 75.7 76.8 76.1, 77.5 0.001 Malm¨ohus 67.9 67.5, 68.2 70.6 70.3, 70.9 0.000 74.4 74.1, 74.8 76.7 76.4, 77.1 0.000 Halland 67.8 67.1, 68.6 70.7 69.9, 71.6 0.000 74.4 73.5, 75.2 76.3 75.5, 77.1 0.001 G¨oteborg och Bohus 65.9 65.5, 66.2 69.7 69.3, 70.0 0.000 73.9 73.6, 74.3 76.0 75.7, 76.3 0.000
¨ Alvsborg 67.1 66.6, 67.7 71.3 70.8, 71.8 0.000 73.9 73.5, 74.4 76.1 75.6, 76.6 0.000 Skaraborg 67.0 66.0, 67.9 70.5 69.7, 71.4 0.000 73.4 72.4, 74.3 74.6 73.8, 75.4 0.105 V¨armland 70.3 69.8, 70.9 72.7 72.2, 73.2 0.000 75.5 75.0, 76.1 76.8 76.3, 77.3 0.001 ¨ Orebro 66.6 65.9, 67.2 70.2 69.5, 70.8 0.000 72.3 71.7, 73.0 74.0 73.4, 74.7 0.000 V¨astmanland 65.7 65.2, 66.2 69.5 69.0, 70.0 0.000 71.8 71.2, 72.3 73.0 72.4, 73.6 0.002 Dalarna 66.6 65.9, 67.2 70.8 70.2, 71.4 0.000 72.5 71.8, 73.2 74.2 73.5, 74.8 0.001 G¨avleborg 64.8 64.0, 65.6 68.6 67.9, 69.3 0.000 72.6 71.7, 73.4 74.5 73.7, 75.2 0.005 V¨asternorrland 66.4 65.5, 67.3 70.4 69.5, 71.3 0.000 73.7 72.8, 74.5 74.2 73.4, 75.1 0.340 J¨amtland 70.3 69.0, 71.6 71.3 70.1, 72.4 0.000 75.3 74.2, 76.5 74.8 73.8, 75.8 0.558 V¨asterbotten 67.7 66.3, 69.1 70.0 68.8, 71.2 0.003 72.4 71.4, 73.4 74.4 73.5, 75.3 0.008 Norrbotten 67.1 66.3, 67.9 70.8 70.0, 71.6 0.000 74.7 74.2, 75.2 76.0 75.5, 76.5 0.000
network and low social support are more common among foreign-born persons [22] and have been shown to influence and increase mortality [23].
Generally no significantly higher mortality among migrants was found in Norrbotten, but mortality was higher for men when men and women were analysed separately.
This county has close cultural contacts with Finland [24] and many inhabitants are bilingual. A short cultural distance between migrants and native population has been described as important for health [25].
The differences in mortality in all Swedish counties, with one exception, among foreign-born persons compared with native Swedes could indicate differences in economic resources and needs in the population. One measure of economic resources in the county was the local tax rate. In the middle of the studied period (1985), local tax per unit differed from 28.46% (Kristianstad) to 32.00% in Blekinge of
taxable income [26], although the taxation differences were
also equalized by a national taxation transfer system [27]. Whether differences in economic resources between counties might influence the noted mortality differences in relation to foreign-born persons requires further analysis.
More healthcare needs are connected with an elderly population [10] and in 1985 the share of the population aged 80 years or more in the counties varied from 2.7% to 4.2% [27]. The lowest percentage for this age group was found in Norrbotten. The counties of Gotland and Blekinge, with the largest proportion of deceased foreign-born persons, were also characterized in 1985 by a low percentage of foreign-born persons (2.3% and 5.1%) and average or higher than average percentage of the population 80 aged years or more (3.8% and 3.9%).
There are a strong connection between increased mor-tality and increased age [9,10,12]. A higher mean age in
Table 6: Multifactorial influence of being foreign-born on mortality adjusted for age and gender with latest county council of residence as independent categorical variable using Uppsala county council as reference.
County council B-value SE P-value OR 95% CI for Exp.B Stockholm 0.180 0.023 0.000 1.197 1.144, 1.253 S¨odermanland 0.197 0.028 0.000 1.218 1.154, 1.286 ¨ Osterg¨otland 0.116 0.029 0.000 1.123 1.061, 1.189 J¨onk¨oping 0.063 0.031 0.041 1.065 1.003, 1.131 Kronoberg 0.013 0.037 0.736 1.013 0.941, 1.089 Kalmar 0.062 0.035 0.079 1.064 0.993, 1.140 Gotland 0.194 0.059 0.001 1.214 1.081, 1.362 Blekinge 0.113 0.038 0.003 1.119 1.038, 1.206 Kristianstad 0.022 0.032 0.482 1.023 0.961, 1.089 Malm¨ohus 0.157 0.025 0.000 1.170 1.115, 1.228 Halland −0.053 0.032 0.099 0.948 0.890, 1.010 G¨oteborg och Bohus 0.210 0.025 0.000 1.233 1.175, 1.294
¨ Alvsborg 0.106 0.027 0.000 1.112 1.055, 1.172 Skaraborg 0.047 0.034 0.159 1.049 0.982, 1.120 V¨armland 0.255 0.029 0.000 1.291 1.218, 1.367 ¨ Orebro 0.158 0.029 0.000 1.171 1.106, 1.240 V¨astmanland 0.087 0.027 0.001 1.091 1.035, 1.151 Dalarna 0.157 0.029 0.000 1.170 1.105, 1.239 G¨avleborg 0.215 0.032 0.000 1.240 1.165, 1.319 V¨asternorrland 0.186 0.034 0.000 1.204 1.125, 1.288 J¨amtland 0.194 0.043 0.000 1.214 1.116, 1.321 V¨asterbotten 0.126 0.039 0.001 1.134 1.051, 1.224 Norrbotten 0.230 0.030 0.000 1.259 1.187, 1.336
the foreign-born population could also explain the larger proportion of deceased foreign-born women in two counties (Kalmar and Gotland) but was not found in the counties of Kronoberg and Blekinge. Furthermore, the variation in mortality between counties with higher mortality among foreign-born remained after adjustment for age and gender.
Other explanatory factors could be work environment and type of employment. Foreign-born men have to a higher degree been employed in private manufacturing industry, which is often found in rural counties like Kronoberg, Kalmar, and Blekinge [28]. Foreign-born women in Sweden could to a higher extent be exposed to shift work and physical and stressful work [29,30].
In most counties and especially for men, the mean age at time of death is lower among foreign-born persons than native Swedes. The mean age at time of death of foreign-born men in the two counties Norrbotten and V¨armland with highest OR was 2.4 to 3.7 years lower than native Swedes and correspondingly 1.3 to 1.8 years lower for women. Cox regression analysis also confirms a lower survival time for foreign-born persons in the counties of Norrbotten and V¨armland for the age group 60–69.
7. Conclusion
In conclusion, county of residence influences mortality, and the study indicates a tendency to higher mortality among
foreign-born persons than native Swedes in counties with a more rural structure. Further studies are needed to explore possible explanations and to establish the county-specific characteristics to explain variations between county council areas.
Acknowledgments
This work was supported by grants from the research profile AMERY (labour market, migration, and ethnic relations) V¨axj¨o University, Sweden, the KIP Pension & Forsaking (The Pension Insurance Institute of the Co-operative Societies), Sweden, and R˚adet f¨or H¨alos-och sjukv˚ardsforskning i s¨odra Sverige HSF (the Council for Health and HealthCare Research in Southern Sweden).
References
[1] N. Brimblecombe, D. Dorling, and M. Shaw, “Migration and geographical inequalities in health in Britain,” Social Science &
Medicine, vol. 50, no. 6, pp. 861–878, 2000.
[2] G. Caselli, L. Cerbara, F. Heins, and R. M. Lipsi, “What impact do contextual variables have on the changing geography of mortality in Italy?” European Journal of Population, vol. 19, no. 4, pp. 339–373, 2003.
[3] R. Maheswaran, D. P. Strachan, B. Dodgeon, and N. G. Best, “A population-based case-control study for examining early life influences on geographical variation in adult mortality
Nursing Research and Practice 9
in England and Wales using stomach cancer and stroke as examples,” International Journal of Epidemiology, vol. 31, no. 2, pp. 375–382, 2002.
[4] T. H. Limtanakool, “Unequal treatment linked to thousands of minority deaths,” The Nation’s Health, vol. 4, p. 6, 2005. [5] R. Mitchell, D. Dorling, and M. Shaw, “Population
produc-tion and modelling mortality—an applicaproduc-tion of geographic information systems in health inequalities research,” Health &
Place, vol. 8, no. 1, pp. 15–24, 2002.
[6] B. Albin, K. Hjelm, J. Ekberg, and S. Elmst˚ahl, “Mortality among 723 948 foreign- and native-born Swedes 1970–1999,”
European Journal of Public Health, vol. 15, no. 5, pp. 511–517,
2005a.
[7] B. Albin, K. Hjelm, J. Ekberg, and S. Elmst˚ahl, “Higher mor-tality and different pattern of causes of death among foreign-born compared to native Swedes 1970–1999,” Journal of
Immi-grant and Minority Health, vol. 8, no. 2, pp. 101–113, 2006.
[8] B. Albin, K. Hjelm, J. Ekberg, and S. Elmst˚ahl, “Utilization of health care among foreign-born compared to native Swedes 1987–1999,” . In press.
[9] National Board of Health and Welfare, “Causes of Death 2001,” (D¨odsorsaker 2001),http://www.socialstyrelsen.se/Lists/ Artikelkatalog/Attachments/10829/2003-42-5 2003425.pdf. [10] National Board of Health and Welfare, Sweden’s Public Health
Report 2005, National Board of Health and Welfare,
Stock-holm, Sweden, 2005.
[11] S. Elmst˚ahl, “Sjukv˚ard p˚a lika villkor? (Health care on equal terms?),” in Malm¨o: Geriatriskt Utvecklingscentrum
Univer-sitetssjukhuset MAS, pp. 1–38, Media-Tryck, 2005.
[12] SCB, Statistisk ˚arsbok f¨or Sverige 2004 (Statistical Yearbook for
Sweden 2004), Statistiska centralbyr˚an, Stockholm, Sweden,
2003.
[13] SFS 1982:763, The Swedish Health and Medical Service Act
1982:763, Ministry of Health and Social Affairs, Stockholm,
Sweden, 1982, http://www.notisum.se/rnp/sls/lag/19820763 .htm.
[14] Swedish Association of Local Authorities and regions (SALAR), “Classification of municipalities,” 2005,http://www .scb.se/Grupp/Hitta statistik/Regional%20statistik/Kartor/ Dokument/SKL kommungrp.pdf.
[15] D. Altman, Practical Statistics for Medical Research, Chapman & Hall, London, UK, 1991.
[16] K. E. Pickett, R. J. Shaw, K. Atkin, K. E. Kiernan, and R. G. Wilkinson, “Ethnic density effects on maternal and infant health in the Millennium Cohort Study,” Social Science &
Medicine, vol. 69, no. 10, pp. 1476–1483, 2009.
[17] R. J. Shaw, K. E. Pickett, and R. G. Wilkinson, “Ethnic density effects on birth outcomes and maternal smoking during pregnancy in the US linked birth and infant death data set,”
American Journal of Public Health, vol. 100, no. 4, pp. 707–713,
2010.
[18] D. Hull, “Migration, adaptation, and illness: a review,” Social
Science & Medicine, vol. 13, no. 1, pp. 25–36, 1979.
[19] E. E. Agardh, A. Ahlbom, T. Andersson et al., “Work stress and low sense of coherence is associated with type 2 diabetes in middle-aged Swedish women,” Diabetes Care, vol. 26, no. 3, pp. 719–724, 2003.
[20] P. Bj¨orntorp, “Do stress reactions cause abdominal obesity and comorbidities?” Obesity Reviews, vol. 2, no. 2, pp. 73–86, 2001. [21] H. Mollenkopf and R. Kaspar, “Ageing in rural areas of East and West Germany: increasing similarities and remaining differences,” European Journal of Ageing, vol. 2, no. 2, pp. 120– 130, 2005.
[22] J. Sundquist, E. Iglesias, and ˚A. Isacsson, “Migration and health. A study of Latin American refugees, their exile in Swe-den and repatriation,” Scandinavian Journal of Primary Health
Care, vol. 13, no. 2, pp. 135–140, 1995.
[23] B. S. Hanson, S. O. Isacsson, L. Janzon, and S. E. Lindell, “Social network and social support influence mortality in elderly men. The prospective population study of “men born in 1914”, Malmo, Sweden,” American Journal of Epidemiology, vol. 130, no. 1, pp. 100–111, 1989.
[24] I. Svanberg and M. Tyd´en, Tusen ˚ar av invandring (A Thousand
Years of Immigration), Dialogos, Stockholm, Sweden, 2005.
[25] K. Hjelm, J. Apelqvist, P. Nyberg, J. Sundquist, and A. Isacsson, “Health, health care utilization and living conditions in foreign-born diabetic patients in southern Sweden,” Journal of
Internal Medicine, vol. 242, no. 2, pp. 131–141, 1997.
[26] SCB, Statistisk ˚arsbok f¨or Sverige 1986 (Statistical Yearbook for
Sweden 1986), Statistiska centralbyr˚an, Stockholm, Sweden,
1985.
[27] SOU 1998:51, Kostnadsutj¨amning f¨or kommuner och landsting
(Equalizations of Costs for Local Authorities and County Coun-cils. Government Report), Norstedts Tryckeri, Stockholm,
Swe-den, 1998.
[28] SOU 2004:21, Egenf¨ors¨orjning eller bidragsf¨ors¨orjning (Living
off Your Work or on Allowance. Government report), Fritzes
Offentliga Publikationer, Stockholm, Sweden, 2004.
[29] J. Ekberg, “Economic progress of immigrants in Sweden from 1970 to 1990: a longitudinal study,” Scandinavian Journal of
Social Welfare, vol. 3, no. 3, pp. 148–115, 1994.
[30] R. Rosmond, L. Lapidus, and P. Bj¨orntorp, “A comparative review of psychosocial and occupational environment in native Swedes and immigrants,” Scandinavian Journal of Public
Submit your manuscripts at
http://www.hindawi.com
Endocrinology
International Journal ofHindawi Publishing Corporation
http://www.hindawi.com Volume 2014
Hindawi Publishing Corporation
http://www.hindawi.com Volume 2014
Research and Practice
Breast Cancer
International Journal of Hindawi Publishing Corporationhttp://www.hindawi.com Volume 2014
Hematology
Advances inHindawi Publishing Corporation
http://www.hindawi.com Volume 2014
Scientifica
Hindawi Publishing Corporationhttp://www.hindawi.com Volume 2014
Pediatrics
International Journal ofHindawi Publishing Corporation
http://www.hindawi.com Volume 2014
Hindawi Publishing Corporation
http://www.hindawi.com Volume 2014
Advances in
Urology
Hepatology
International Journal ofHindawi Publishing Corporation
http://www.hindawi.com Volume 2014
Inflammation
International Journal ofHindawi Publishing Corporation
http://www.hindawi.com Volume 2014
World Journal
Hindawi Publishing Corporationhttp://www.hindawi.com Volume 2014
Hindawi Publishing Corporation
http://www.hindawi.com Volume 2014 Computational and Mathematical Methods in Medicine
Hindawi Publishing Corporation
http://www.hindawi.com Volume 2014
BioMed
Research International
Hindawi Publishing Corporation
http://www.hindawi.com Volume 2014
Surgery
Research and Practice
Current Gerontology & Geriatrics Research
Hindawi Publishing Corporation
http://www.hindawi.com Volume 2014
Hindawi Publishing Corporation
http://www.hindawi.com Volume 2014
Research and Practice
Evidence-Based Complementary and Alternative Medicine
Volume 2014 Hindawi Publishing Corporation
http://www.hindawi.com
Hypertension
Hindawi Publishing Corporation
http://www.hindawi.com Volume 2014
Prostate Cancer
Hindawi Publishing Corporation
http://www.hindawi.com Volume 2014
Hindawi Publishing Corporation
http://www.hindawi.com Volume 2014