Dividend policy and its impact on firm
valuation
Master thesis within: Finance Number of credits: 30 ECTS
Programme of study: Civilekonomprogrammet
Authors: Adam Enebrand
Tobias Magnusson
Advisor: Agostino Manduchi
Co-Advisor: Toni Duras
Jönköping May 2018
A study of the relationship between dividend policy and stock prices on the
Swedish market
Acknowledgements
The authors of this study would like to extend their gratitude to the various people that have been involved in the process of writing this paper. Throughout the semester, the feedback and support that has been given has been outstanding.
We would like to thank our advisor Agostino Manduchi for the thorough supervision and input that has significantly helped the writing of this thesis. Toni Duras also deserves a big thank you from the authors, his help and guidance throughout the statistical parts of this study has been excellent.
Lastly, we would like to extend our gratitude to our fellow students in the seminar group. The thoughts and ideas received has helped the authors to improve this thesis.
Adam Enebrand Tobias Magnusson
Master’s thesis within Business Administration, Finance
Title: Dividend policy and its impact on firm valuation Authors: Adam Enebrand & Tobias Magnusson
Advisor: Agostino Manduchi
Co-advisor: Toni Duras
Date: May 2018
Keywords: Dividend policy, Firm performance, Ratios
Abstract
The issue of dividends and what role it plays, has been the subject of discussion for decades. The main reason for this is that the chosen dividend policy for a company affects several different stakeholders, with shareholders being the most affected party. Determining dividend policy is influenced by multiple factors such as capital structure, potential stakeholder signaling and corporate culture concerning payouts.
This study will investigate how the relationship between firm performance and stock price is affected by the level of dividends a firm pays. To explore this relationship, the authors will conduct a correlation and regression analysis that is performed on data collected on middle and large capitalization firms listed on the Stockholm stock exchange. The chosen time frame for this study is year 2007-2017. Several variables are included in the regression model in order to explore a potential relationship.
The findings of this study indicate that the stock price of high dividend yield firms are more dependent on financial performance compared to low dividend yield firms. However, an overall positive correlation is found between financial performance and stock price for both samples.
Table of contents
Acknowledgements ... ii
Abstract ... ii
1 Introduction & Background ... 1
1.1 Introduction ... 1
1.2 Problem Discussion... 1
1.3 Purpose ... 3
1.4 Delimitations ... 3
2 Theoretical framework ... 4
2.1 Measurement of firm performance ... 4
2.1.1 Earnings ... 4 2.1.2 Ratios ... 5 2.1.3 Return on Equity ... 5 2.1.4 This study ... 6 2.1.5 Limitations to ratios ... 6 2.2 Dividends ...7
2.2.1 Dividend relevance & irrelevance ...7
2.2.2 Dividend & Payout Policy ... 8
2.2.3 Dividend & stock price volatility ... 9
2.3 Dividend policy & firm risk ... 12
2.4 Asymmetric information & Signaling ... 13
3. Methodology ... 15
3.1 Approach ... 15
3.2 Gathering of data ... 16
3.3 Validity & Replicability and Methodology evaluation ... 16
3.4 Data analysis and definitions ... 17
3.5 Time period & Sample size ... 17
3.6 Descriptive Statistic ... 19
3.8 Research method ... 21
3.8.2 Regression model ... 22
3.9 Expected results & Hypothesis ... 22
4. Empirical Results ... 25
4.1 Descriptive Statistics ... 25
4.2 Pearson Correlation ... 25
4.3 Coefficients ...27
5. Analysis ... 30
5.1 Correlation & Multicollinearity ... 30
5.2 Regression Output Analysis ... 31
5.3 Theoretical discussion on empirical results ... 35
6. Conclusion & Discussion ... 37
6.1 Further Research & Implications ... 38
6.2 Ethical issues & Societal Implications ... 39
References ... 40
1
Introduction & Background
This chapter introduces the reader to the notion of dividend and firm performance. The intentions of this study are described and discussed in the problem and purpose section.
1.1 Introduction
Dividend and how it affects the way investors evaluate stocks is a topic debated by many over a long period of time. The financial performance of a firm is essential to sustain and increase stock price and financial returns of investors. This paper investigates the dependency between stock price and firm financial performance and how that differs between firms with high dividend yield and low dividend yield stocks. The underlying idea is that different payout policies lead to different relationships between financial performance and stock price. Firms that cannot deliver expected financial returns should have a devaluation in stock price (Ross, Westerfield and Jordan, 2010). However, as discussed by (Brav et. al, 2005) firms are afraid of cutting dividends as the signaling effect will have a negative impact on stock price. According to this and the signaling effect, firms can manipulate the stock price and sustain a higher stock price than what the financial performance otherwise would produce. Therefore the authors intend to investigate if there is a difference between how the stock price and firm performance interact between high dividend and low dividend firms.
The financial performance will represent the performance of the firm and is measured using return on equity and gross profit margin. So far, the authors’ conception on how dividend and stock performance are interacting is unsatisfactory since limited research has been performed in this specific area, especially on the Swedish market.
1.2 Problem Discussion
With this study, the authors aim to examine the dividend policy’s effect on how stock value responds to firm performance. More exactly, investigating whether or not stock price of firms that pay high dividends are more dependent on the reported financial performance than stocks with lower dividend. Excess capital can be paid as dividend to signal good financial health, which is referred to as the signaling theory. A survey produced by Brav et. al (2005) suggest that managers are reluctant to cut dividend even
if that would be in the best interest of the firm, this is partly explained by the dividend signaling theory. Dividend irrelevance theory states that dividend has an impact on stock price as higher dividend produce a lower stock price. This is explained as equity that leaves the firm in the form of dividend and the stock value should be devalued with the same amount, making dividend irrelevant for the return of the stockholder. Dividend signaling suggest that dividend has a positive correlation with stock price and dividend irrelevance that dividend has a negative correlation with stock price. However, both theories suggest that dividend policy has an impact on stock price. Since both of these theories speaks for dividends potential to impact stock price, it would be interesting to investigate the dependency of stock price on financial performance and if the dependency is similar among firms with different dividend policies.
As argued by Ross, Westerfield and Jordan (2010) financial performance is the optimal way to evaluate stock price. Financial performance being and important factor for stock price is a notion argued by many, Chakravarthy (1986), Feltham and Ohlson (1995) Delen, Kuzey & Uyar (2013) are just a few of all the advocates for firm performance as the main drive of stock price. According to this, stock price should be strongly correlated and fairly dependent on financial performance. Therefore, financial performance should be one of the main variables when evaluating stocks due to this strong relationship. Even though financial performance and dividend policy is not the only factors to consider when evaluating stocks, these are the main variables investigated in this study.
However, as previously discussed there are both theoretical and practical arguments for why dividend have an impact on stock price. Managers can therefore use dividends as a tool to affect the stock price which in turn can lead to stock price deviance from the financial performance. This deviation can influence the ability to make an accurate estimate of the value of a stock for interested market actors. The level of dividend has an effect on how changes in dividend will impact the stock price, stock price of firms with higher dividend yield are more sensitive to changes in dividend (Bajaj and Vijh, 1990). Therefore, it can also make it difficult for managers to appreciate the impacts of dividend policy if dividend has an unexpected effect on how the stock is valuated on the market. This can lead to managers making inefficient decisions regarding dividends.
The authors of this paper theorize that the price of stocks with lower dividend yield should be more dependent on firm performance as reported in the financial statements than those firms with higher dividend. This notion is based on the signaling theory, that high dividend produce a higher stock price. Therefore, stocks with lower dividend yield will be more dependent on the financial performance than the high dividend stocks while the high dividend stock are more dependent on dividend policy.
1.3 Purpose
There has been an abundance of studies conducted regarding dividend policy over several decades since dividends have historically been a heavily debated subject. Several studies have been conducted that regards dividend policy and its effect on share price, both in Sweden and abroad. However, a consensus in the sense of the word has not been reached and to the authors’ best knowledge, a study that includes the aspect of firm performance has not been conducted. Through this research, the authors hope to further investigate the impacts of dividend partly to improve investor and management decisions in the future. Further, to contribute to the theoretical understanding of dividend and its potential impact.
1.4 Delimitations
The thesis will only include large and medium capitalization companies listed in Sweden, more specifically listed on the Stockholm exchange. The thesis will exclude companies in banking and finance sectors, this exclusion is due to the industries special regulatory nature. Companies that were listed and delisted during the defined research period are removed from the sample. Companies in the sample that did not have enough information, were removed as they would significantly reduce the number of observable data in the sample when performing the regression.
2
Theoretical framework
This chapter will introduce the reader to theories regarding firm performance, financial indicators, dividend & payout policies, signaling and asymmetric information as well as further theories in order to help the reader grasp and relate the empirical results and analysis.
2.1 Measurement of firm performance
Firm performance in itself is a broad concept and can refer to several different aspects, depending on who you ask and what it is that is trying to be measured. It can refer to strategic performances such as customer satisfaction, employee satisfaction and CSR performance, however it can also refer to stricter financial performances such as profitability, growth or market value. Companies that can display a strong financial performance are by default more inclined to satisfy one of the most important stakeholders, namely investors and shareholders (Chakravarthy, 1986). Cho & Pucik (2005) argue that financial performance as a method to satisfy investors can be represented by the above mentioned aspects, profitability, growth and market value. Profitability is the term used when describing how well a company is able to generate returns (Glick, Washburn and Miller, 2005). Firms can definitely be valued based on information provided by financial reports. However, it is worth noting that noisy estimates are used for these valuation and therefore have an effect on the valuation process and the end result (Damodaran, 1999).
2.1.1 Earnings
Earnings and revenue streams are further examples of easy and popular methods for investors to measure firm performance. Under the accrual basis of accounting, earnings are the summary measure of firm performance. In general, it can be said that, the success of a firm is dependent on its ability to generate cash flows (Dechow, 2018). Profitability then incorporates different measurements, or indicators, some of whom are used more frequently than others when assessing profitability. There are many advocates for using current earnings for cash flow measurements to predict future earnings with for instance Graham (1962), Kieso and Weygandt (1995) being a few of these. For these authors, earnings are considered a key measurement to evaluate stock prices. This is one of the reasons why revenue is an important measurement and since it is useful and easy to use.
However, it is an absolute number and is therefore difficult to put into relation to other key measures. This is why it is still important to use it together with other financial measurements.
2.1.2 Ratios
Along with profitability, it is also of interest for an investor to investigate liquidity and earnings structures of companies in order to gain a more wholesome overview. Since figures and absolute values in income statements and balance sheets on their own can be quite unhelpful, it is of interest to put them in perspective and context. One way of accomplishing that is to produce ratios from various numbers, in order to easier assess what is being presented in financial statements, ratios are also simplistic to obtain. A common indicator used is return on equity (ROE), which is expressed in a ratio that in turn can indicate a company’s future potentials as well as their current state. Investors are typically using a ratio such as this to make an assessment of companies (Alexander, D. and Nobes, C. 2004).
Ross, Westerfield and Jordan (2010) argue that financial ratios, calculated from common variables in financial statements, is associated with the following benefits; grading the performance of managers for the purpose of rewards, provide assessments of the future by supplying historical information to existing or new potential investors, provide information to creditors and suppliers, evaluating rivals competitive positions and evaluating acquisitions based on their financial performance. Other benefits provided by financial ratios are that they are often used as a mean to predict future firm performance. They can be used as inputs when performing empirical studies or to create models to forecast and predict firm failure or financial distress (Altman, 1968; Beaver, 1966).
2.1.3 Return on Equity
Return on equity (ROE) is one such ratio that is often of interest to investigate. In previous well cited research it is common to use ROE as a way of measuring financial firm performance (Delen, Kuzey & Uyar, 2013). It relates earnings made by the company with the financing provided by shareholders, in the form of equity. It is obviously of interest for shareholders to assess the amount of net income that is returned as a percentage of the equity that they have provided.
From a shareholders perspective, firm performance mainly is measured as the firm's ability to benefit owners, with this point of view ROE is the true bottom-line performance measurement. ROE is considered the measurement of how well the stockholders have fared during the measured time as it calculates the return on shareholders ownership, equity. ROE is therefore a common yet useful tool to measure how well the company is performing from the investors’ point of view (Ross, Westerfield and Jordan 2010).
2.1.4 This study
In this study, focus will naturally be on financial performances such as profitability, growth and market value to measure how well the sample of selected firms perform. The two ratios chosen to measure firm performance is return on equity and gross profit margin. This suits the research well as the objective is to measure firm performance from the perspective of the investing market.
2.1.5 Limitations to ratios
However, it should be noted that there are some limitations to using financial performance as a measure of firm performance. One example is a firm making investments and reorganizations in its structure, which can result in negative reported earnings during that period. Even though these investments are enabling great potential for the firm's future, the negative returns can make it appear as if though the firm does not perform well. This is typical for firms early in their life cycle, large initial investments leading to negative earnings that later turn to become positive (Damodaran, 1999). Another important aspect of financial ratios is that firms often try to adjust them to the industry averages, it is not uncommon, even if the firm do not actively adjust it, that the industry itself operates and affect the ratios. Therefore, the ratios do not just represent a firm's performance but could also contain information about the general market or industry which distorts the information that the ratio is providing. Firms in different industries can therefore provide different ratios as a response to what the rest of the industry looks like and not just their own financial condition (Lev, 1969).
Shareholders do hold different interests and viewpoints on what is most important for a company, one example being whether they hold A-class shares or B-class shares (Alexander, D. and Nobes, C. 2004). In this study however, focus is on shares that are
generally available and interesting for the general public, A-class shares are in reality not commonly available for purchase for the average investor, mainly because of their powerful voting rights compared to B-class shares. This is the reason why they are excluded in this study from the sample that will be tested.
2.2 Dividends
Dividend, or dividends, are the rewards that companies’ shareholders receive, in the form of cash, shares or other. The dividend is decided by a company’s board of directors and needs to be accepted by the shareholders. It is not a requirement to pay dividends to shareholders, however it is traditionally a popular method of rewarding shareholders as part of the company’s residual profit. Residual rewards refer to the funds that are left available after meeting other obligations such as paying creditors (The Economic Times, 2018).
2.2.1 Dividend relevance & irrelevance
Developed by Gordon (1963) and Lintner (1962), the dividend relevance theory states that there is a direct relationship between the market value of a company and its dividend policy. One aspect and addition to this theory is the bird-in-the-hand argument which main point is that investors value current dividend over future dividend or capital gains (Gitman & Zutter, 2012). The argument is based on the notion that certain dividend today is more valuable than uncertain cash flows or returns in the future. As demonstrated by Lintner (1962) and Gordon (1963), the investors required rate of return decreased when dividend increased, cash dividend returns are more certain and therefore higher valued by the investors. Current dividend is seen as less risky, a sign of good financial firm health and as generating a positive effect on the stock price (Frankfurter, Wood & Wansley, 2003).
On the dividend irrelevance side there is the capital structure irrelevance principle which was developed by Miller and Modigliani (1961). This theory states that a firm's value is determined by its earning power and its risk of investment. How the firm chooses to distribute its earnings, as dividend or reinvestments, is not relevant for the valuation of the firm. Another aspect here is that investors are indifferent whether their capital gain is derived from dividends or capital gain since if they are in need of cash they can sell some of their stocks. The return gained by the investor is therefore the same whether the stock
pay dividend or not, thus, the dividend policy is irrelevant for the stockholder and the possible returns (Gitman & Zutter, 2012).
2.2.2 Dividend & Payout Policy
Determining whether or not to pay dividends, and to what extent, is affected by several factors that influence the policy regarding dividends that companies exhibit today. Exploring these factors and what drives the decisions companies make regarding paying dividends or to reinvest capital in to the company have been of interest for decades. Lintner (1956) identified a link between the stability of earnings and dividends, meaning that a projected increase or decrease of earnings would subsequently affect the level of dividend to be paid. Today, a link between the two still exists, however it has weakened while other factors have increased in significance.
A company’s payout policy regarding dividends is in general highly conservative and fixed, meaning that managers are reluctant to cut dividends or even to try and change the policy in any manner altogether (Brav et. al, 2005). There are some key reasons for this that have remained fairly unchanged since Lintner (1956), the major reason is that cutting dividends is often associated, from the market’s viewpoint, with a company having financial difficulties, therefore a dividend cut would likely lead to the market assuming there is trouble and inevitably start generating uncertainty (Brav. et al, 2005).
Policies regarding dividends have remained fairly unchanged, as mentioned, for decades mainly due to its inflexibility and strong symbolic value to important stakeholders. In contrast to this, it was not unsurprising to find that a majority of interviewees in the survey by Brav et. al, (2005) revealed that if managers were to choose a method of payout policy for the very first time, in a hypothetical scenario freed from constraints such as company tradition regarding paying dividends, they would prefer repurchasing shares rather than paying dividends (Brav et al., 2005). Noted here should be as well that opinions regarding the previously mentioned statement, concerning a hypothetical ‘clean slate’ scenario, differed depending on what policy the interviewee’s respective company currently has, which is logical since there will inevitably be a number of companies that believe that their current policy is what’s best suited for them, whether they pay dividends or not.
In the decades that has passed since Lintner, it can be concluded that a major finding, regarding dividend policy, its inflexibility and company’s conservative approach towards it, still holds in the 21st century. However, as mentioned, the policy of repurchasing company shares, as an alternative to paying dividends, from the marketplace has increased significantly in popularity since the mid 1900’s. This is not without its reason, for example, a company that currently faces few to no projects or investments that seem profitable based on standard present value calculations, are able to reduce levels of investment and instead increase payouts.
The opposite is also true when faced with promising opportunities, to be able to decrease payments and instead increase capital that can be invested. Based on the findings in the survey, this is an important factor when faced with decisions regarding payout policies. To showcase how delicate it is to alter or reduce dividends, several managers in the survey admitted that their companies would be prepared to delay investments or even raise external capital simply to be able to maintain the established level of dividend per share in their respective company. Unsurprisingly, this can be hurtful to a company rather than helpful. Using repurchasing has other benefits beyond the aforementioned flexibility, since the number of shares outstanding is reduced, it can increase the level of earnings per share as well as raise market value on shares that are still outstanding.
Another key difference found in this survey is each payout policies priority with respect to operational and investment decisions (Brav. et al, 2005). Related to the mentioned conservatism regarding dividends, it is not unsurprising that managers view the level of dividend payouts as important as levels of investments. However in terms of repurchasing shares, managers argue that operational and investments actions are prioritized above that form of payout.
2.2.3 Dividend & stock price volatility
The issue of financial reporting is something of high interest for both managers and investors. Managers are interested in financial reporting as the posts in it are closely related to their compensation and position. Investors are much interested in the figures presented as those are the foundation on which they base their valuation of the company (Dimitropoulos and Asteriou, 2018). Under the accrual basis of accounting, revenues are
Commented [es1]: Källa? Commented [AE2R1]:
Commented [es3]: Egen åsikt?
the summary measurement of firm performance. Over short periods, earnings are more strongly correlated to stock returns than realized cash flow, however, as measure period is increased, the cash flow is more related to stock price than the revenues themselves. The stock price of firms facing large changes in their working capital are also more related to revenues than the realized cash flows (Dechow, 2018). This confirms previous research that there is a strong correlation between the firm's ability to collect revenue and its stock price.
Conover, Jensen and Simpson (2016), found that, in the long run, stocks with a high payout ratio outperform the stocks with low payout ratio in terms of return, yet they display lower risk in terms of volatility. Counter evidence to this is presented by Mark Hirschey who argue that when taxes and transaction costs are included there are no benefits in terms of returns or riskiness (Hirschey, 2000). However, Hirschey only tests for the Dogs of the Dow strategy which means that he holds a smaller sample for the high dividend stocks than Conover, Jensen and Simpson. Therefore, the increase in risk could be explained by the smaller portfolio which would be more sensitive to macro market changes.
Allen and Rachim (1996) used a sample of 173 firms listed in Australia examined from 1972 to 1985 to test for correlation between stock price volatility and dividend policy. After controlling for firm size, volatility on earnings, growth and leverage, a cross-sectional regression analysis was made to test for dividend policy and stock price volatility. The result showed no evidence for a correlation between stock price volatility and dividend yield.
However, they did find evidence for a significant positive correlation between leverage, earnings volatility and stock price volatility. They also found evidence for a strong correlation between firm size and stock volatility, providing evidence for the importance of dividing firms in different sizes in corresponding samples for more accurate results. The authors found no evidence for the findings of Baskin (1989) that dividend policy, dividend yield, would influence the stock price volatility. However, it is widely accepted that there is a positive correlation between debt and volatility (Hussainey, Mgbame and Chijoke-Mgbame, 2011). Since Baskins (1989) results also suggest that firms with higher
dividend payout also borrow more, the higher volatility could be explained by debt, and not the dividend itself.
A company’s dividend policy and its potential effect on the company’s corresponding volatility in terms of share price have been the subject of discussions and studies for decades. As previously discussed, results of different studies have not lead to conclusive findings, although some evidence have shared similarities. Hussainey, Mgbame and Chijoke-Mgbame (2011), examined the relationship between dividend policy and share price volatility on UK stock market during a 10-year period, 1998 to 2007.
A few noticeable limitations regarding their study is the fact it only concerned quoted firms in the UK and exclusion of financial sector firm due to their particular regulatory environment. Their findings indicated a clear negative relationship between a firm’s payout ratio and share price fluctuations. A negative relationship was also found concerning the dividend yield and the volatility of the share price, meaning that as dividend yield increases, share price volatility decreases. These particular findings were largely in line with the results shown by Allen and Rachim (1996) mentioned earlier. However regarding payout ratio, meaning the proportion of earnings paid out as dividends, their results differed from that of Baskin (1989), as a main conclusion was that a higher payout ratio accord with a less volatile share price. Furthermore their findings also indicated that share price volatility is mostly impacted by payout ratio, again meaning the proportion of earnings paid as dividends (Hussainey, Mbgame and Chijoke-Mbgame 2011).
As Baskin (1989), also implemented control variables to be able to account for components that have an impact on both share price volatility and dividend policies, with firm size, asset growth and earnings volatility being examples of these. Among these control variables, it was found that firm size and level of debt had the highest correlation with share price volatility. Firm size had a negative relationship with volatility whilst level of debt carried a clear positive relationship. In this case, level of debt refers to the more debt levered companies are, the more their share prices tend to fluctuate. However this is not surprising since companies that accommodate high debt-to-equity ratios fuel their investment and financing activities with borrowed funds, inevitable leading to a need
for earnings to exceed the costs of the loaned funds. This in turn can create a smaller ‘margin of error’ in times of financial distress and recessions, factors like these can explain a level of uncertainty from the market that can manifest itself as a more volatile stock.
2.3 Dividend policy & firm risk
The relationship between dividends and firm has received little attention in literature and research compared to the relationship between dividends and stock price (von Eije, Goyal & Muckley, 2013).The risk of a firm is a concept requiring many aspects in its analysis both on the systematic risk and the idiosyncratic risk. The return and volatility of a stock is dependent on many factors and aspects which need to be taken into consideration. Sensitivity to overall market returns, size and value factors of the company (Fama and French, 1993).
There is also the financial life cycle, as the firm grows it becomes more mature and larger which in turn leads to a smaller risk factor (Goyal and Santa Clara, 2003). For scientific research it is interesting to study whether changes in firm value can be caused by dividend policies and if this is effected by systematic, idiosyncratic risk or both. According to von Eije, Goyal & Muckley (2013) it is therefore important to study the impact of different dividend policies on all the previously mentioned risk factors. They performed a quantitative study on firms in the United States to test the impact of firm dividend policies on firm risks. The data included cash dividend initiations, omissions, the duration of the policies and the amounts of the payout. This was assessed on total risk, idiosyncratic risk and systematic market risks, as well as the Fama-French, 1993, size and distressed earnings risk factors of the firms in their sample.
They found that dividend omissions increase idiosyncratic risk more than the initiation of dividend reduced the risk. However, according to their result, dividend initiations and dividend omissions has a relatively small effect on systematic risks (von Eije, Goyal & Muckley 2013). The research provided a lot of insights on how stocks with different and changing dividend policies were exposed to different types of risk. Another side to take into consideration is the point that is made by Goyal, A., & Muckley, C (2013) who, in consistency with Brockman and Unlu (2009), find support that the decision to pay firm
value dividend is guided by the notion to promote and spread the reputation of the firm. Again, referring to the signaling effect of dividend and how that may have an impact on the decision making regarding dividend policies.
2.4 Asymmetric information & Signaling
Asymmetric information has an effect on capital structure (Baskin 1989). As found by Masulis and Korwar (1986) and Mikkelson and Partch (1986), stock price responds to announcements of new equity issues by dropping in price. As demonstrated by Myers and Majluf (1984), due to asymmetric information, market actors will interpret equity issues as bad news since managers are inclined to make this type of issue when stocks are overpriced. Healy and Palepu (1993) discuss that managers have superior information in comparison to outside investors. Examples provided by Dye (1988), Marais, Schipper and Smith (1989) suggest that it is generally accepted among market actors and researchers that there exists an information asymmetry between company management and outsiders. This implication, that dividend has a signaling effect and contains information for outsiders, is nothing new. An increase in dividend implies that managers believe that earnings have permanently changed (Lintner, 1956).
A common theme of the previously discussed articles is that dividend is not just an action taken to distribute wealth to owners but also a way to signal the managers’ expectations of future firm performance. However, researchers with a more critical view of this point have had their voices heard. Brealey and Myers (2008) suggest that dividend do contain information, yet, management's decision to change dividend depend more on past earnings and firm performance than on management's expectations for the future. But either way, as mentioned in the book, they expect managers to account for future prospect as well when setting the payments and level of dividend. However, from these discussed articles, it can be concluded that it does exist asymmetric information among market actors and that managers can use dividend as a tool to inform the market about the state of the firm.
In support of dividend and its information content, Healy and Palepu’s (1988) published a paper examining whether dividend changes convey information about future earnings. They found that firms that initiate dividend payments have a positive change in earnings,
this while firms constraining dividend payment showed negative results in future earnings. In contradiction to the signaling theory, the returns decline the year that the omission takes place but then improves significantly over the next several years. For the firms initiating dividend payments they find an increase in performance for past two years and the following two years. Therefore, no evidence for a permanent decrease in earnings for firms decreasing dividend payments.
The information provided by dividends and how it is interpreted by market actors is an essential part of market efficiency, especially since firms of different sizes and dividend ratios respond differently to changes in dividend. As shown by Bajaj and Vijh (1990), whose results suggest that high yield stocks are more sensitive to changes in dividend than those with lower dividend, which suggests that level of dividend is one of the factors that determines how certain stocks will respond to changes in the market.
3.
Methodology
This chapter will explain the methodology the thesis will follow, methods used, secondary and primary data as well as areas of qualitative and quantitative data. Further, the reader will be introduced to characteristics of the sample used.
3.1 Approach
The methodology consists of using quantitative secondary data from databases such as Datastream, Morningstar and Nasdaq Omx Nordic. Furthermore, complementary data not found in the aforementioned sources will be gathered from each respective company’s official financial releases such as quarterly and annual reports. More specifically, examples of data to be collected includes key ratios and measurements such as, return on equity (ROE) and profit margins. These ratios are all ratios which are expected to have a positive correlation with the stock price. How these ratios are used will be described later on.
A quantitative approach is most suitable when research requires a large amount of data to be gathered, analyzed and tested. It is easier to hold a larger sample and to perform the testing multiple times with different variables to provide more accurate results. Also, the method provides absolute values (Bryman, 2015). Quantitative method, is the gathering of numerical data, analyzing it and gaining a grasp of the relationships behind the numbers (Bryman & Bell 2011). Therefore, for this research, a quantitative method has been chosen. There are a few key reasons for this, firstly, a large amount of data will be gathered and tested. Secondly, relationships and correlations between the collected data will be explored which requires a lot of comparable data. Lastly, once the tests are performed, the authors will have absolute values which will be interpreted to produce a result that can determine what has been found.
Testing the gathered data for relationships and correlation concerns statistical analysis, is the mathematics area of this study. Since the analysis will incorporate more than one variable the authors found the Pearson correlation to be the most suitable for the analysis. The Pearson Correlation coefficient, Pearson's r, represents the linear correlation which exists between the selected variables. It is a recognized and widely used tool among researchers to perform correlation analysis. To control for statistical significance in the
analysis for this paper, a two tailed P value will be used. This provides the level of statistical significance of the calculated correlation (Pearson's r) (Bryman & Bell, 2011).
3.2 Gathering of data
As a quantitative method will be used for this research the authors will use secondary sources when collecting data, that is, data that already exists such as data in financial reports, records and stock prices. Secondary data is useful when performing a quantitative research method as it is easy to gather, analyze, test and compare. The drawback of this type of data is that it usually does not contain detailed analysis or in depth discussions directly connected to this research. However, for the quantitative approach used in this research a large sample of data is of more value than in depth analysis prior to our own analysis. Therefore, secondary data will be as valuable as and easier to gather than primary data.
3.3 Validity & Replicability and Methodology evaluation
Using data collected for the quantitative method, the number of bias errors and errors occurring due to interpretation by third party should be limited. However, as the data is collected on the Swedish market and is based on numerical values that companies have presented in their financial reports, systematic errors and random errors can be at play. Results can vary depending on time frame, sample, different definitions and different focus on key variables. To secure the external validity of the research, a large sample of 85 firms all listed on the Swedish market as mid or large capitalization firms has been covered for an eleven year period, 2007-2017. Also, for internal validity, control variables have been assigned to the sample to check for casual relationships which could skew the results. Restrictions on the data have been enforced, including removal of extreme outliers and screening of firms, to produce a more accurate representation, all restrictions have been well documented in this paper and all sources listed. Thus producing a high degree of replicability and making the research easy to follow up. Through this, the authors of this paper aimed to satisfy the four criterion of quantitative research to assess a certain level of trustworthiness in the data; credibility, replicability, reliability and confirmability. This to attain a trustworthiness and validity of the data used for this research (Bryman & Bell 2011).
3.4 Data analysis and definitions
The authors of this report are using profitability and sales measures to evaluate firm performance. When firm performance is discussed, it will be based on two profitability measurements that will represent firm performance. This is to provide a feasible sample size that would still fairly represent firm performance. The independent and control variables and their respective units of measurement are presented below.
Independent Variables (Firm Performance)
Return on Equity - ROE = Net Income / Shareholders Equity Gross Profit Margin - GPM = (Revenue – Cost of Goods Sold) / Revenue
Control Variables:
Long Term Debt - LTD = Absolute Values Market Value - MV = Absolute Values
Some of the numerical material which will be used for the research already exist and can be found at one of the previously mentioned sources.
3.5 Time period & Sample size
As mentioned the authors chosen time frame spans from 2007 to 2017, there are a few key reasons for this. Firstly, reaching further back in time will enlarge the problem of firms not being listed then but that are listed now, which leads to inconclusive data in the sample. Further, the companies that are listed now as well as in 2007 are found to have a more frequent lack of data the further back in time one searches. A large number of missing values can generate skewed results when performing correlation and regression models, therefore the time frame 2007-2017 was chosen as it decreases the problem of missing values while still spanning over a decade, which is a sufficient amount of time.
The sample to be used consists of 85 firms, these firms have all been listed since or before 2007 which enables the same type of data to be gathered from all companies. These 85 companies do not contain banks or investment companies because of the special regulatory nature within the finance industry, an approach that was also implemented by Hussainey, Mgbame and Chijoke-Mgbame (2011). The sample size of 85 firms is to be
compared with the total population of potential firms, referring to the complete amount of firms that are currently listed as mid or large capitalization firms on Nasdaq Omx Nordic, which is a total of 436 firms, as of April 2018. Due to the limitations set on companies, with delisting, industry restriction, and companies not being listed during the entire chosen time frame, the authors reached a rejection rate of 80,5%, (1 - (85/436)).
The sample of 85 companies is then divided into two subsamples, based on each respective company’s dividend yield. One subsample consists of low dividend yield firms, and the other on high dividend yield firms. Determining whether or not a company categorizes as a high or low dividend yield firm is based on their average dividend yield spanning over the chosen time frame, 2007-2017.
3.6 Descriptive Statistic
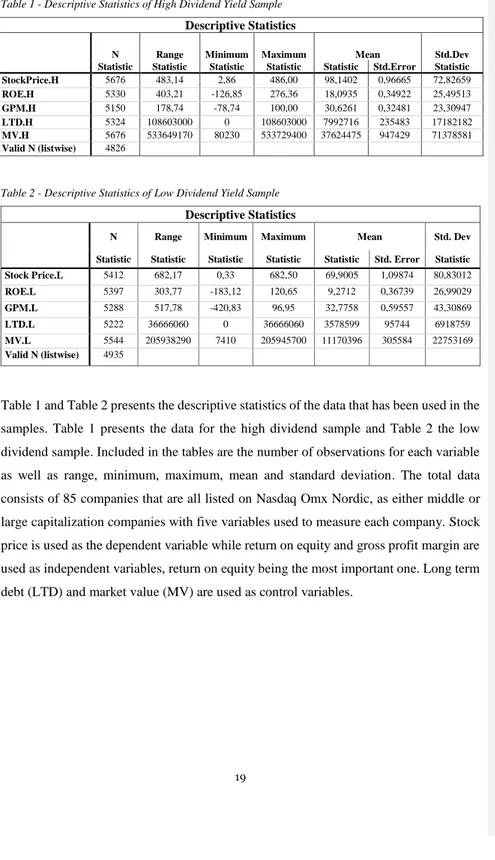
Table 1 - Descriptive Statistics of High Dividend Yield Sample
Descriptive Statistics
N Range Minimum Maximum Mean Std.Dev Statistic Statistic Statistic Statistic Statistic Std.Error Statistic StockPrice.H 5676 483,14 2,86 486,00 98,1402 0,96665 72,82659 ROE.H 5330 403,21 -126,85 276,36 18,0935 0,34922 25,49513 GPM.H 5150 178,74 -78,74 100,00 30,6261 0,32481 23,30947 LTD.H 5324 108603000 0 108603000 7992716 235483 17182182 MV.H 5676 533649170 80230 533729400 37624475 947429 71378581 Valid N (listwise) 4826
Table 2 - Descriptive Statistics of Low Dividend Yield Sample
Descriptive Statistics
N Range Minimum Maximum Mean Std. Dev Statistic Statistic Statistic Statistic Statistic Std. Error Statistic Stock Price.L 5412 682,17 0,33 682,50 69,9005 1,09874 80,83012 ROE.L 5397 303,77 -183,12 120,65 9,2712 0,36739 26,99029 GPM.L 5288 517,78 -420,83 96,95 32,7758 0,59557 43,30869 LTD.L 5222 36666060 0 36666060 3578599 95744 6918759 MV.L 5544 205938290 7410 205945700 11170396 305584 22753169 Valid N (listwise) 4935
Table 1 and Table 2 presents the descriptive statistics of the data that has been used in the samples. Table 1 presents the data for the high dividend sample and Table 2 the low dividend sample. Included in the tables are the number of observations for each variable as well as range, minimum, maximum, mean and standard deviation. The total data consists of 85 companies that are all listed on Nasdaq Omx Nordic, as either middle or large capitalization companies with five variables used to measure each company. Stock price is used as the dependent variable while return on equity and gross profit margin are used as independent variables, return on equity being the most important one. Long term debt (LTD) and market value (MV) are used as control variables.
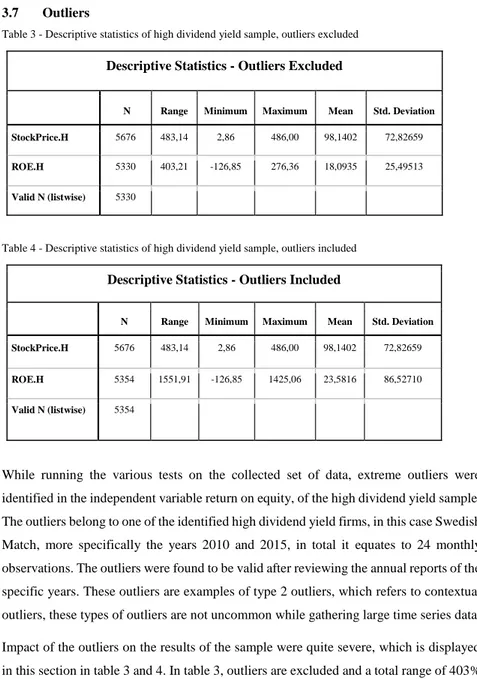
3.7 Outliers
Table 3 - Descriptive statistics of high dividend yield sample, outliers excluded Descriptive Statistics - Outliers Excluded
N Range Minimum Maximum Mean Std. Deviation StockPrice.H 5676 483,14 2,86 486,00 98,1402 72,82659
ROE.H 5330 403,21 -126,85 276,36 18,0935 25,49513
Valid N (listwise) 5330
Table 4 - Descriptive statistics of high dividend yield sample, outliers included Descriptive Statistics - Outliers Included
N Range Minimum Maximum Mean Std. Deviation StockPrice.H 5676 483,14 2,86 486,00 98,1402 72,82659
ROE.H 5354 1551,91 -126,85 1425,06 23,5816 86,52710
Valid N (listwise) 5354
While running the various tests on the collected set of data, extreme outliers were identified in the independent variable return on equity, of the high dividend yield sample. The outliers belong to one of the identified high dividend yield firms, in this case Swedish Match, more specifically the years 2010 and 2015, in total it equates to 24 monthly observations. The outliers were found to be valid after reviewing the annual reports of the specific years. These outliers are examples of type 2 outliers, which refers to contextual outliers, these types of outliers are not uncommon while gathering large time series data. Impact of the outliers on the results of the sample were quite severe, which is displayed in this section in table 3 and 4. In table 3, outliers are excluded and a total range of 403% is found in return on equity with a mean of 18,09% and a standard deviation value of 25,49. In table 4, it is shown what affect the outliers have on the sample when they are included, the ROE range increases to 1551,91%, the mean return on equity increases with an excess of 5% and the standard deviation is now found to be 86,5270. The previously
mentioned value changes indicate that the outliers do in fact greatly impact the sample, which increases the risk of skewed results in the outcome of the multiple linear regression model. This could in turn lead to conclusions being drawn on inaccurate results. Linear regression models are sensitive to regression outliers since such extreme values do not convey to the general linear pattern that is the vast majority of the data (Hubert & Rousseeuw, 2011). Therefore, because of the large impact the regression outliers had on the sample, the 24 extreme observations were decided to be removed from the sample. It is further displayed in graph 1 and 2, found in the appendix, in the form of scatterplots, how extreme the values are in relation to the vast majority of observations concerning return on equity.
3.8 Research method
Multiple regression will be performed on the data for the thesis. One dependent variable and several independent variables will be used for each sample. When performing a regression like this, one or several independent variables are used and sometimes changed or manipulated to measure their impact on the dependent variable. In this research, the price of the stock is the dependent variable while the variables to measure firm performance are the independent variables. The data covering the financial structure and market value of the firm are control variables.
A correlation analysis in SPSS will also be performed in addition to the multiple regression analysis. The Pearson Correlation analysis will only be briefly addressed and discussed since the main point of focus is on the regression analysis, however the authors find it necessary to mention the outcome of the correlation analysis in order to control for multicollinearity.
3.8.1 Correlation
This test will performed to control which variables are correlated or not, both for the dependent variable and the independent variables in each sample. This will provide information regarding firm performance, stock price and its relation with the control variables. It is also useful to control if there is any simultaneous movement between independent variables and unveil if there is any multicollinearity (Drury, 2012).
3.8.2 Regression model
To find the previously mentioned relationship between the variables a regression model will be used. A regression model is a statistical tool which measures the effect of the independent variable on the dependent variable. As this research has more than one independent variable, a multiple regression model will be used. This model can contain more than one independent variable and for each independent variable there is a new coefficient measuring the effect of the independent variable on the dependent variable.
Multiple regression model
SP = β0 + β1 ROE + β2 GPM + β3 LTD + β4 MV + ε (Equation 1)
It is necessary to control for multicollinearity between the independent variables when performing a multiple regression analysis. This is to satisfy one of the assumptions of the regression, that the independent variables are not significantly linearly correlated to each other. Multicollinearity may reduce the precision of the estimated coefficients and also making the coefficients highly sensitive to small model changes and thus, skewing results.
3.9 Expected results & Hypothesis
The total stock value can be measured as the dividend and the market value of the stock. A poor performing firm can impact its stock price by paying dividend and therefore distort the relationship between performance and stock price. This suggests that the management of firms can create financial incentives for investors to not only base their valuation on firm performance but also the promised future dividends. Financial benefits are not the only incentive for managers to adjust their dividend policy, signaling can also have a major impact on the valuation of stocks. High dividend signals a management that believes in a prosperous future of the firm, therefore it can attract investors even if the firm underperforms in relation to its stock price. The signaling aspect of dividend is therefore important to consider, if poor financial performance is outweighed by the signaling effect then stock price and firm performance may deviate from each other. However, a positive relationship is expected to be found for both samples, although a stronger relationship for the low dividend firms. Firm size and level of debt are also important factors to take into consideration as more debt levered companies and smaller
companies tend to fluctuate more in price. Based on what has been discussed, the authors have formulated the following hypothesis for this thesis;
H1: There is a distinct difference between high dividend yield and low dividend yield stocks in terms of how dependent the stock price is on the independent variables
H0: There is no distinct difference between high dividend yield and low dividend yield firms in terms of how dependent the stock price is on the independent variables
A distinct difference is classified, between the samples, as a difference that is substantial enough to have an impact on firm valuation. In the case that H1 is accepted, then dividend yield is an important factor to consider even when firm valuation is measured with common financial ratios such as return on equity.
3.10 Dummy variables
When investigating stock prices and firm performance, it is important to take timing into consideration to control for different years. One way to measure this is by using indices. However, this can be quite difficult to apply since a regression analysis is being used and the effect of timing can be difficult to quantify. Therefore, the authors decided to use dummy variables as a way to measure how different years have an effect on the sample, which can generate a time trend for the chosen indices (Cameron, 2005).
When two variables lack a quantifiable relationship to each other in a regression analysis, dummy variables can be helpful. Using dummy variables, non-numerical categories are assigned numbers in order to be part of the regression analysis, this can help to measure a category which otherwise would be difficult to measure on a numerical scale. Dummy variables take on one out of two values to represent these categories, 0 or 1, 1 represents that the criterion is satisfied whilst 0 represents that the criterion is not satisfied. In this case, dummy variables have been used to take the time factor into consideration, 1 represents the year that will be taken into consideration, while 0 represents the year that will not be taken into consideration. This research covers a time span of eleven years and therefore ten dummy variables have been included.
In order to make use of the dummy variables, all observations in a given year (monthly observations yielding 12 per year in total) are assigned a value of 1, whilst the remaining categories (years) are assigned a value of 0. The categories (years) that are assigned a 0 are deactivated, meaning that they do not affect the model, all years in the chosen time frame are activated except one. This is because one category (year) is always eliminated, meaning not assigned a value of 1 or 0, when using dummy variables. A common practice is then to choose the base year as the category (year) to be eliminated, in this case it is 2007 that will not be assigned a dummy variable. All other years are assigned an individual dummy variable. For those years with a coefficient activated, dummy value 1, the model will only consider the variables belonging all observations included for that year. Beta provided by regression is the deviation from the reference category/eliminated category, 2007, for the dummy variables (Hardy, 1993).
4.
Empirical Results
This chapter will present to the reader the obtained results from the performed statistical tests. Descriptive statistics will be presented first, followed by brief presentations of the Pearson Correlations and lastly the results from the multiple regression models.
4.1 Descriptive Statistics
It can be observed in Table 1, on page 19, that share prices in the high dividend yield sample have a significantly higher mean than that of the low dividend yield sample, with a mean of 98.14 SEK in the high dividend yield sample compared to 69.90 SEK in the low dividend yield sample in Table 2. Furthermore concerning share prices, the sample of firms with a high dividend yield are showing a lower level of variance compared to the low dividend yield sample, and thereby a lower level of standard deviation. Meaning that the high dividend yield sample is generating a smaller deviation from the mean price than that of the low dividend yield sample.
Concerning the most important independent variable, return on equity, it is observed in table 1 and table 2 that there are both some similarities and differences across the samples. The average return on equity is 8,82% (18,09 % - 9,27 %) higher in the high dividend yield sample compared to the low sample which is similar to the characteristics of the other variables as well, that the sample of high dividend yield firms is generally showing larger values and better margins compared to the low dividend yield sample. A noteworthy remark concerning these similar characteristics is that the sample of high dividend yield firms contains a majority of the large capitalization firms that were included in the original sample of 85 listed companies.
4.2 Pearson Correlation
The sample of 85 firms were also tested for correlation between the chosen independent variable, control variables and the dependent variable, share price. As mentioned earlier a test for bivariate Pearson correlation was conducted to showcase each chosen variable’s correlation with share price, as well as to each other. It can be concluded that the sample consisting of high dividend yield generally showed a stronger correlation between the variables chosen to represent firm performance, and the share price. Those firms paying lower dividend generally showed a weaker relationship between firm performance and
stock price. However, for the low dividend sample, only half of the variables showed a significant correlation, meaning that the correlation between how well the firm performed and stock price do not significantly relate to each other. The variable showing significant correlation, excluding the control variables, was return on equity. The output tables of the Pearson correlation tests can be found in its entirety in the appendix, table 9 and 10, and will not be further discussed.
4.3 Coefficients
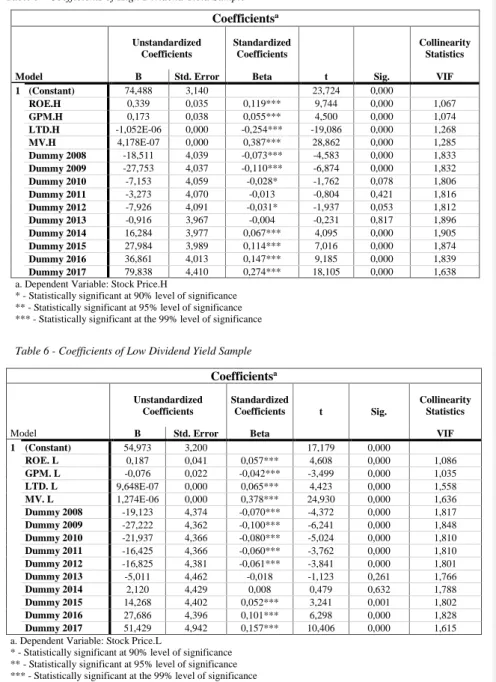
Table 5 - Coefficients of High Dividend Yield Sample
Coefficientsa Model Unstandardized Coefficients Standardized Coefficients t Sig. Collinearity Statistics B Std. Error Beta VIF 1 (Constant) 74,488 3,140 23,724 0,000 ROE.H 0,339 0,035 0,119*** 9,744 0,000 1,067 GPM.H 0,173 0,038 0,055*** 4,500 0,000 1,074 LTD.H -1,052E-06 0,000 -0,254*** -19,086 0,000 1,268 MV.H 4,178E-07 0,000 0,387*** 28,862 0,000 1,285 Dummy 2008 -18,511 4,039 -0,073*** -4,583 0,000 1,833 Dummy 2009 -27,753 4,037 -0,110*** -6,874 0,000 1,832 Dummy 2010 -7,153 4,059 -0,028* -1,762 0,078 1,806 Dummy 2011 -3,273 4,070 -0,013 -0,804 0,421 1,816 Dummy 2012 -7,926 4,091 -0,031* -1,937 0,053 1,812 Dummy 2013 -0,916 3,967 -0,004 -0,231 0,817 1,896 Dummy 2014 16,284 3,977 0,067*** 4,095 0,000 1,905 Dummy 2015 27,984 3,989 0,114*** 7,016 0,000 1,874 Dummy 2016 36,861 4,013 0,147*** 9,185 0,000 1,839 Dummy 2017 79,838 4,410 0,274*** 18,105 0,000 1,638 a. Dependent Variable: Stock Price.H
* - Statistically significant at 90% level of significance ** - Statistically significant at 95% level of significance *** - Statistically significant at the 99% level of significance
Table 6 - Coefficients of Low Dividend Yield Sample
Coefficientsa Model Unstandardized Coefficients Standardized Coefficients t Sig. Collinearity Statistics B Std. Error Beta VIF 1 (Constant) 54,973 3,200 17,179 0,000 ROE. L 0,187 0,041 0,057*** 4,608 0,000 1,086 GPM. L -0,076 0,022 -0,042*** -3,499 0,000 1,035 LTD. L 9,648E-07 0,000 0,065*** 4,423 0,000 1,558 MV. L 1,274E-06 0,000 0,378*** 24,930 0,000 1,636 Dummy 2008 -19,123 4,374 -0,070*** -4,372 0,000 1,817 Dummy 2009 -27,222 4,362 -0,100*** -6,241 0,000 1,848 Dummy 2010 -21,937 4,366 -0,080*** -5,024 0,000 1,810 Dummy 2011 -16,425 4,366 -0,060*** -3,762 0,000 1,810 Dummy 2012 -16,825 4,381 -0,061*** -3,841 0,000 1,801 Dummy 2013 -5,011 4,462 -0,018 -1,123 0,261 1,766 Dummy 2014 2,120 4,429 0,008 0,479 0,632 1,788 Dummy 2015 14,268 4,402 0,052*** 3,241 0,001 1,802 Dummy 2016 27,686 4,396 0,101*** 6,298 0,000 1,828 Dummy 2017 51,429 4,942 0,157*** 10,406 0,000 1,615 a. Dependent Variable: Stock Price.L
* - Statistically significant at 90% level of significance ** - Statistically significant at 95% level of significance *** - Statistically significant at the 99% level of significance
The standardized Beta for the most important independent variable, return on equity, is higher in the sample containing high dividend yield firms compared to sample containing low dividend yield firms, 0,119 compared to 0,057 as observed in table 5 and 6. Further, return on equity in both samples do have a statistically significant unique contribution on share price, with both samples showing levels of significance for return on equity at levels well below the p-value benchmark of 0,05.
Gross profit margin on the other hand is different from one another in the two samples, again observing the standardized beta values in table 5 and 6. In the low dividend sample it is found that gross profit margin is slightly negative however in the high dividend yield sample, gross profit margin is positive, although only with a small margin. The same pattern is true when observing the unstandardized beta, even though the values are higher since they have not yet been converted to the same unit of measurement. However, all of the values are still significant and provide evidence of the independent variables having a statistically significant impact on the dependent variable. The stock price of firms with high dividends is generally more affected by the chosen firm performance variables than those firms with lower dividends.
This also suggests that ROE and GPM have a smaller impact on stock price for low dividend firms. The standard error is higher for GPM than ROE in the high dividend firms and lower for the low dividend firms. However, the Std. Error is quite low for both of the variables in both tested samples.
The unstandardized beta and the standardized beta coefficient for the included dummy variables provide negative results from 2008 to 2013 but positive results for the remainder of the time frame, 2014-2017. This trend applies to both the high dividend yield and low dividend yield sample. The time factor appears to have had an impact on the outcome of the regressions, both for the high dividend yield sample and the low dividend yield sample. However, the years with negative effect appears to have had a larger impact on low dividend firms than on high dividend firms, while the years with a positive effect have had a larger impact on the high dividend firms.
By observing the collinearity statistics column in both table 5 and 6, there appears to be no problem of potential multicollinearity, this is determined by the observing the values for variance inflation factor (VIF). Benchmarking what VIF value is tolerable depends on several aspects such as what is being tested, number of observations and sample size. However, there is no VIF value above 2 found in the regressions made, this indicates that there exists no multicollinearity since values below 2 are not regarded as problematic in terms of multicollinearity.
5.
Analysis
This chapter will provide the reader with an analysis and discussion about the empirical results found in this study. The analysis will explore how these results relate to discussed theory and the problem presented initially
5.1 Correlation & Multicollinearity
The correlation matrix in in appendix provides the correlations between the variables in this paper. These can be used to test for multicollinearity and if correlation between the independent variables is higher than 0.7 or lower than -0.7, then multicollinearity may be present (Drury, 2012). The highest correlation found between the independent variables in the high dividend sample is between market value and long-term debt with a value of 0.439. In the sample for low dividend firms the highest correlation is between market value and share price, with an identified correlation of 0.462. Further, there is again a strong correlation between market value and long-term debt, with a correlation value of 0.434.
However, both samples provide correlations that are lower than 0.7 and most correlations are not near as high as the correlation between the previously mentioned relationships. This suggests that in terms of multicollinearity, the results of this study are reliable since the variables are well within the boundaries of the stated limit. When a similar analysis was performed without the control variables, comparable correlation values were obtained. This indicates that multicollinearity is not a problem, even without the control variables.
Another indicator used to control for multicollinearity is the Variance inflation factor
(VIF) output from the regression analysis. VIF estimates how inflated the variance of regression coefficient is due to multicollinearity. It is generally accepted that a VIF higher than 10 indicates a correlation between independent variables that could skew the results, the rule of 10 (O´Brien, 2007). The regressions for both samples provided a top VIF value of 1,285 for the high dividend sample, and 1.636 for the low dividend sample with VIF values for the dummy variables being excluded. These obtained VIF values are well below the common rule of 10. No single VIF value was significantly different from the
VIF values of the rest of the sample. This observation was in line with was has been found when observing the outcome of the correlation matrix.
The correlation pattern between the dependent and independent variables was somewhat aligned with what the authors expected. There was a positive correlation between stock price and the independent variables as expected but with two exceptions, gross profit margin for the low dividend sample and long-term debt for the high dividend sample. Since previous research suggest that level of debt and stock price volatility is positively correlated it came as no surprise that one of the samples had a positive correlation between stock price and long term debt.
However, more surprisingly, it was found that gross profit margin was negatively correlated with stock price for the low dividend sample. This held as true also when control variables were removed from the sample. Several factors can be the explanation to this relationship. One explanation is that those firms with a low profit margin are investing their capital and is therefore increasing their assets. This in turn leads to a higher stock price as low dividend yield investors are interested in the long term operation of the firm. This may not hold for those firms with high dividend yield since when their profit margins increase, it means that investors can attain more dividend payments and thus the stock price increases. Those who invest in low dividend firms may not be as interested in profit margin as they do not claim their returns in dividend but in increased value of the stock itself. Therefore, high dividend firms increase their stock value when profit margins increase and low dividend firms’ stock price is more dependent on other factors.
5.2 Regression Output Analysis
The authors wish to investigate which type of firm has a stock price that is the most dependent on firm performance, high dividend or low dividend firms. The main focus of this study is therefore undoubtedly on the results of the multiple linear regression models. The authors have identified two separate samples that have been divided based on companies’ respective dividend yields and several regressions have been made. The first regression analyzed contains the high dividend yield sample where the constant (Stock Price) has been regressed against the two independent variables return on equity and gross profit margin as well as two control variables, long term debt and market value. Further, the dummy variables have been included in all regressions conducted.