IN
DEGREE PROJECT
ENVIRONMENTAL ENGINEERING,
SECOND CYCLE, 30 CREDITS
,
STOCKHOLM SWEDEN 2020
Assessment of Urban
Metabolism of Stockholm
Royal Seaport
Through the Enhanced Economy Wide Material
Flow Accounting Framework
SINA ABRISHAMI
KTH ROYAL INSTITUTE OF TECHNOLOGY
1
Assessment of Urban Metabolism of
Stockholm Royal Seaport
Through the Enhanced Economy Wide
Material Flow Accounting Framework
Sina Abrishami
Supervisor
Asterios Papageorgiou
Examiner
ASSOC.PROF.Dr. Miguel Brandão
Degree Project in Sustainable Technology KTH – Royal Institute of Technology School of Architecture and Build Environment
Department of Sustainable Development, Environmental Science and Engineering SE-100 44 Stockholm, Sweden
2
Preface
This thesis has been written as part of Master’s Programme Sustainable Technology in KTH Royal Institute of Technology, Sweden. The study has been developed for the year 2017 under research idea and supervision of Asterios Papageorgiou.
The idea was inspired by the Voskamp et al. (2017) case study in Amsterdam where the application of enhanced Economic Wide Material Flow Analysis (EW-MFA) has been explored. The objectives of the project are to study the full scope of the EW-MFA by extensive literature review, applying the enhanced EW-MFA including water and throughput flows to Stockholm Royal Seaport (SRS) and evaluate the method. Ultimately, the result is validated by comparing this thesis results with other urban areas and also strengths and weaknesses of the enhanced EW-MFA method are assessed for further development. This thesis project was performed individually with the assist of Asterios Papageorgiou. The bottom-up data has been used for this study by using former research available data considering their validity and reliability. The proper estimations and assumptions have been taken due to lack of an integrated database for SRS.
By adding water and throughput flows, this thesis added new concepts into EW-MFA method showing the necessity of these flows for the Urban Metabolism analysis because of their values. The evaluation of the EW-MFA method itself in this thesis also highlighted further opportunities for completing the method for small-scale urban areas.
Sina Abrishami
Stockholm, August 2020
3
Abstract
Material flows in Urban Metabolism play a key role for the purpose of building urban areas and growing the economy. There is lack of standard method for accounting of material flows within and across the boundaries of urban systems. This thesis aims to assess the Urban Metabolism of small-scale urban area through the application of the Economic Wide Material Flow Analysis and enhance the scope of the method by adding water flows, which could potentially become a basis for the development of the method in the future. First, the application of the Economic Wide Material Flow Analysis in urban areas was studied through a literature review and then the enhanced Economic Wide Material Flow Analysis was applied to Stockholm Royal Seaport using bottom-up data. Using bottom-up data resulted in detailed information, however, full comparison between urban areas was not possible due to data gaps. The results showed the importance of the method for enhancing Urban Metabolism analysis and amending resource management. Spotting available secondary and recycled resources in the socioeconomic system as a part of application of the method is beneficial to sustain the natural resources use. Since still the method is developing for small-scale urban areas, a mixture of this method and other recommended methods by having focus on data collection is suggested for integrating databases and comprehensive analysis.
Keywords
Urban Metabolism, Economic Wide Material Flow Analysis, Material Flow Analysis, Stockholm Royal Seaport, Circular Economy, Bottom-up data, Top-down data
4
Sammanfattning
Under de senaste decennierna har stadsområden expanderat snabbare än tidigare. Genom att öka
människors tendens att bo i stora städer kommer naturresurser att behövas för att tillgodose
stadsområdens växande behov. Materialflöden i stadsmetabolismen spelar en nyckelroll för att bygga
miljövänligt och växande ekonomin. Det saknas en standardmetod för redovisning av materialflöden
inom och över gränserna för stadssystem. Denna avhandling syftar till att utvärdera stadsmetabolismen
genom att använda tillämpning av bred ekonomisk materialflödesredovisning
och förbättra metodens omfattning genom att lägga till vatten- och genomströmningsflöden som
potentiellt kan bli bas för utvecklingen av metoden i framtiden. Först studerades tillämpningen av
ekonomiskt bred materialflödesredovisning i urbana områden genom litteraturöversikt och sedan
tillämpades den förbättrade analysen av ekonomiskt bred materialflöde på Norra Djurgårdsstaden med
hjälp av bottom-up data. Att använda bottom-up-data resulterade i detaljerad information, men fullständig
jämförelse mellan stadsområden var inte möjlig på grund av dataklyftan Resultaten visade vikten av
materialflödesredovisning för att förbättra urban metabolismanalys och ändra resurshantering. Att hitta
tillgängliga sekundära och återvunna resurser i det socioekonomiska systemet som en del av
tillämpningen av metoden är fördelaktigt för att upprätthålla användningen av naturresurser. Eftersom
metoden fortfarande utvecklas för småskaliga stadsområden föreslås en blandning av denna metod och
andra rekommenderade metoder såsom, livscykelbedömning, genom att fokusera på datainsamling för att
integrera databas och omfattande analys
.
5
Acknowledgements
I would like to express my sincere gratitude to my academic supervisor Asterios Papageorgiou at KTH for this valuable guidance and suggestions throughout the creation of this thesis.
I kindly thank Monika Olsson at KTH for guiding and inspiring me through my study from the beginning. And at last but not least, I would like to thank my family for their constant supports and encouragements.
6
Table of Contents
Preface
2
Abstract
3
Sammanfattning
4
Acknowledgements
5
Table of Contents
6
List of Tables
7
List of figures
7
Abbreviations
8
1. Introduction
9
1.1 Background & Problem description
9
1.2 Aim & Objectives
11
1.3 Scope & Limitation
11
2. Literature review
12
2.1 Urban Metabolism
12
2.2 Economy Wide Material Flow Analysis (EW-MFA)
13
2.3 EW-MFA Adapted to Urban Level
16
3. Method
18
3.1 The Enhanced EW-MFA Method
18
3.2 System boundaries definition
20
3.3 Data collection
21
3.4 Validation of the results
22
4. Results
23
4.1 Result from Modified EW-MFA for Stockholm Royal Seaport
23
4.2 Visualization of Material Flow in Stockholm Royal Seaport
28
5. Discussion
30
5.1 Discussion of the results
30
5.2 Validation of the results
32
5.3 Discussion of the method
33
5.4 Recommendations for improving the method
34
6. Conclusions
35
7. References
37
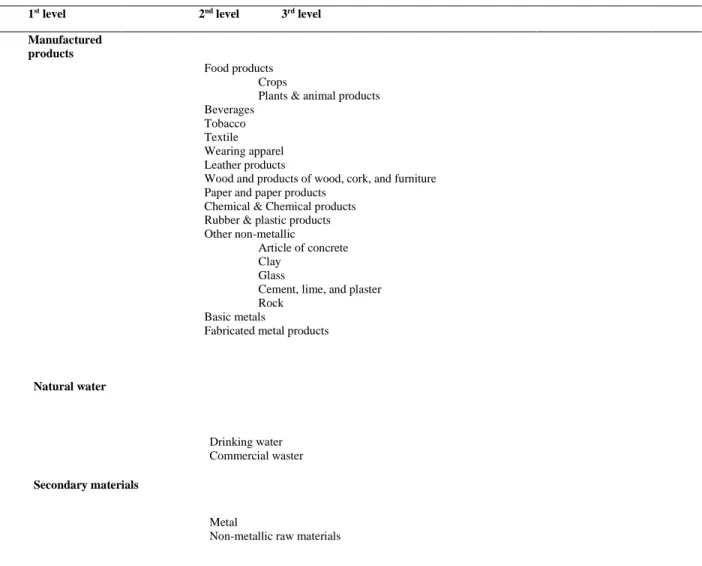
8. Appendix A: Material classification
44
7
List of Tables
Tables Page
Table 2.1. Material Flow Accounting indicators’ equations and explanation 15 Table 3.1. Apartment spreads in SRS including number of rooms 20 Table 3.2. Used sources for material flow data in the SRS in 2017 22
Table 4.1. Result from EW-MFA for SRS in 2017 23,24,25
Table 4.2. Result from enhanced EW-MFA for SRS in 2017 – Energy 26 Table 5.1 Eurostat EW-MFA results for SRS, Amsterdam, Vienna, and Hamburg 3
2
List of figures
Figures Page
Fig 2.1. The EW-MFA model, adapted from Eurostat (2001) and Barles (2009) 13 Fig.3.1. Material flows according to adapted Eurostat method including water
flows 19
Fig.3.2. Stockholm Royal Seaport area map (Spatial samples of this study
highlighted in the map) 20
Fig.4.1. Construction material flows in Norra1, Norra2, Brofästet and Västra (Tt
= 1000t) 28
8
Abbreviations
CE – Circular Economy
CPA – Statistical Classification of Products by Activity EU - European Union
EW-MFA – Economic Wide Material Flow Analysis GDP – Gross Domestic Production
GHG – Green House Gases GSI – Green Space Index
ICT – Information and Communication Technologies LCA – Life Cycle Assessment
MFA – Material Flow Analysis
MFCA - Material Flow Cost Accounting MSW – Municipal Solid Waste
NACE – Statistical classification of economic activities in the European Community NBS – Nature-based solutions
PIOT – Physical Input Output Table
SCB – Statistical centalbyrån (Statistics Sweden) SDA - Structural Decomposition Analysis
SEEA – System of Integrated Environmental and Economic Accounting SRS – Stockholm Royal Seaport
9
1. Introduction
1.1 Background & Problem description
The world population is growing faster than before, and anticipations shows a 50% of population growth in urban areas by 2030. The Swedish population is anticipated to increase more than one million over the next 10 years from 2018. Statistic in Sweden (SCB) shows an increase in Stockholm population between 70,000 to 80,000 persons per year (SCB, 2018). Studying Urban Metabolism (UM) helps to understand the impact of growing urban areas on increasing natural resources scarcity. UM analysis started more than 50 years ago when the first study of UM was done by Wolman (1965) inspired by solving New York city’s drinking water and waste handling problems. Following by studies in the 1970s in Tokyo, Brussel, and Hong Kong focused on improving understanding of UM in different sectors such as energy, industry, and natural industry (Kennedy, et al., 2010). The more UM studies were performed recently, the more the importance of resource management in urban areas was revealed. Strategic sustainable resource
management enhance the economy, society, and natural environmental relationships in local, national, and international scales.
Urban areas transform resources that are being extracted locally or imported from external areas for developing the urban built environment and ultimately release emissions and waste to the natural
environment (Decker, et al., 2000). Lack of a standard methodology for assessing material flows has been caused applying scattered methods used for assessing material flows in different studies. Eurostat
introduced most common used material flow analysis method that has been used by multiple research using available database for national level. In recent years, application of the method was assessed for urban areas considering adapted data originated from national database or bottom-up data collection (Brwone, et al., 2011; Horta, et al., 2017; Bahers, et al., 2019).
The Economy Wide Material Flow Accounting (EW-MFA) is an advanced material flow analysis method for accounting of material flows entering, accumulating in stock, and exiting a socioeconomic system. It considers the socioeconomic system as a ‘’black box’’ where all focus is on imports, stocks, and exports, excluding internal flows. Even though the EW-MFA method has been developed for accounting of
material flows at the national level, it has been also adapted for analyzing material flows in different cities (e.g. Amsterdam, Lisbon, and Vienna) (Krausman, et al., 2017; Voskamp, et al., 2017; Barles, et al.,2010). Over the years, the adapted EW-MFA has been further developed by collecting and including more detailed information into it. It was recently enhanced by adding throughput and water flows into the analysis considering modified material classification (less aggregate) for the city of Amsterdam (Voskamp, et al., 2017). Including throughput flows, drinking water and wastewater flows provided not only more detailed findings, but also a deeper understanding of UM. Application of this method considering bottom-up data, which is assumed to be more reliable and relatable data for small urban areas (Papageorgiou, et al., 2019) can provide enhanced insight for deeper and more comprehensive material flow analysis. The result of the enhanced EW-MFA method can be beneficial for keeping materials for longer period of time. In newly build urban areas, such as the Stockholm Royal Seaport (SRS) recycling and reusing of waste materials is prioritized than the linear economy approach (take-make-dispose), which contributes to over production and accelerating the release of Greenhouse Gas (GHG) emissions. Dematerialization through amending resource management faces challenges that need to be addressed by using
10 opportunities such as minimizing waste production, increase resource efficiency and productivity (Mayer, et al., 2019). Lack of a standard EW-MFA method for assessing small-scale urban area such as SRS, initiated the idea of possibility of performing the enhanced EW-MFA considering water, air and internal flows. This method enables not only the monitoring of stock changes through material input and outputs, but also improve resource management by highlighting the most resource demanded sectors and
responsible for generating waste and emissions to air.
The idea of making a vibrant city, providing a mixture of residential, commercial, and service spaces considering resource efficiency, and being climate responsible started by the Stockholm municipality in Hammarby Sjöstad and continued to the SRS project located at the north-eastern Stockholm. First projects were started in Loudden and Värtahamnen located in the south part of SRS and were continued up north in the residential areas in recent years.
Some of general sustainability goals in the area can be mentioned as saving flora and fauna and its cultural heritage (assessing increasing population impact on origin land utilization), reducing GHG emissions by replacing fossil fuel with renewable energies and targeting fossil fuel free city by 2030. Sustainability goals have been set for not only being fossil fuel free, but also working on energy substitution and human activities adapted to the new system in different sectors from energy, waste, transportation, and water for making more extensive environmental plans for the future. Because of sustainable building environment in SRS, it is estimated that total CO2 emission reductions for
SRS-standard scenario is about 30,000 tonnes CO2e/year (-60%) and for the progressive scenario 40,000
tonnes CO2e/year (-80%) by 2030 (Shahrokni, et al., 2015).
Ecological goals in SRS has been established by lowering the use of energy, water, material, and natural resources, and also the sustainable use of energy considering the eco-cycle solutions. For instance, new buildings and transportation system in the area corresponding to the CO2 emission reductions and saving
natural resources. Taking internal material and water flows into consideration in order to maximize secondary sources use within the socioeconomic system is crucial for sustainable resource management in the district (Holmstedt, 2018).
In order to meet the SRS sustainability goals, we need to analyze the material flows from entering to the socioeconomic system, adding to the stock, and exiting the system in order to identify hotspots in resource consumption and provide information that could support the optimization of resource management in the district. The enhanced EW-MFA method could be applied for this task in order to identify sectors with the most resource needs and responsible for the most waste and emission
generations. However, the EW-MFA method has not been applied to a small-scale urban area before and its strengths and weaknesses for this type of assessment have not been assessed. Hence, this thesis aims to address two problems. First, the lack of knowledge about the UM of SRS which is necessary in order to improve the resource management in the district and ultimately enhance its sustainability. Second, the lack of knowledge about the potential of the EW-MFA for assessing the UM of small-scale urban areas.
11
1.2 Aim & Objectives
The aim of this project is to assess the UM of SRS district applying the enhanced EW-MFA framework. By performing the enhanced EW-MFA, the characteristics of SRS UM and their impacts on material flows will be explained. Ultimately, all gathered information will be used to bring suggestions for amending the resource management in the SRS and also enhancing the method in the future.
The objectives of the thesis are:
▪ To review the full scope of EW-MFA method and identify its applications in an urban context ▪ To apply the EW-MFA in the SRS
▪ To analyze and validate the results and evaluate the strengths and weaknesses of the EW-MFA method
1.3 Scope & Limitation
The study of UM can be performed with different methods and tools. In this thesis, the focus is on enhanced EW-MFA considering internal flows for deeper understanding of UM. EW-MFA results is known to be influenced by using a method for collecting data, therefore enhanced EW-MFA has been chosen for reducing inaccuracy of detailed data (Patrício, et al., 2015). The EW-MFA method and its application for urban areas was studied through an extensive literature review, then supplementary information regarding enhanced EW-MFA method was reviewed. The main activities that are considered within the system boundaries are: construction sector, transportation, energy supply chain, as well as waste collection sector.
This method highlights hotspots within the system. However, application of LCA would be needed for achieving comprehensive analysis of each material and product through their life span that ultimately result in better material selection and amending resource management towards sustainability.
Data limitation were planned to be mitigated by an extensive literature review (top-down and bottom-up data collection), and due to data reliability and validity gap, bottom-up data were preferred. A small-scale urban area is considered for this study, which eliminates activities that are included in the study of big cities such as ‘’mining and agriculture’’. The year of 2017 is taken as temporal sample due to data, reports, and literature availability, which made it easier for the analysis process. This Master thesis was performed individually with taking available bottom-up data as a basis of estimation process.
12
2. Literature review
2.1 Urban Metabolism
The UM is similar to a biological organism’s metabolism regarding consuming the natural resources and producing waste in different periods of time. A biological organism is capable to utilize energy to
transform materials into new shape and forms and also to release wastes and material residues, with the difference from UM that a biological organism is also able to reproduction of its own kind (Graedel & Allenby, 2010, p.42). Materials, products, and services in urban areas are demanded by expanding urban areas, and they are combined with lots of human pressures on the environment such as uncontrolled emissions, resource depletion and waste production. While each city needs materials for its development in different sectors, it is important to supply for needs considering planetary boundaries and natural ecosystem protection (Rockström, et al., 2009). This approach does not mean limiting the city’s demands, but affording livability including the human requirement for social amenity, health, and well-being without compromising the natural environement (Newman, 1999).
A holistic assessment approach is required to define the metabolism of urban areas and their connections to environmental boundaries in local and global scales. The study of UM can cover different aspects of life such as livability, employment, education, accessibility to resources, and resource flows and stocks. MFA is counted as an important method to identify urban current and future material needs in order to design better resource management considering urban transformation towards enhancing quality of life without destroying the nature and compromising the ability of future generations to meet their own needs (Browne, et al., 2009; Brundtland, 1987).
Increasing economic wealth and technology provide opportunities for developing cities. As cities become larger, more natural resource will be needed. Different models and methods are deployed to assess urban development pressure on the natural environment by focusing on energy and material flows and their interaction with environment. For instance, Browne, et al. (2010) explained the natural energy and material balance through the first law of thermodynamic ( all raw input materials ultimately will end up in waste and it is just a matter of time) to show the material flows in the Irish city (Limerick city) from 1996 to 2002. Application of the EW-MFA provides a holistic assessment of each city’s resource consumption and waste production model considering their relationships with regional and global hinterlands focusing on imports and exports (Niza, et al., 2010; Browne, et al., 2011). For instance, Bahers, et al. (2019) used application of EW-MFA for a smaller spatial paradigm (city of Rennes and Le Mans) in France, and the result of the study provided a better picture of intermediate city relationships with their hinterlands for supply chain, material distribution, and waste management.
13
2.2 Economy Wide Material Flow Analysis (EW-MFA)
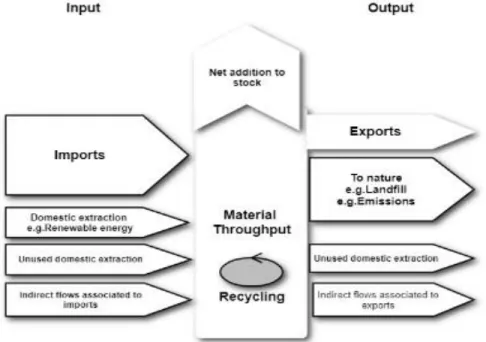
EW-MFA aims to analyze material exchanges between a national economy and the natural environment, as well as national economy and other countries’ economy (Eurostat, 2013). This method uses the mass balance approach to account inputs (domestic extraction and imports), changes to stocks, and outputs (exports, waste, and emission to nature). It may account unused domestic extraction and indirect flows related to imports and exports considering available data. Material flows refers to all-natural resources either extracted locally or imported to the socioeconomic system as inputs and all materials exports from the current system to other socioeconomic system or the natural environment. EW-MFA assess import and exports flows excluding internal flows emphasizing on city’s economic relationships and its dependency on external resources outside the socioeconomic boundary. This method emphasizes on socioeconomic factors to determine resource use pattern and material exchanges in different scales (e.g. nationally or internationally).
Fig 2.1. The EW-MFA model, adapted from Eurostat (2001) and Barles (2009)
National economic accounting shows how labor, capital and natural resources are used to provide products and services fulfilling the city’s requirements in different sectors such as agriculture, clothing, built environment, industries, food etc. Assessing material flows through the socioeconomic system shows the process of turning natural resources like water, land, energy, etc. into emissions to air, waste, sludge, etc. Moll & Watson, 2009). Mass balance is recommended for monitoring the material flow in EW-MFA considering inputs, addition to stock, outputs, and indirect flows and unused domestic extractions.
14 Indicators can be derived from EW-MFA based accounts. Bringezu, et al. (2003) explains each EW-MFA indicator as below:
Inputs
o Domestic Extraction (DE): Natural materials and sources extracted and harvested within the investigated economical territory and usually the use of these materials has monetary values such as construction minerals (sand, gravel, and crushed stone etc.).
o Unused Domestic Extraction: Refers to all extracted materials in the local area that do not enter the economic system.
o Imports: Raw, semi-manufactured and finished products and materials entered the investigated socioeconomic area from the rest of the world internationally and nationally.
o Indirect Flows Associated with Imports: Upstream material input flows refers to materials
extracted and harvested in the rest of the world and required to produce imported materials (used and unused needs to be considered).
Stocks
o Material Accumulation (Net Addition to Stock): Accumulation of materials within the socio-economic system such as buildings, infrastructure, goods etc.
Outputs
o Domestic Proceed Output (DPO): All materials that leave the economic system and enter the domestic environment originating from consumption and production such as waste, used materials and emissions.
o Disposal of Unused Domestic Extraction: Disposal of domestic material locally extracted into the domestic natural environment.
o Exports: Raw, semi-manufactured and finished products and materials exported to the rest of the world.
o Indirect Flows Associated with Exports: Upstream material input flows required to produce export product.
15 The relationships between the abovementioned indicators are explained by the mass balance approach in Table 2.1.:
Table 2.1. Material Flow Accounting indicators’ equations and explanation
MFA Indicators Equation / Explanation
Socio-economic system
Direct material input Domestic extraction (DE)+Imports Domestic material
consumption (DMC)
DE +Imports-Exports
Total material requirement (TMR)
DE +Unused domestic extraction +Import +Unused extraction in country of origin
Total material consumption (TMC)
TMR- Exports-unused extraction of exports
Processed material PM DMC +Secondary materials
Net Addition to Stock (NAS) DMI- (Exports +DPO)
To environmental system
Domestic processed output (DPO)
Emissions to air, landfilled wastes from economic activities and households, sludge from wastewater treatment
Exports Sent materials to the outside of socio-economic boundary
Disposal of unused domestic extraction
Note: Unused materials = waste and residual from natural resource extraction that never entered the national economic system and went
straight to the disposal sector after the extraction process; Indirect material ‘’hidden flows’’= Indicate all needed materials along with manufacturing processes
16
2.3 EW-MFA Adapted to Urban Level
EW-MFA in urban areas provides the detail material flow information corresponding to grow the economy without limit the future needs and disturbing the natural ecosystem (Hammer, et al., 2003). In contrast with EW-MFA at national level, there is no standardized methodology for conducting MFA in urban level (Niza, et al., 2009).Application of adapted method from national to urban scale can be performed by disaggregating material flows using proxy factors such as population, occupied households, and number of workers (Browne, et al., 2011). The adapted EW-MFA shows similarities with the original method, while internal material circulation within the system is excluded from the analysis.
Each city shares unique features and material flow patterns. The EW-MFA at the urban level helps to define these characteristics by monitoring material flows and compare them with other urban areas. For example, a comparison of the Economy Wide Material Flow Accounts of three metropolitan areas in Sweden (Stockholm, Gothenburg, and Malmo) highlights the importance of the method for recognizing each city’s economic characterization. Their characteristics are recognized as Stockholm (Consumer-service based), Gothenburg (Industrial based) and Malmo (Service based). These characterizations also explain the reason behind each city’s resource management strategy such as absorbing workers, investing on industrial parts, advancing the technology, etc. (Rosado, et al., 2017; Kalmykova, et al., 2015). Each unique UM can also lead the material flows. This metabolism can be temporary, like newly build urban areas in China that caused increase in Total Material Requirement (TMR), or permanent like being dependent to the external resources for supplying required raw materials or processing generated wastes (Barles, et al., 2019; Schandl & Miatto, 2018).
Each material contribution to economic growth can be evaluated by calculating each material share in Gross Domestic Production (GDP). This information also shows to what extent the economy depends on the specific type of material. For example, a case study in Lisbon highlighted the economy’s growth dependency to imported fossil fuel over the years (Kovanda, et al., 2012).
Physical exchanges of materials make alteration in accumulation of materials in stock in different sectors. Analyzing of the material accumulation process provides information such as lack of resources, energy demands of moving mass or percentage of specific mass flow and ecosystem disturbances, etc. (Fischer, et al., 2011). A study in the Lisbon metropolitan area performed EW-MFA considering less aggregate
classification including each material’s life cycle and impact on the dynamic of in-use stocks. Evaluating the dynamics of material stocks over different periods of time highlights the strengths and weaknesses of resource management (Rosado, et al., 2014; Liu, et al., 2020). For example, construction activities transform and modify dynamics of stocks (e.g. extracting raw materials, preparing the land, energy and water consumption, maintenance, demolition). Acknowledging these activities in detail can amend resource management (e.g. using materials with low content, reducing waste generation by sharing surplus with other projects, downscaling bulky materials by reusing them as raw materials) (Schiller, et al., 2017; Migliore, et al., 2020; Wang, et al., 2020).
Studying the application of EW-MFA for UM in different cities provides important information for evaluating the natural resource values properly (e.g. shifting linear production to circular by dematerialization, decarbonization, and closing the material loop within the socioeconomic system) (Barles, 2010). Material specification such as intensity, efficiency, productivity, reusability, and
17 al., 2010). Enhancing the knowledge of each material specification through application of EW-MFA is beneficial for the dematerialization process by extending material consumption cycle by recycling and using them as secondary and recycled materials in a supply chain (Wiedenhofer, et al., 2019).
Performing EW-MFA brings attention to CE (Mayer, et al., 2019). CE is considering economic growth and environmental protection in parallel by prioritizing recycling, reusing, and reducing than disposal
activities that contribute to vast environmental impact reductions (Krausmann, et al., 2017; Virtanen, et al., 2019). Considering natural ecosystems as a model in different sectors improve the material flow circularity. For instance, Nature-based Solutions (NBS) has focus on symbiosis with natural environment by designing and building the urban environment matching the nature around it (Pearlmutter, et al., 2020).
Coupling EW-MFA with other environmental decision-making tools is beneficial to involve other
materials’ specifications into the analysis and provide more comprehensive results. For instance, coupling EW-MFA with Material Flow Cost Accounting (MFCA) provides detailed holistic information about each material specifications (e.g. including monetary value is equally important as physical values since the extraction and production process might increase or lower the economic and environmental costs of materials, products, and services )(Kovanda, 2019). These detailed databases for each material ultimately result in upgrading former environmental directives and policies towards sustainability.
18
3. Method
3.1 The Enhanced EW-MFA Method
The lack of standardized and comprehensive EW-MFA method and resource classifications for UM studies required the improvement of the method. Voskamp, et al. (2017) enhanced the EW-MFA method considering less aggregate material classification, and also adding throughput, drinking water and wastewater flow into the analysis. Through this approach, Voskamp provided a more comprehensive and in-detailed information for material flows.
Like other materials, water also can be influenced by the UM. A study of the Korean urban areas (Seoul, Ulsan and Jeju) shows that the city’s characteristics impact on the type of water consumption (e.g. Jeju had the highest ground water intensity use because of their intensive agriculture structure) (Jeong, et al., 2020). Assessing water and wastewater flows from their cradle (river, ground, and precipitation) to grave (energy recovery, purification, release to the sea) is vital for enhancing water management (Wendling & Holt, 2020). Enhanced EW-MFA is set to add water and wastewater flows data considering not only storm, rain, and purified water, but also water and wastewater flows from restaurants and commercial areas into the analysis.
There are modifications that were added into method such as including drinking and wastewater flow since they are counted as one of the highest material requirement in each city and it is important to quantify the absorbing water from different resources and water consumption and recycled water within and outside the socioeconomic system. Stormwater and rainwater are two of the main water resources in each city that were considered for this study. Throughput flows, which in previous EW-MFA were excluded, also was considered in the enhanced EW-MFA. Therefore, in this study recovered materials, locally extracted renewable energy and water flows were considered as the most important internal flows with available data and thus they are added into analysis. Moreover, it provides key information for dematerialization and the CE process within the socioeconomic system.
Rosado, et al. (2014) and some other studies analyzed waste categories in detail considering the type of waste and waste treatment for each type. It is important to track the origin and end point of each type of waste to enhance understanding of the waste management in the area. With new material classification (less aggregate), more detailed data are available that resulted in more extensive analysis of the types of material and allowed the comparison of the results with other urban areas.
Adding waste flow and emissions to the nature to the classification not only provided applied information about throughput material flows, but also helped to complete and validate mass balance of materials. For instance, category ‘’fossil fuel and fossil fuel products’’ outputs are estimated based on CO2 emissions
19 The following Sankey diagram shows modified Eurostat material flows method including water,
wastewater, and throughput flows inspired by Voskamp, et al. (2017). The difference between this resource flow and EW-MFA method is adding water and internal flows such as renewable energies into the analysis of local extraction. Furthermore, waste and emission to nature are also being mentioned in detail. In the original enhanced EW-MFA method by Voskamp, et al. (2017), unused local extraction and indirect flows were also mentioned, but because of data scarcity in SRS, these flows could not be defined and separated from other flows so they are excluded from the final result table.
20
3.2 System boundaries definition
Defining system boundaries is important as it confines the area of research to desired spatial and
temporal boundaries. Closing the boundaries regarding location and time reduces the complexity of urban metabolism analysis. The thesis project is performed in the completed areas of SRS till 2017. These areas are Västra, Norra 1, Norra2 and Brodfästet and are highlighted in Figure 3.2.
Fig.3.2. Stockholm Royal Seaport area map (Spatial samples of this study highlighted in the map)
The following table shows completed apartments spread for estimating residential occupied area in 2017: Table 3.1. Apartment spreads in SRS including number of rooms
1 room 2 rooms 3 rooms 4 rooms 5 rooms
SRS Sustainability
Report till 2017 315 units 785 units 762 units 585 units 78 units
Of total 12% 31% 30% 23% 3%
Note: Estimation of size and numbers of apartments in SRS, average size for one room unit is around (27 m2), two rooms (44 m2), three rooms (74 m2), four rooms (120 m2), five rooms (150 m2), six rooms (300 m2)
21 The spatial sample of this study was estimated based on occupied area in SRS in 2017. The size of
households and commercial areas is estimated using data from Statistics in Sweden (SCB) and SRS Sustainability reports (2017). In total, around 183325m2 are occupied by household areas (2 525 units)
and 20 500 m2 are occupied by commercial areas (Total 203825 m2). Population is estimated 4 800
residents considering 1.9 residents per dwelling (SRS roadmap, 2017). Most of data are modified considering proper proxy factors such as population and occupied apartments and area. Each material ratio is used to fill the data gap for materials with similar functionality such as cement and concrete in construction sector. According to mass balance principle, materials cannot be created nor destroyed within the urban system, therefore all input materials into the system equal all outputs over the same period plus the stock changes in the system. Mass balance is used for estimating materials inputs and outputs.
3.3 Data collection
Data was collected from available data sources with proper modifications considering the case study’s spatial and temporal boundaries. In the Table 3.2, the data sources are described, considering their type of data and year mentioned specifically. Most of the data extracted or adapted to 2017. Moreover, bottom-up data preferred to top-down data due to its higher accuracy. The modifications that were made in this study are described next.
The modified material classification was inspired by methods taken from different studies and Statistical Classification of Products by Activity (CPA) (2nd level) (Rosado, et al., 2014; Browne, et al., 2011; Niza, et
al., 2009). In case of data availability, the (3rd level) of CPA was also considered to provide more detailed
information (e.g. ‘’non-metallic minerals’’ has been described for available material data such as cement, clay and glass and the rest is considered as ‘’other non-metallic minerals’’) (see Appendix A). This
material classification approach leads data collection to selecting detailed bottom-up data considering this study system boundaries.
Including drinking water and wastewater flows based on data source and estimation of each sector’s fresh water consumption and wastewater production was performed. Stormwater and surface water data also was available and was added into data collection.
Waste materials were sent to the outside the SRS district for the further treatment process, except recovered materials that were used as recycled resources, such as excavated materials in construction sector. Excavated materials are mentioned in internal flows and are considered as recycled resources, the mass balance principle has been used for estimating construction waste considering 2% of material inputs became waste and the rest accumulated in the stock or shared with ongoing construction projects.
Data for recovered and landfilled materials was collected from different construction activities in the area. Construction waste materials from open public place construction were divided considering reported data from Stockholm Stad (2017) (77.41% material recovery,12.79% landfill, 9.08% energy recovery and 0.72% reuse) (see Appendix B)
Energy needed for the district heating and cooling and electricity was taken based on standard data from SRS roadmap (2017) (see Appendix B). Then the proper modification for energy resource fractions are considered (Exergi Sustainability report, 2017), and further energy consumption forecast in the district was discussed (see Appendix B). Fuel consumption for transportation is estimated based on available data
22 from Swedish Transport Analysis (Trafikanalys) and Swedish Traffic Agency (Trafiksverket). Units were also is normalized based on validated and reliable sources.
Detailed emissions data was available for energy plants located in the area (Värtaverket and Giggen) from Naturvardsverket (2017) and also Statistics yearbook for Stockholm (2019). CO2 emissions are calculated
considering energy production, transportation, good and services and maintenance, in addition to the amount of CO2 saved from recycling waste. CO2 emissions data was taken from the SRS roadmap
standard because of its accuracy and reliability of data compared to other data sources (Stad, S., 2017). While for emissions that no other data was available like Dinitrogen oxide (N2O,) Nitrogen Oxide (NOx)
and Sulphur Oxide (SOx), the Naturvardserket data was adjusted and used. Waste treatment process also released GHG emissions and at the same time provided emission savings, and both amounts were considered in the calculation process.
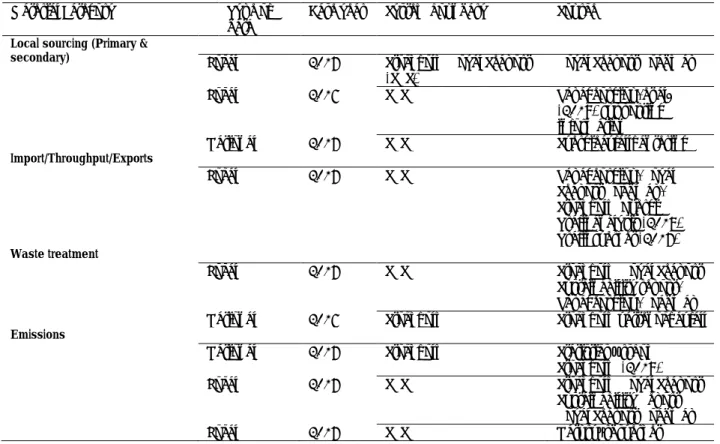
Table 3.2. Used sources for material flow data in the SRS in 2017
Material Category Type of
data Base year System boundary Source
Local sourcing (Primary &
secondary) Local 2017 Stockholm Royal Seaport
(SRS) Royal Seaport Roadmap Local 2016 SRS Papageorgiou, et al.
(2019) supporting information
National 2017 SRS Svergieavfallhantering
Import/Throughput/Exports
Local 2017 SRS Papageorgiou, Royal Seaport Roadmap, Stockholm Exergi Trafikanalysis (2018) Trafiksverket (2017)
Waste treatment
Local 2017 SRS Stockholm Royal Seaport Sustainability report, Papageorgiou, Roadmap National 2016 Stockholm Stockholmvattenochavfall
Emissions
National 2017 Stockholm Statistics Årsbok Stockholm (2019) Local 2017 SRS Stockholm Royal Seaport
Sustainability Report Royal Seaport Roadmap Local 2017 SRS Naturvärdsverket
3.4 Validation of the results
Because of lack of comparable data for other urban areas, results from this study aggregate and units normalized to being able to compare with other urban areas. For instance, GDP was found in million SEK per capita from official statistics in Sweden (Sveriges officiella statistik, 2018) for Stockholm, the proper modification based on SRS population and currency exchange rate to million Euro was done in order to normalize the SRS GDP unit to be comparable with other urban areas. Values for Amsterdam, Vienna, and Hamburg was extracted from Voskamp, et al. (2017).
23
4. Results
4.1 Result from Modified EW-MFA for Stockholm Royal Seaport
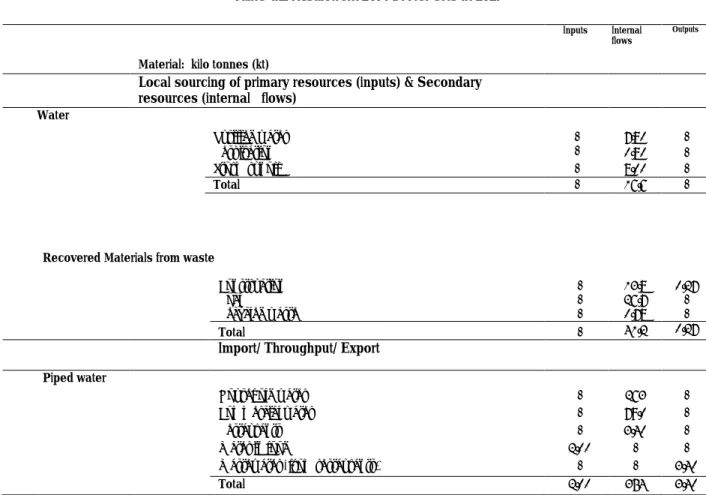
The result from the application of the modified EW-MFA to SRS are presented in Table 4.1. Almost all needed material was imported from external resources (national and international) except renewable energies such as solar energy, energy produced by local power plants, and recycled water and construction materials. Just around 58 kt (kilotonne) construction materials such as rock, gravel, metal and 3.6 GWh (Gigawatt hours) energy are estimated to be reused and recovered from demolition, excavation activities, and biogas production.
Table 4.1. Result from EW-MFA for SRS in 2017
Inputs Internal flows
Outputs
Material: kilo tonnes (kt)
Local sourcing of primary resources (inputs) & Secondary resources (internal flows)
Water Purified water - - 7.80 - Respiration 0.80 - Storm runoff - 8.00 - Total - 16.6 -
Recovered Materials from waste
Construction - 13.8 0.27
Rock - 26.7 -
Recycled waste - 0.78 -
Total - 41.2 0.27
Import/ Throughput/ Export
Piped water
Household water - 263 -
Commercial water - 79.0 -
Restaurants - 3.40 -
Water in food 2.00 - -
Wastewater (from restaurants) - - 3.40
24 Table 4.1 (continued).
Import/ Throughput/ Export Inputs Internal
flows Outputs
Non-metallic minerals
Article of concrete 275 - 7.00
Glass 0.23 - 0.004
Clay 2.30 - 0.05
Cement, lime, and plaster 8.70 - 0.18
Other non-metallic 23.0 - 0.46
Total 309.2 - 7.69
Biomass & biomass products
Crops 0.88 - -
Plants & animal products 2.59 - -
Other food 0.10 - -
Beverage 0.64 - -
Textile & wearing apparel 0.10 - -
Wood, cork & rubber 0.05 - -
Paper & board 0.44 - -
Total 4.80 - -
Ores & industrial minerals
Metallic manufacture products 13.1 - 0.26
Metal ores 3.34 - 0.06
Other fabricated metal products 0.14 - 0.002
Total 16.58 - 0.32
Fossil fuel & fossil fuel products Asphalt 12.44 - - Plastic products 6.60 - - Total 19.04 - - Chemical products Chemical products 1.83 - - Total 1.83 - - Other industry products Other goods 0.10 - - Total 0.10 - - Waste
Rock and shaft (recycled) - - 18.0
Metal recycled - - 1.80
Hazardous waste (landfill) - - 0.37
Total - - 20.2
Local waste treatment
Municipal solid waste Household waste - - 0.54 Commercial waste - - 0.10 Commercial waste(powerplants) - - 0.45 Chemical waste - - 0.02
Construction waste (landfilled) - - 4.53
25 Table 4.1. (continued).
The mass balance principle has been used for estimating outputs. Because of volume of ongoing
construction activities in the area only 2 % of construction material inputs was considered as outputs and the rest was considered to be added to the stock. Waste materials either exited the SRS for further treatment processes or recovered within the system. ‘’biomass & biomass products’’ outputs were
expected to be counted in municipal solid waste, but no disaggregated data was available for each fraction. In total 351.58 kt inputs and 56.9 kt outputs excluding water flow and energy has calculated and following the mass balance principle 84 % of materials has been added to the stock.
By including water flows into analysis, a significant amount of material is added to the result which shows the importance of water flows in the EW-MFA (31% of whole input materials). 1034 liters of water are consumed by each restaurant per day, and 140.4 liters of wastewater per person are produced from households (equivalent to 263 kt total wastewater per year). Including these water flows into the analysis shows not only water consumption and wastewater production levels in the area, but also reveals the strategic plans for recycling water by removing pollutants from storm run offs and using them through waste-to-energy process for the energy recovery purpose. The SRS district is planned based on strategic plans to maximize rain and storm water capture rate and recycling water, such as implementing
technologies such as Green Space Index (GSI), vacuum collection system and structured tree with biochar (see Appendix B). Wastewater in the sewage system from household and restaurants is sent to the power plant for energy recovery and wastewater procurement site for purification purposes. It is estimated that more than 90 % of wastewater is recycled or processed for energy recovery in the area.
One of the biggest material consumers is the construction sector because of the construction of buildings and roads, and the open area project completion process. 90% of disposed materials in this sector is expected to be reused, recovered, and recycled depending on material durability in the system. In the construction sector, considerable amounts of material were excavated or demolished, and the goal is reusing and recycling them as much as possible. From Stockholm Royal Seaport Sustainability Report
Waste room - - 1.35
Mixed waste - - 1.90
Recycled - - 0.35
Dry matter of wastewater - - 1.20
Total - - 10.6
Flow to nature
Emission to air
Carbon dioxide (CO2) total (Residential) - - 10.5
CO2 total (Construction) - - 7.00
Nitrous oxide (Nox) - - 0.24
Dinitrogen oxide (N2O,) - - 0.11
Sulphur dioxide (Sox) - - 0.05
CL2, HCL inorganic - - 0.01
Ammonia (NH3) - - 0.0006
Dust - - 0.001
26 2017 (Stockholm Stad, 2017) it was found that 13 kt out of 50 kt construction waste are recycled
considering construction waste from open public places, and also 26 kt rock is reused in Norra2 (see Appendix B). The category ‘’non-metallic mineral’’ such as concrete, cement, concrete blocks include 76% of whole material inputs showing the importance of alterative renewable materials replacement instead of conventional materials in the construction sector in order to ultimately reduce material input mass in this sector.
Reused and recovery material and energy from construction waste and disposal is higher than landfill, but still because of the high volume of waste in this sector landfilled materials added 4.5 kt (12.79% of total disposed waste) to the municipal solid waste outputs (see Appendix B). Recycled construction materials (rock, shaft, and metal) are considered as output materials since the closest waste treatment site located outside the SRS district. While these materials and other recovered materials are assumed to be estimated and included in the recovered construction materials by adding throughput flows into analysis.
Table 4.2. represent energy flows regarding amounts of reported renewable energy resources and recovered energies in the area, plus energy that were consumed in transportation and supplying energy process in a form of fossil fuels.
Table 4.2 Result from enhanced EW-MFA for SRS in 2017 – Energy
Produced energy from renewable sources such as waste and biofuel were increased compared to reduction in fossil fuel consumption, announced by Stockholm Exergi and Statistical yearbook for Stockholm (2019)
Inputs Internal
flows Outputs Energy: GWh
Local sourcing of primary resources (inputs) & Secondary resources (internal flows)
Renewable Energy -
Solar energy - 0.40 -
Thermal - 1.20 -
Solid & Liquid fuel - 5.10 -
Waste fuel - 4.90 -
Total - 11.6 -
Recovered Materials & energy from waste
Energy recovery from households - 1.00 -
Energy recovery from construction waste - 3.20 -
Biological recovery - 0.36 -
Biogas combustion - 0.12 -
Total - 4.68 -
Import/ Throughput/ Export
Fossil fuel
Gasoline - 0.07 -
Diesel - 0.03 -
Energy supply - 0.12 -
27 (see Appendix B). Energy for heating and cooling and electricity were supplied mostly from renewable resources. More than half of the energy are supplied from ‘’solid & liquid biofuel’’ and ‘’waste fuel’’ by 66%, while ‘’fossil fuel’’ was used as an energy supply by 11%. High material needs in construction sector caused increase in energy recovery from disposed waste. Only in public open space construction, it was estimated that 9% of the disposed materials were used for energy recovery (3.2 GWh). However, this amount was reported higher in Norra 2 and Västra compared to the public open space (Stockholm Stad, 2017).
Estimated CO2 emissions for residential area are emissions from energy, transportation, goods and
services, and maintenance. Previous studies show that total construction waste is reduced by 40% in 2017 compared to its previous year, something that indicates progress in controlling waste production (SRS Sustainability Report, 2017). However, CO2 emissions from construction activities considering concrete,
steel, and asphalt in Norra 1 are two times higher than energy recovery from the same sector. Another construction activity with high material demands is building roads (e.g. asphalt and fuel). Reduction in CO2 emissions from building roads and maintenance activities in the area compared with its baseline
figures is considerable. Strategic plans such as energy efficiency, renewable fuel substitution, and amending supply and logistics were influential to reduce transportation related emissions in the district (SRS roadmap, 2017).
GHG emissions emitted from power plants located in the area (Värtaverket & Giggen) stood at the highest by 1903 kt. GHG emissions are also measured for the completed residential area (10 kt) and construction area (7 kt) in 2017 (SRS sustainability report, 2017; SRS roadmap, 2017). Emissions were estimated considering baseline emissions from buildings and infrastructure (including heating, cooling and electricity and biogas), transportation, maintenance and goods and services and waste management, which they shared GHG emissions from the highest to lowest, respectively.
In the households, waste strategy is to sort the waste as much as possible by providing sorting waste guidelines for residents and facilitating area with accessible waste room near each building, therefore waste were produced 27 kg less per apartment compared to 2016 (SRS sustainability report, 2017). New in-sink grinder installed in all household and restaurants’ kitchen connected to vacuum collection system cause massive reductions in food waste accumulation in waste room and increasing energy recovery (see Appendix B). For instance, 65% of household waste is recycled (0.35 kt out of 0.54 kt) considering metals, glass and collection of paper, plastics, and street litter by vacuum system. Mixed waste is estimated higher compared to other waste fractions found in the waste room such as packaging, glass, paper, metal. etc. that are described as waste room in the result table. This difference shows the importance of clarifying mixed waste fractions for sorting and treating them properly. Since, the closest waste treatment site is located outside the socioeconomic system boundary, all wastes are considered to be exported outside the socioeconomic system, except those used for energy recovery by local power plants. 96% of waste is recycled or used for energy recovery and the rest is sent for disposal and landfill process (Exergi Sustainability report, 2017).
28
4.2 Visualization of Material Flow in Stockholm Royal Seaport
The information from the result table supported the creation of the Sankey diagram shown in Figure 4.1. which depicts the construction material flows in SRS. The difference between inputs and outputs is expected to accumulate in the system (314,34 kt). The category ‘’article of concrete’’ includes considerable part of ‘’non-metallic minerals’’ followed by ‘’other non-metallic minerals’’ and ‘’cement’’, lime’’, and ‘’plaster’’. The category ‘’other non-metallic minerals’’ is mentioned aggregated because of data gaps, considering the fact that the most important materials already were mentioned in the result table. Based on literature review, 56% of total ‘’other non-metallic minerals’’ (23 kt) is considered as ‘’wood and wood products’’ used in construction sector (NCC annual report, 2017). The category ‘’metallic manufactured products’’ referred to basic metals, fabricated metal products, and machinery and equipment. Outputs are mentioned below excluding throughput materials such as recovered materials and including disposed materials and emissions to nature. In nutshell, 94% of total construction inputs are considered to be added to the stock considering SRS construction activities.
29 The detailed information for water consumption and wastewater production is taken from validated sources and simulations (Stockholm Stad, 2017; Papageorgiou, et al., 2018) (see Appendix B). Storm water also is considered based on (SRS Sustainability report, 2017). Water use in household and
restaurant sector was added quite equal amounts of material as total construction materials showing the key role of water flows in EW-MFA. All data are presented in thousands-tonne for better assessment of the flows. In the wastewater treatment section, energy recovery and purification functions are expected to take a place for most of the collected wastewater. High household wastewater production (263 kt)
highlights the importance of energy recovery projects such as biogas production from the collected wastewater in vacuum collection system (see Appendix B). Wastewater from restaurants is based on 377 t wastewater production per year for each restaurant and data modified for nine restaurants in the system boundary (see Appendix B). 529 kg per capita water in food on average was reported for SRS that was considered in the Figure 4.2. More than 90% of the water intake in restaurants is expected to end up in sewerage system and food, and the rest is accumulated in the system.
30
5. Discussion
5.1 Discussion of the results
MFA has focus on flows aiming to identify sectors with the most resources demands, while LCA estimate the potential environmental impacts within the resource life span (extraction, production, manufacture, use and end of life stages) (Kalmykova, et al., 2019). The application of the enhanced EW-MFA for small-scale urban areas provides deeper understanding of the area’s infrastructure and metabolic material flow processes. Less aggregate material classification including throughput material flows provides detailed information about material flow origins and destinations that enable us to highlight the hotspots regarding material need within the system. And gain a better picture of material circularity within the socioeconomic system such as recovered materials and renewable energies extracted locally. In addition, with new detailed material classification comparison between urban areas is possible, revealing each city’s unique characteristic impact on material use. Furthermore, the result can be transferred as an exemplary model for other new urban areas with similar economic, social, and environmental status, whereas MFA itself might need be combined with application of other method’s result such as LCA to draw
comprehensive conclusion regarding amending resource management.
Using bottom-up data provided detailed information regarding material flow in sectors where material was required more than other sectors due to the SRS metabolism in 2017. For instance, massive
construction activities in the area resulted in experiencing increase in ‘’non-metallic minerals’’ inputs to the socioeconomic system. On the other hand, new material classification provided detailed information regarding SRS strategic plans to not only reduce CO2, but also save carbon underneath trees and
absorbing CO2 with investing on GSI projects.
Adding water and wastewater flows into the analysis, which resulted in adding considerable amounts of material flows, including stored stormwater and purified water within the socioeconomic
system. Different strategies considering capturing storm, and surface water and recycling wastewater has increased understanding of the city’s metabolism for water recycling and energy recovery from
wastewater.
Some of these strategies in SRS are counted as below:
x GSI which refers to green structure of the buildings by building green country yards and roofs to avoid storm water run offs.
x Vacuum collection systems were installed in every buildings, restaurants, and commercial units to grinding waste foods in the sink and send them to the power plants for energy recovery purposes. x Structured tree with biochar defines new structural tree plant that can ssequester CO2 in the
biochar underneath the tree plant and also capturing and save stormwater run offs from the surface inside the inlets where the supply of air and water to the tree happens
One of strategic plans for capturing storm water in the SRS is mentioned green buildings which refers to gardens on the roof and open areas to save the storm water runoffs as much as possible. Capturing and filtering storm water was highlighted by Wendling and Holt (2020) with using nature-based solutions (e.g. absorbing surface water by application of permeable pavements was assessed). This strategy is
31 implemented in SRS by planting trees with biochar bringing solution to capturing and filtering the surface water.
It is predicted by SRS roadmap that with the completion of the rest of residential areas (12 000
apartments) and commercial areas (more than 100 000 square meters) by 2030, water use will increase but at lower degree than the rest of Stockholm by performing the above mentioned strategic plans for reducing water consumption and increasing capturing and recycling water. The same result from adding water flows into the analysis of Amsterdam confirms the significant role of water and wastewater flows for enhancing understanding of city’s metabolism (Voskamp, et al., 2017).
Locally generated renewable energies such as thermal and solar energies have increased the local
renewable resources production rate that sustains the energy supply chain and lessens the environmental impacts. Nevertheless, LCA of renewable energy technologies in the local context that will consider production, installation, and maintenance processes is needed to distinguish pros and cons of these technologies and provide more accurate and comprehensive evaluation.
Involving internal material flows emphasized on recovered materials and locally produced renewable energies. Involving recovered materials from the construction sector, added considerable amounts of materials. Produced energy from wastewater and waste materials have also been responsible for most of the energy coverage. However, energy recovery from waste is associated with releasing uncontrolled toxic emissions that need to be monitored, for comparing waste fuels with fossil fuels regarding their
environmental impacts (Virtanen, et al., 2019). Adding power plants data, added massive amounts of waste and CO2 emissions to the result. Nevertheless, due to lack of detailed classification regarding
powerplants energy resource origins, they mentioned separately in the result table and estimated bottom up data is preferred for the analysis process.
Analyzing buildings and road construction waste treatment methods or conversion of biogas derived from wastewater sludge shows to what extent SRS strategic plans help to reuse materials, recovers energy, and reduce the GHG emissions. Moreover, it prevails the roadmap for the future opportunities regarding increasing reuse, recycle and recover rates by explicating sourcing of recycled and secondary resources from internal waste treatment process. Developing this knowledge base helps to identify the share of material inputs and consumption of renewable and nonrenewable resources which ultimately provides deeper understanding of metabolic process in the system. The amount of material use in construction and waste statistics are not fully consistent to the mass balance principle because of each material unique durability and end of life within the system.
In SRS, the recorded recovered materials in the construction sector and their calculated share to GDP shows their noticeable contribution to economic growth. Choosing materials, product, and services considering their quality, efficiency, productivity, and recyclability could enhance the SRS circular
economy. Moreover, spotting useable and recyclable materials in the system and studying the dynamics of material physical exchanges in the stock could enhance reusing and recycling considerably. These
recovered materials in SRS includes mostly materials from construction and demolition activities such as rock, sand, and metals. Clarifying landfilled material fractions also could be beneficial for increasing recycling due to massive amounts of landfilled construction materials.
Household’s waste data was available from different data sources. The comparison of the differences between the collected data allowed the fair and accurate analysis of SRS strategic plans for reducing waste production and increasing sorting waste materials (see Appendix B). However, quality of waste statistics needs to be improved. For instance, mixed waste production is reduced in the area compared to other
32 regions in the Stockholm, but due to its high amounts more data regarding waste fractions is needed for handling them better by proper sorting process and choosing the right waste treatment for each material than them using conventional methods such as incineration.
5.2 Validation of the results
Less aggregated material classification considering internal flows describes the city’s characteristics and provides opportunity to compare detailed material flows with other urban areas. These comparisons can be exemplary for amending resource management (Hammer, et al., 2003; Rosado, et al., 2014). A comparison of the SRS aggregated results with other urban areas (Amsterdam, Vienna, and Hamburg) considering material share in GDP is considered for validating the result. The comparison presented in Table 5.1.
Table 5.1 Eurostat EW-MFA results for SRS, Amsterdam, Vienna, and Hamburg
Characteristics SRS Amsterdam Vienna Hamburg
Base year of study 2017 2012 2001 2003
Population 4800 790,000 1,726,0000 1,590,000 Land area 203 (km2) 219 (km2) 755 (km2) 415 (km2)
GDP (million euro) 290.56 56,912 70,994 56,728 Material flows t (t/GDP) (t/GDP) (t/GDP) (t/GDP)
Inputs
Total local extraction
Biomass - - 0.4 2.1 3.8
Minerals 8000 27.50 - - 1.8
Metal - - - - -
Fossil fuel & fossil fuel products - - - 0.4 - Total Imports
Biomass 4818 16.50 179 235 51
Non-metallic minerals 309839 1066.50 - - - Total ores & industrial minerals 16633 57.25 222 352 132 Fossil fuel & fuel products 20594 70.89 844 294 153 Chemical products 1834 6.31 102 113 10 Other industry products 102 0.35 78 318 -
Other imports 20 104 98
Outputs
Total exports
Biomass & biomass products - - 177 217 32
Non-metallic minerals 7570 26.05 - - -
Total ores & industrial minerals 332 1.14 169 282 91 Fossil fuel & fossil fuel products 17546 60.39 745 183 89
Chemical products - - 35 146 17
Other industry products - - 74 295 -
Other exports 22 95 80
Physical balance
Biomass & biomass products 4818 16.50 1.65 18 19 Non-metallic minerals 302269 1040.50 52.48 - - Total ores & industrial minerals 16301 56.11 98.50 70 41 Fossil fuel & fossil fuel products 3048 10.49 67.45 111 64 Chemical products 1834 6.31 5.86 -33 -7 Other industry products 102 0.35 -2.12 23 -
Other exports 9 18
Note: since modified material classification was not available for other cities, Eurostat material classification is used for comparison. The above-mentioned data was taken from Voskamp, et al. (2017) who used the EW-MFA method for describing each cities material share to GDP and then compare them together. Reduction in fossil fuel