309 ALFALFA CROP COEFFICIENTS DEVELOPED USING A WEIGHING
LYSIMETER IN SOUTHEAST COLORADO
Hamdan AlWahaibi 1 Allan Andales1
Dale Straw2 Lane Simmons1
Michael Bartolo1 Thomas Ley2
Thomas Trout3 José Chávez1
Neil Hansen1
ABSTRACT
Weighing lysimeters are precise devices used to measure crop evapotranspiration (ET) and to develop crop coefficients. A weighing lysimeter was installed in the Arkansas River Valley of Colorado in 2006 to measure ET and develop crop coefficients of locally-grown crops. The lysimeter was filled with a 3 m × 3 m undisturbed soil monolith. Alfalfa (Medicago sativa L.) was planted in the lysimeter and in 4 ha of surrounding field in August 2007. Climatic data and soil conditions were measured using microclimate and soil sensors installed above and on the lysimeter. Furrow irrigation was applied to the monolith and surrounding field. Reference ET was calculated using the hourly ASCE standardized reference ET equation. Crop coefficients of alfalfa were calculated by dividing daily measured ET from the lysimeter by the corresponding daily total ASCE standardized reference ET. Four alfalfa cuttings occurred in both the 2008 and 2009 growing seasons. The results showed that the alfalfa growth, climate and precipitation were shaping crop coefficients. The first cutting cycle, which had slower growth due to climate, had lower crop coefficients, whereas later cutting cycles with rapid growth had higher crop coefficients. The maximum crop coefficients were below 1.2 in 2008 and at or above 1.2 in 2009. Precipitation interception by the alfalfa canopy increased
evaporation and caused outliers in the crop coefficient values. INTRODUCTION
Irrigation water management is an essential element of conservation and sustainability of water resources. Effective irrigation management depends on accurate estimates of crop water use which is needed for deciding when and how much to irrigate. Crop water use is defined as the water lost from crop and soil through the processes of transpiration and evaporation (evapotranspiration, ET).
Estimation of ET or water consumption is the foundation of irrigation scheduling for efficient irrigation management. Although many methods to determine ET are available, direct measurement using a weighing lysimeter is the most precise method for measuring crop water consumption. In a precision weighing lysimeter, ET is determined by
1 Colorado State University, Fort Collins, Colorado, 80523, USA 2 Colorado Division of Water Resources, Pueblo, Colorado, 81004, USA
3 USDA-Agricultural Research Service-Water Management Research, Fort Collins, Colorado 80526, USA
Corresponding author. Tel.: (970)491-6516; Fax: (970) 491-0564 Email address: Allan.Andales@colostate.edu
measuring the change in mass with an accuracy equivalent to a few hundredths of millimeters of water (Allen et al., 1998). The crop coefficient (Kc), which represents plant characteristics, is the ratio of the actual crop ETc to the reference evapotranspiration (ETr). Crop coefficients are widely used to determine crop water consumption and in determining when and how much water to apply with irrigation (Howell et al., 2006). Even though Kc values for most crops have been reported in the literature, developing them under local cropping practices and soil and climatic conditions is recommended for accurate irrigation scheduling because of variations in crops, climate and other
environmental factors that influence ET. Whatever a reference ET method is used, there is proof that Kc values may not be transferable from one area to another (Evett et al., 1998). Crop coefficients that are currently used by the Colorado Division of Water
Resources were measured at Kimberly, Idaho and Bushland, Texas (Berrada et al., 2008). Alfalfa is one of the major and most valuable forage crops and has a high biomass yield potential in Colorado (Smith et al., 1999). Irrigated alfalfa has one of the greatest levels of seasonal water consumption among irrigated crops (Wright, 1988). Determination and application of accurate alfalfa crop coefficients could be a potential way to save water. This research was aimed to develop crop coefficients of alfalfa using a weighing lysimeter in the Arkansas Valley of Colorado.
MATERIALS AND METHODS Experimental location
The experiment was conducted during 2008 and 2009 at the Arkansas Valley Research Center in southeast Colorado (latitude 38o 2’ 17.30”, longitude 103o 41’ 17.60”, altitude 1,274 m above sea level). It was carried out using a large weighing lysimeter constructed for evaluating the American Society of Civil Engineers (ASCE) standardized Penman Monteith (PM) equation and to compute actual evapotranspiration (ETc) and crop coefficients (Kc) for various crops under Arkansas Valley conditions. The lysimeter was filled with an undisturbed soil monolith with soil type being a Rocky Ford course loamy, mixed , superactive, mesic Aridic argiustoll. The soil pH and ECe are 8.2 and 0.78 dS/m respectively. The soil layers have bulk density and hydraulic conductivity ranges of 1.35-1.45 g/cm and 0.33-1.25 cm/hr, respectively.
Lysimeter design
The inner tank of the weighing lysimeter has dimensions of 3m x 3m x 2.4 m depth. Calibration of the weighing mechanism was done similar to the procedure developed by USDA-ARS at Bushland, Texas (Berrada et al., 2008) to convert the load cell output in mV/V to mass. The lysimeter load cell output was recorded every 10 seconds throughout each growing season. Fifteen-minute averages of the load cell data were used in the calculation of ETc. Based on the load cell calibration, a change of 1 mV/V in the load cell output is equivalent to a change of 76 mm of water in the lysimeter.
Climate and soil measurements
A weather station was installed at the lysimeter site to measure climate variables above and within the lysimeter. Variables included rainfall, wind speed, air temperature, solar radiation, barometric pressure, soil temperature, and soil heat flux. Berrada et al. (2008) described in detail the sensors and their placement. Climatic data were recorded every 15 minutes. Soil moisture in and near the lysimeters was monitored using a CPN 503 DR neutron probe at 20 cm increments up to 190 cm. Two access tubes were installed inside the monolith and four were installed immediately outside the lysimeter. The neutron probe was calibrated based on the Evett et al method (Berrada et al., 2008).
Alfalfa planting and irrigation
Alfalfa (Genoa variety) was planted mechanically in the field and by hand in the lysimeter on 9 August 2007 at a rate of 21.3 kg/ha. The soil monolith was irrigated manually to mimic the furrow irrigation of the surrounding field (158.5 m x 256.1 m). When flow in the field furrows reached the lysimeter, it was diverted around the
lysimeter. Metered water was pumped into four evenly-spaced furrows (76 cm spacing) on the soil. The amount of water applied to the monolith was recorded. Alfalfa height was measured weekly. Alfalfa was harvested four times in both 2008 and 2009. Alfalfa in the lysimeter was harvested manually in June 11th, July 21st, September 1st and November 3rd in 2008 and in June 8th, July 15th, August 24th and October 5th in 2009.
Water balance
Water balance of the lysimeter for the 2008 and 2009 seasons was calculated based on the weight data using the equation:
(1) Where seasonal change in soil water content (ΔS) was calculated from water inputs
[Precipitation (P) and irrigation (Irr)] and water outputs [Evapotranspiration (ET) and Drainage (D)].
Reference ET calculation
The American Society of Civil Engineers (ASCE-PM) standardized ETrs equation was used to estimate reference evapotranspiration on an hourly time step using climatic data obtained from the weather station.
(2) where:
Rn = calculated net radiation at the crop surface (MJ/m2/h), G = soil heat flux density at the soil surface (MJ/m2/h), T = mean hourly air temperature at 1.5 to 2.5-m height (°C), u2 = mean hourly wind speed at 2-m height (m/s),
es = saturation vapor pressure at 1.5 to 2.5-m height (kPa), ea = mean actual vapor pressure at 1.5 to 2.5-m height (kPa),
Δ = slope of the saturation vapor pressure-temperature curve (kPa/°C), γ = psychrometric constant (kPa/ °C),
Cn = 66; numerator constant for tall reference and hourly time step (K mm s3 /Mg/h) and Cd = 0.25 (daytime), 1.7 (nighttime); denominator constants for tall reference and hourly time step (s/m).
Units for the 0.408 coefficient are m2 mm / MJ.
The ETrs calculated by ASCE-PM uses wind speed measured at 2 m height over smooth surface like clipped grass. The wind speed at the lysimeter was measured at 2m above alfalfa, which had variable height during the growing season. At most times alfalfa height was greater than clipped grass. The wind speed adjustment algorithmdescribed by Ley et al. (2009) was used to adjust wind speeds over variable height alfalfa to equivalent wind speeds at 2 m over grass.
Crop coefficient (Kcr) calculations
Crop coefficient values based on a tall (alfalfa) reference for the 2008 and 2009 seasons were calculated on a daily time step as the ratio between measured ETc from the lysimeter and the ASCE standardized ETrs.
(3)
where:
ETc = Actual crop evapotranspiration from lysimeter (mm/d)
ETrs = ASCE standardized reference crop evapotranspiration (mm/d)
The daily ETrs values were obtained by summing values calculated from the hourly version of the standardized equation for each 24-hour period. Crop coefficient curves for each alfalfa cutting cycle were fitted through observed Kcr values using FAO 56 methods (Allen et al., 1998), with some modification to fit observed Kc’s for each growth stage.
RESULTS AND DISCUSSION Seasonal Water Balance
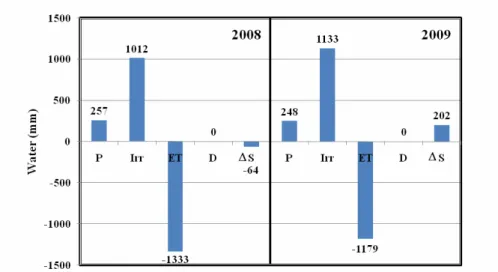
Seasonal water balance for 2008 and 2009 is shown in Figure 1. Alfalfa use 1333 mm of water in 2008 and 1179 in 2009. The total water input (precipitation + Irrigation) was 1269 mm in 2008 and 1381 mm in 2009. There was no drainage in both seasons. The change in soil water content in 2008 was -64 mm. This indicates that alfalfa consumed 64 mm more water than that added by precipitation and irrigation. In 2009, the change in soil water content was +202 mm, indicating that alfalfa consumed 202 mm less water than that added by precipitation and irrigation. Alfalfa consumed more water in 2008 than in 2009 even though the total water added was lower than 2009. Higher water
consumption in 2008 was primarily due to a longer growing season. The total growing season in 2008 was 215 days whereas 2009 was only 195 days.
Figure 1. Seasonal water balance of the alfalfa grown in the lysimeter in 2008 (4/1/08 -11/5/08) and 2009 (3/24/09 – 10/5/09).
Alfalfa Evapotranspiration
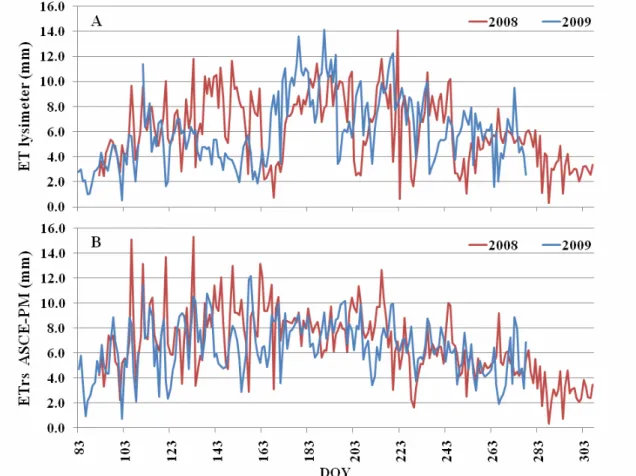
Daily alfalfa ET for both 2008 and 2009 season is shown in Figure 2A. Alfalfa ET fluctuations during the growing periods corresponded with similar fluctuations in
reference ET (Figure 2B). Actual ET in 2008 was higher than in 2009 for the first cutting cycle because of greater atmospheric demand, which is reflected in the higher ETrs values in 2008. Maximum water use of alfalfa was around 14.0 mm/d for both 2008 and 2009 seasons. Average ET for 2008 and 2009 was 6.1 mm/d and 6.0 mm/d, respectively. In comparison, Evett et al. (1998) found that measured ET of alfalfa at Bushland, TX in 1996 and 1997 averaged 7.1 mm/d and 6.7 mm/d, respectively. They also found that the peak ET reached 16 mm/d for both years.
Figure 2. Actual alfalfa ET from lysimeter (A) and reference ET ASCE-PM (B) in 2008 (4/1/08 -11/5/08) and 2009 (3/24/09 – 10/5/09).
Alfalfa crop coefficients
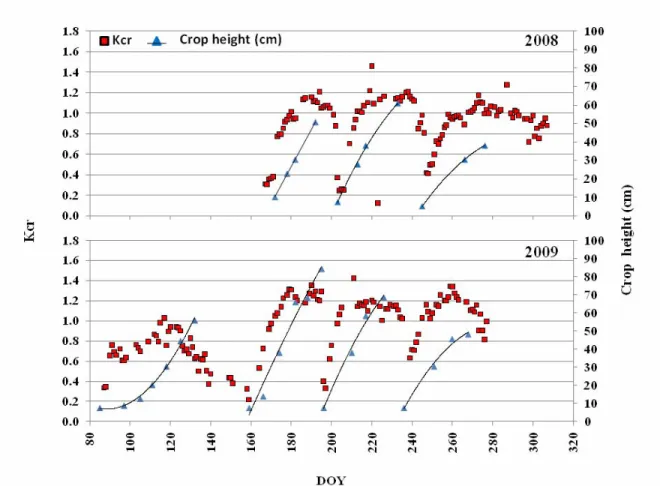
Crop coefficients represent the effects of crop growth and condition on ET. The Kcr is low when the crop is in the initial growth stage or after cutting and increases as the crop develops, reaching a maximum value at mid stage. Figure 3 shows alfalfa crop
coefficients for the 2008 and 2009 seasons as responding to crop growth. In the 2008 season, the first cutting cycle was not included because there weren’t canopy height measurements that could be used for making wind speed corrections for ETrs
calculations. It is obvious that alfalfa crop coefficients were low in the initial stage and increased as alfalfa height increased until reaching the maximum when the alfalfa height was at mid stage. The growth of alfalfa in the first and fourth cutting cycle was slower due to cooler weather and lower solar radiation.
Figure 3. Alfalfa crop coefficients corresponding to crop height development in 2008 and 2009.
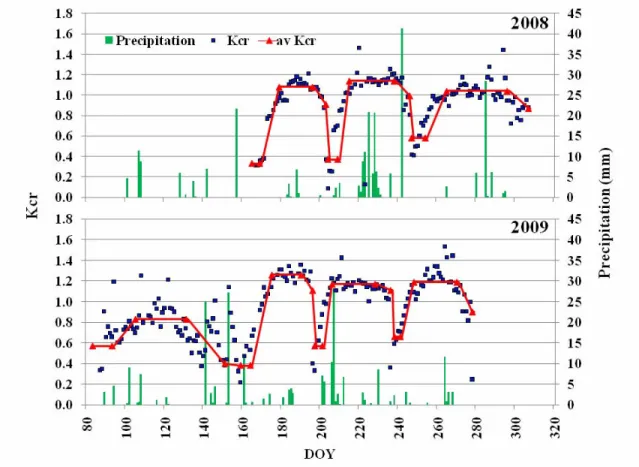
In general for all cuttings, maximum Kcr values were higher in 2009 than in 2008 (Figure 4). In 2008 the maximum Kcr values mostly remained below 1.2 whereas in 2009,
maximum Kcr values were about 1.2 as shown in Figure 4. The Kcr values greater than 1.0 were due to ETc values from the lysimeter being higher than ETrs values from the ASCE standardized equation. However alfalfa crop coefficients based on ETrs should not persistently exceed 1.0, given the assumption that ETrs represents the theoretical upper limit for ET. The peak Kcr values reported here were higher than those reported by Howell et al. (2006) and Wright (1982). They found that the peak Kcr was near 1.0. However Howell et al. (2006) found that Kcr values did exceed 1.0 occasionally. In both years, the second and third cutting cycles had similar lengths of growing periods. In contrast, the fourth growing period in 2008 was longer than in 2009 that was reflected in the difference in shape of the Kcr curves. The first cutting cycles for both the 2008 and 2009 seasons were longer than other cutting cycles. The 2009 data showed that peak Kcr values in the first cutting cycle were lower than in later cutting cycles.
Figure 4 also shows the effects of rainfall on the crop coefficients. Crop coefficient values increased significantly during precipitation days. Precipitation tends to increase evaporation from bare soil during early growth stages when the alfalfa does not fully
cover the ground. Precipitation also increases direct evaporation of rainfall that is intercepted by the crop canopy.
Figure 4. Alfalfa crop coefficients and precipitation in 2008 and 2009.
The peak Kcr values that were persistently greater than 1.0 lead us to believe that some energy actually available for ET is not being accounted for in our ETrs calculations. Further evaluations of the weather data inputs have to be made to determine why ETrs values were persistently less than ETc from the lysimeter during the latter periods of the 2nd, 3rd, and 4th cutting cycles. Possible causes may be under-estimation of net radiation
(Rn) input to the ASCE standardized equation and the actual evapotranspiring surface of
the lysimeter alfalfa being greater than the ground surface area of the lysimeter. The second possibility may occur when alfalfa at the perimeter of the lysimeter lodges and its canopy extends beyond the perimeters.
REFERENCES
Allen, R.G., Pereira, L.S., Raes, D., Smith, M. (1998). Crop evapotranspiration:
Guidelines for computing crop requirements. Irrigation and Drainage Paper No. 56, FAO, Rome, Italy.
Berrada, A., Simmons, L., Straw, D., Bartolo, M., and Ley, T. 2008. The large lysimeter at the Arkansas Valley Research Center: Ojectives and accomplishments. Technical
Bulletin TB08-02, http://www.colostate.edu/Depts/AES/Pubs/pdf/tb08-2.pdf, Agricultural Experiment Station, Colorado State University, Fort Collins, Colorado. Evett, S. R., Howell T. A., Todd R. W., Schneider A.D. and Tolk J.A. (1998). Evapotranspiration of irrigated alfalfa in a semi-arid environment, ASAE, Paper No. 982123.
Howell T. A., Evett, S. R., Tolk J.A., Copeland K.S., Dusek D.A. and Colaizzi P.D. (2006). Crop coefficient developed at Bushland, Texas for corn, wheat, sorghum, soybean, cotton and Alfalfa. World environmental and water resources congress. Ley, T.W., Allen, R.G., and Jensen, M.E. 2009. Adjusting Wind Speed Measured over Variable Height Alfalfa for Use in the ASCE Standardized Penman-Monteith Equation. ASCE. In S. Starrett (ed.) Proceedings of the World Environmental and Water Resources Congress 2009: Great Rivers. Kansas City, Missouri. May 17–21, 2009. American Society of Civil Engineers, Reston, VA.
Smith D.H., Beck G.K., Peairs F.B. and Brown W.M. 1999. Alfalfa: Production and management. Colorado State University Cooperative Extension.no
0.703.ww.colostate.edu/deps/coopext.
Wright, J.L. (1982). New evapotranspiration crop coefficients. J. Irrig. Drain. Eng. 108 (1): pp 57–74.
Wright, J. L. (1988) Daily and seasonal evapotranspiration and yield of irrigated alfalfa in southern Idaho. Agronomy Journal. 80 (4):662-669.