A plan for conversion of stormwater to groundwater recharge on the
Utah Valley University main campus, Orem, Utah
Dylan B. Dastrup, Gabriela R. Ferreira, Daniel Zacharias, Daniel H. Natter, Lawrence T. Kellum, Steven H. Emerman1, Brandon B. Davis, Michael R. Alexander, and Jeff Selck
Department of Earth Science, Utah Valley University, Orem, Utah
Abstract. At the present time the vast majority of the stormwater generated on the Main Campus
of Utah Valley University is exported to Utah Lake, which is only 1.4 miles from campus.
Although there is a large boulder-lined detention pond on campus, it is used only as a holding pond before the stormwater is exported. The objective of this study was to determine what percentage of the average annual stormwater and the stormwater generated by a 100-year 24-hour precipitation event could be retained on campus and used for groundwater recharge by constructing a series of French drains. It was determined that the Main Campus could be divided into 33 watersheds that currently export stormwater (72.8% of the surface area) and 28 additional self-contained
watersheds. Using the NRCS Runoff Curve Method, it was determined that the Main Campus exports 0.4998 ac·ft of stormwater annually and would export 23.2969 ac·ft of stormwater following a 100-year 24-hour precipitation event, while the self-contained watersheds capture 0.0330 ac·ft annually and would capture 2.7913 ac·ft following a 100-year 24-hour event. The construction of nine French drains (including subsurface expansion of the existing detention pond with discontinuation of pumping) with a combined surface area of 0.9260 ac would convert to groundwater recharge 0.1402 ac·ft annually (28.1% of current export) and 6.2083 ac·ft following a 100-year 24-hour precipitation event (26.6% of current export). Further reduction of stormwater export could not be accomplished without disruption to current paved areas or other built infrastructure.
1. Introduction
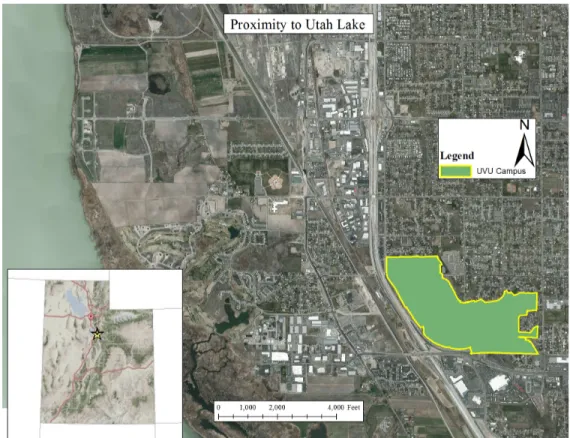
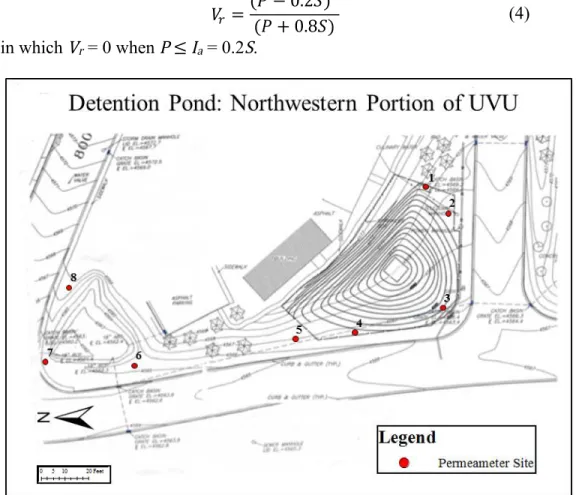
The Main Campus of Utah Valley University covers approximately 211 acres in Orem, Utah (see Fig. 1). At the present time the vast majority of the stormwater generated on the Main Campus is exported to Utah Lake, which is only 1.4 miles from campus. Although there is a large boulder-lined detention pond on campus, it is used only as a holding pond before the stormwater is exported (see Fig. 2). The objective of this study was to determine what percentage of the average annual stormwater and the stormwater generated by a 100-year 24-hour precipitation event could be retained on campus and used for groundwater recharge by constructing a series of boulder-lined retention ponds, also known as French drains. (Note that a detention pond is intended to hold water temporarily, while a retention pond is intended to hold water indefinitely until the water evaporates or infiltrates into the underlying soil. Due to the high water table in Orem, Utah, any downward infiltration results in groundwater recharge.)
The objectives were addressed by asking the following questions: 1) How is the campus divided into watersheds?
1
Department of Earth Science Utah Valley University Orem, Utah 84058 Tel: (801)863-6864 e-mail: StevenE@uvu.edu
2) What is the volume of surface runoff that would be generated in each watershed from a 100-year 24-hour precipitation event?
3) What is the average annual volume of surface runoff from each watershed?
4) What would be the location and dimensions of the French drains required to retain all of the stormwater generated in a 100-year 24-hour precipitation event?
5) Could the current detention pond be converted into a French drain simply by discontinuing pumping water out of the pond?
Figure 1. The vast majority of the stormwater generated on the Utah Valley University Main Campus is exported to Utah Lake, which is only 1.4 miles from campus.
2. Methods
2.1 Calculation of Volume of Surface Runoff
The Main Campus was divided into watersheds by walking the campus with a hand level and noting the locations of the storm drains. The volume of surface runoff that would be generated on each watershed by a particular precipitation event was calculated using the Runoff Curve Method (NRCS 2004). According to this method, runoff is calculated using the empirical formula
𝑉! =
(𝑃 − 𝐼!)!
(𝑃 − 𝐼!+ 𝑆) (1)
where Vr is runoff in inches, P is precipitation in inches, Ia is the initial abstraction
(surface storage, interception and infiltration prior to runoff), and S is defined by
𝑆 =1000
where the curve number CN depends upon the land use and Hydrologic Soil Group. (The Hydrologic Soil Groups are defined by infiltration rates of <0.05 in h-1 (Group D), 0.05-0.15 in h-1 (Group C), 0.15-0.30 in h-1 (Group B) and >0.3 in h-1 (Group A) (NRCS 2004)). Runoff in inches is then multiplied by watershed area in acres to obtain volume of runoff from a watershed in acre-feet. Where a watershed contains multiple land uses and Hydrologic Soil Groups, the volume of runoff is calculated separately for each region of the watershed and then summed to obtain the total volume of runoff. The initial abstraction Ia can be approximated as
𝐼! = 0.2𝑆 (3)
so that Eq. (1) becomes
𝑉! =(𝑃 − 0.2𝑆)!
(𝑃 + 0.8𝑆) (4)
but in which Vr = 0 when P ≤ Ia = 0.2S.
Figure 2. A boulder-lined detention pond is used currently only as a holding pond before the stormwater is exported. However, with subsurface expansion and the discontinuation of pumping, the same pond could convert all of the stormwater generated by a 100-year 24-hour precipitation event into groundwater recharge. Figure modified from King
Engineering (2010).
The land-use proportions of each watershed were estimated by aerial photography from Google Earth as taken on June 17, 2010, but were modified based on recent campus
construction. The Hydrologic Soil Groups were determined from the NRCS Web Soil Survey (NRCS 2012). The Web Soil Survey could not be relied upon as a sole source of information because the scale of mapping was larger than the scale of interest of this study. Moreover, although the thickness of construction fill was reported to be negligible
addition of construction fill throughout campus had a significant impact on hydraulic conductivity. Therefore, the validity of the use of the Web Soil Survey to identify Hydrologic Soil Groups was verified by measuring the field-saturated hydraulic
conductivity at eight sites near the detention pond (see Fig. 2) using the Model 2800K1 Guelph Permeameter (SoilMoisture Equipment, Inc.). Saturated hydraulic conductivities were determined by the semi-empirical formula
𝐾 = 35.17(0.0041𝑅!− 0.0054𝑅!) (5)
where K is hydraulic conductivity (cm min-1), and R
1 and R2 are the steady-state rates
of fall (cm min-1) of the water level in the permeameter reservoir at heads of 5 cm and 10 cm, respectively (Elrick and Reynolds 1986; SoilMoisture Equipment 1986). Saturated hydraulic conductivities were measured in augured holes 6 cm in diameter and 15 cm deep.
For each watershed, the average annual volume of surface runoff was calculated, as well as the volume of surface runoff that would be generated by a 100-year 24-hour
precipitation event. A 100-year 24-hour precipitation event in Orem, Utah, is estimated at 2.38” of precipitation (NOAA-NWS 2012). The average annual precipitation in Orem is 13.26” (NOAA-NCDC 2012). The average annual surface runoff was calculated by
summing the runoff that would be produced by the average daily precipitation for each day throughout the year. According to Eqs. (2) – (3), typical pavement (CN = 98 (NRCS 2004)) has sufficient cracks and depressions that surface runoff will occur only when the
precipitation exceeds 0.041”. The average daily precipitation in Orem, Utah, equals 0.05” on 59 days of the year, equals 0.06” on 14 days of the year and never exceeds 0.06” (NOAA-NCDC 2012), so that surface runoff occurs on average on only 73 days of the year, even on paved surfaces.
2.2 Determination of Sizes and Locations of Retention Ponds
The minimum size of a rectangular retention pond required to contain all of the stormwater generated by a 100-year 24-hour precipitation event and the time required for the retention pond to empty following the precipitation event was calculated using the procedure described in the appendix. It was assumed that stormwater entered the retention pond at a uniform rate Qin given by Qin = Vr/Δt, where Δt = 24 h. It was also assumed that
the retention pond simultaneously drained into the surrounding soil at a flux equal to the saturated hydraulic conductivity K. (This assumption is equivalent to the assumption of unit hydraulic gradient, which is also equivalent to the assumption of a constant infiltration rate for a given Hydrologic Soil Group.) The hydraulic conductivities were chosen as the mid-range for each Hydrologic Soil Group as follows: Hydrologic Soil Group A: K = 0.025 in h-1, Hydrologic Soil Group B: K = 0.1 in h-1, Hydrologic Soil Group C: K = 0.225 in h-1, Hydrologic Soil Group D: K = 0.4 in h-1. The minimum size was chosen as the size that would completely fill in exactly 24 hours. The depth of the pond was chosen as the depth to the water table as given in the Web Soil Survey (NRCS 2012), and the width and length were varied to achieve the required size. The time to fill the complex shape of the existing detention pond was calculated by approximating the detention pond by a stack of 10 vertical cylinders with base and top of arbitrary shape (based upon the 10 1-foot contour lines that define the pond (see Fig. 2)) and using the procedure described in the appendix.
criteria:
1) Retention ponds were to be constructed only on current grassy areas so that there would be no disruption of current paved areas or other built infrastructure.
2) A retention pond had to be located in a watershed so that, given the current drainage pattern, all surface runoff would drain toward that retention pond.
3. Results
3.1 Volumes of Surface Runoff
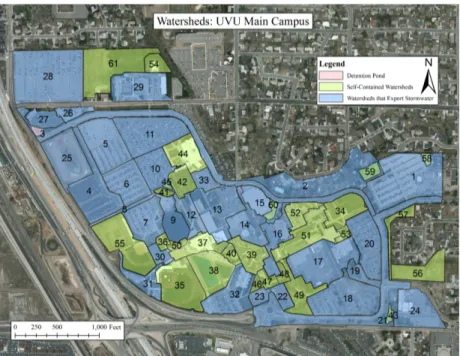
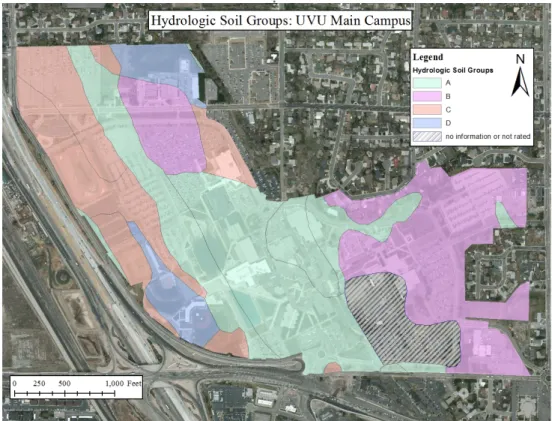
The Main Campus was divided into 33 watersheds that export stormwater (72.8% of campus surface area) and 28 self-contained watersheds (27.2% of campus surface area) (see Fig. 3 and Tables 1-2). Self-contained watersheds capture stormwater in fountains, grassy depressions, small French drains or sumps. The majority of campus land use was found to be pavement or buildings (65.2% of surface area) with the remainder being lawns in good condition (34.8% of surface area). The lawns were found to be about equally divided between Hydrologic Soil Group A (38.3%) and Soil Group B (34.7%) with lesser amounts in Soil Group C (6.6%) and Soil Group D (20.4%) (see Fig. 4). The average hydraulic conductivity K (excluding one outlier) measured in an area mapped as Hydrologic Soil Group C (see Figs. 2, 4) was K = 0.14 in/h (see Table 3), so that the mapped Hydrologic Soil Groups were regarded as accurate. Therefore, the curve numbers were chosen as CN = 98 (pavement), CN = 80 (lawn in Soil Group D), CN = 74 (lawn in Soil Group C), CN = 61 (lawn in Soil Group B), and CN = 39 (lawn in Soil Group A). Based on the above, it was determined that the Main Campus exports 0.4998 ac·ft of stormwater annually and would export 23.2969 ac·ft of stormwater following a 100-year 24-hour precipitation event, while the self-contained watersheds capture 0.0330 ac·ft annually and would capture 2.7913 ac·ft following a 100-year 24-hour event.
Figure 3. The UVU Main Campus was divided into 33 watersheds that export stormwater and 28 self-contained watersheds.
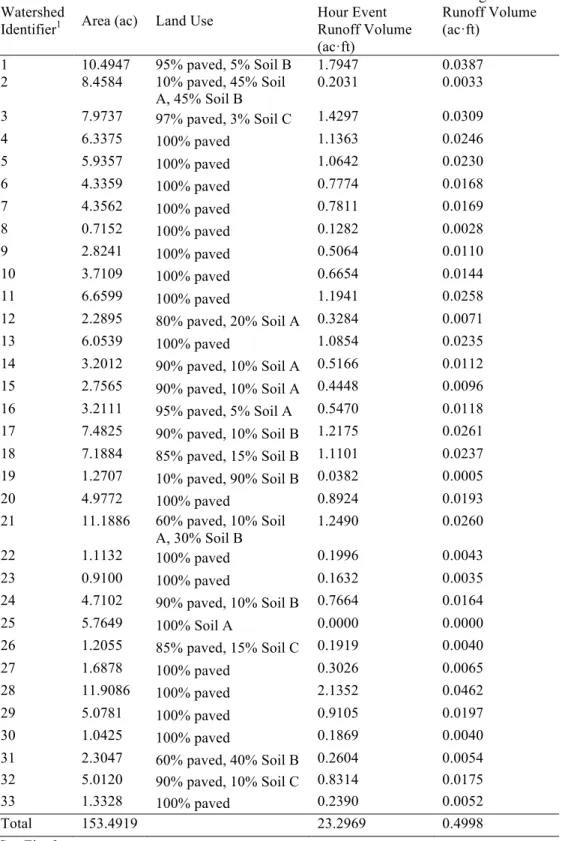
Table 1. Runoff generated in a 100-year 24-hour precipitation event and average annual runoff in current watersheds that export stormwater.
Watershed
Identifier1 Area (ac) Land Use
100-Year 24-Hour Event Runoff Volume (ac·ft) Average Annual Runoff Volume (ac·ft) 1 10.4947 95% paved, 5% Soil B 1.7947 0.0387 2 8.4584 10% paved, 45% Soil A, 45% Soil B 0.2031 0.0033 3 7.9737 97% paved, 3% Soil C 1.4297 0.0309 4 6.3375 100% paved 1.1363 0.0246 5 5.9357 100% paved 1.0642 0.0230 6 4.3359 100% paved 0.7774 0.0168 7 4.3562 100% paved 0.7811 0.0169 8 0.7152 100% paved 0.1282 0.0028 9 2.8241 100% paved 0.5064 0.0110 10 3.7109 100% paved 0.6654 0.0144 11 6.6599 100% paved 1.1941 0.0258 12 2.2895 80% paved, 20% Soil A 0.3284 0.0071 13 6.0539 100% paved 1.0854 0.0235 14 3.2012 90% paved, 10% Soil A 0.5166 0.0112 15 2.7565 90% paved, 10% Soil A 0.4448 0.0096 16 3.2111 95% paved, 5% Soil A 0.5470 0.0118 17 7.4825 90% paved, 10% Soil B 1.2175 0.0261 18 7.1884 85% paved, 15% Soil B 1.1101 0.0237 19 1.2707 10% paved, 90% Soil B 0.0382 0.0005 20 4.9772 100% paved 0.8924 0.0193 21 11.1886 60% paved, 10% Soil A, 30% Soil B 1.2490 0.0260 22 1.1132 100% paved 0.1996 0.0043 23 0.9100 100% paved 0.1632 0.0035 24 4.7102 90% paved, 10% Soil B 0.7664 0.0164 25 5.7649 100% Soil A 0.0000 0.0000 26 1.2055 85% paved, 15% Soil C 0.1919 0.0040 27 1.6878 100% paved 0.3026 0.0065 28 11.9086 100% paved 2.1352 0.0462 29 5.0781 100% paved 0.9105 0.0197 30 1.0425 100% paved 0.1869 0.0040 31 2.3047 60% paved, 40% Soil B 0.2604 0.0054 32 5.0120 90% paved, 10% Soil C 0.8314 0.0175 33 1.3328 100% paved 0.2390 0.0052 Total 153.4919 23.2969 0.4998 1See Fig. 3.
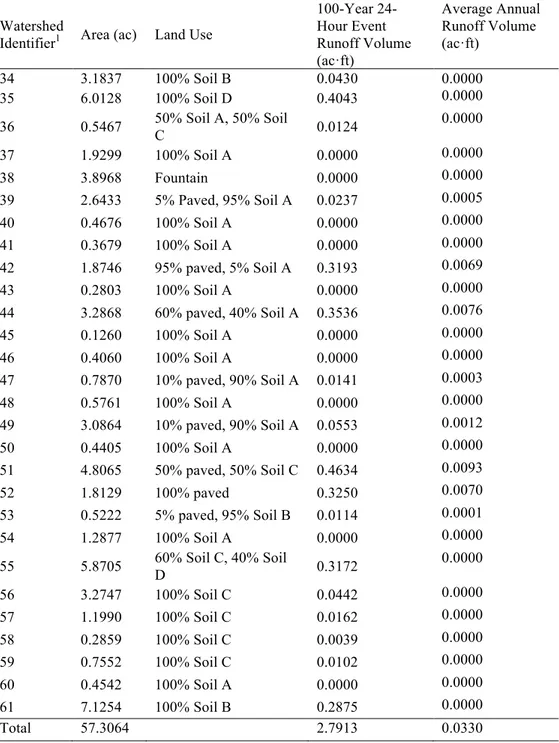
Table 2. Runoff generated in a 100-year 24-hour precipitation event and average annual runoff in current self-contained watersheds.
Watershed
Identifier1 Area (ac) Land Use
100-Year 24-Hour Event Runoff Volume (ac·ft) Average Annual Runoff Volume (ac·ft) 34 3.1837 100% Soil B 0.0430 0.0000 35 6.0128 100% Soil D 0.4043 0.0000 36 0.5467 50% Soil A, 50% Soil C 0.0124 0.0000 37 1.9299 100% Soil A 0.0000 0.0000 38 3.8968 Fountain 0.0000 0.0000 39 2.6433 5% Paved, 95% Soil A 0.0237 0.0005 40 0.4676 100% Soil A 0.0000 0.0000 41 0.3679 100% Soil A 0.0000 0.0000 42 1.8746 95% paved, 5% Soil A 0.3193 0.0069 43 0.2803 100% Soil A 0.0000 0.0000 44 3.2868 60% paved, 40% Soil A 0.3536 0.0076 45 0.1260 100% Soil A 0.0000 0.0000 46 0.4060 100% Soil A 0.0000 0.0000 47 0.7870 10% paved, 90% Soil A 0.0141 0.0003 48 0.5761 100% Soil A 0.0000 0.0000 49 3.0864 10% paved, 90% Soil A 0.0553 0.0012 50 0.4405 100% Soil A 0.0000 0.0000 51 4.8065 50% paved, 50% Soil C 0.4634 0.0093 52 1.8129 100% paved 0.3250 0.0070 53 0.5222 5% paved, 95% Soil B 0.0114 0.0001 54 1.2877 100% Soil A 0.0000 0.0000 55 5.8705 60% Soil C, 40% Soil D 0.3172 0.0000 56 3.2747 100% Soil C 0.0442 0.0000 57 1.1990 100% Soil C 0.0162 0.0000 58 0.2859 100% Soil C 0.0039 0.0000 59 0.7552 100% Soil C 0.0102 0.0000 60 0.4542 100% Soil A 0.0000 0.0000 61 7.1254 100% Soil B 0.2875 0.0000 Total 57.3064 2.7913 0.0330 1See Fig. 3.
Figure 4. The UVU Main Campus lawns are divided among Hydrologic Soil Groups A (38.3%), B (34.7%), C (6.6%) and D (20.4%).
Table 3. Results of Guelph Permeameter measurements. Site1 Steady-State Rate of Fall at
5 cm Head (cm min-1)
Steady-State Rate of Fall at 10 cm Head (cm min-1) Hydraulic Conductivity (in h-1) 1 0.1 0.18 0.16 2 0.12 0.2 0.14 3 0.05 0.1 0.11 4 0.12 0.2 0.14 5 0.1 0.18 0.16 6 0.2 0.3 0.12 7 0.2 1.1 2.84* 8 0.15 0.25 0.17
Average (excluding outlier *) 0.14
1See Fig. 2
3.2 Locations and Sizes of Proposed Retention Ponds
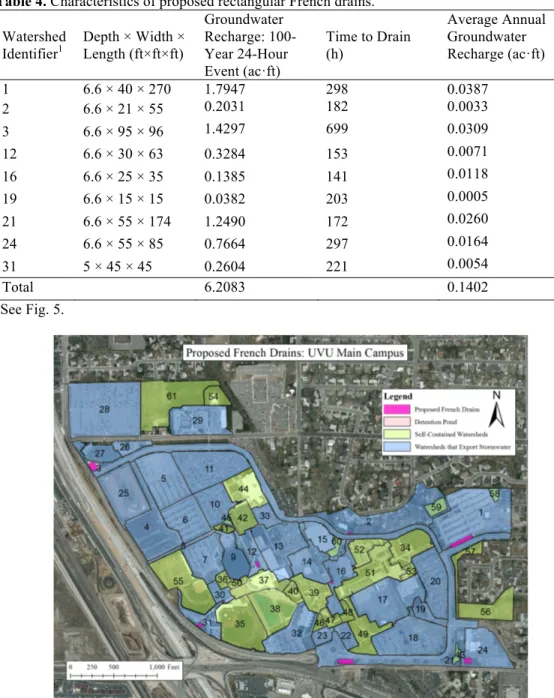
It was determined that retention ponds could be placed in nine out of the 33 watersheds that export stormwater (see Fig. 5, Table 4). In the remaining 24 watersheds, there was no place to put a retention pond, either because the entire watershed was in pavement or buildings or because the existing lawn was not at the lowest point of the watershed. For Watershed 16 (see Fig. 5), there was sufficient lawn space to place a retention pond of capacity 0.1385 ac·ft (see Table 4), although the watershed would generate 0.5470 ac·ft of stormwater in a 100-year 24-hour event (see Table 1). For the other eight watersheds, retention ponds could be located with sufficient capacity to accommodate all of the stormwater that would result from a 100-year 24-hour event. The existing cone-shaped detention pond in Watershed 3 (see Figs. 2-3, 5) has a surface footprint of 11,853 ft2 and
would completely fill in 16.5 hours. The detention pond could be expanded below the surface to create a rectangular retention pond that would take 24 hours to fill and which would need a smaller footprint (9120 ft2) than the present detention pond (see Table 4, Figs. 2-3, 5). The combined surface footprint of the nine retention ponds would be 0.9260 ac (1.4% of the present area in lawns). The construction of the nine retention ponds would convert to groundwater recharge 0.1402 ac·ft annually (28.1% of current export) and 6.2083 ac·ft following a 100-year 24-event (26.6% of current export) (see Table 4). Note that it could take up to 29 days for all retention ponds to completely drain after they were completely filled following a 100-year 24-hour precipitation event (see Table 4).
Table 4. Characteristics of proposed rectangular French drains. Watershed Identifier1 Depth × Width × Length (ft×ft×ft) Groundwater Recharge: 100-Year 24-Hour Event (ac·ft) Time to Drain (h) Average Annual Groundwater Recharge (ac·ft) 1 6.6 × 40 × 270 1.7947 298 0.0387 2 6.6 × 21 × 55 0.2031 182 0.0033 3 6.6 × 95 × 96 1.4297 699 0.0309 12 6.6 × 30 × 63 0.3284 153 0.0071 16 6.6 × 25 × 35 0.1385 141 0.0118 19 6.6 × 15 × 15 0.0382 203 0.0005 21 6.6 × 55 × 174 1.2490 172 0.0260 24 6.6 × 55 × 85 0.7664 297 0.0164 31 5 × 45 × 45 0.2604 221 0.0054 Total 6.2083 0.1402 1See Fig. 5.
Figure 5. Nine French drains could be constructed, which would convert to groundwater recharge 0.1402 ac·ft annually (28.1% of current export) and 6.2083 ac·ft following a 100-year 24-hour event (26.6% of current export).
4. Recommendations
We are recommending construction on the UVU Main Campus of a series of nine French drains, which would occupy 1.4% of the present area in lawns and which would reduce annual stormwater export by 28.1% and export of stormwater following a 100-year 24-hour precipitation event by 26.6%. Any further reduction in stormwater export would require much more radical changes in campus land use, such as disruption of current paved areas, restoration of vegetation, or creation of artificial wetlands.
Acknowledgements. This research was carried out as a course project for ENVT 4890 Surface Water Hydrology at Utah Valley University. We are grateful to Jim Michaelis (UVU Associate Vice-President – Facilities Planning), Frank Young (UVU Senior Director – Engineering / Space), Russ Clegg (UVU Lead – Watermaster), Rick Sabey (Storm Water Field Supervisor, City of Orem), and Steven Johnson (Engineering Specialist, City of Orem) for information and discussions. We thank Michael Brown for assistance with the graphics.
Appendix: Time to Fill and Drain a Retention Pond
Suppose that a rectangular pond of width W, length L and depth D is excavated into a permeable soil of saturated hydraulic conductivity K. Stormwater enters the retention pond at a uniform flow rate Qin = Vr/Δt, where Vr is the total volume of runoff generated over a
time period of interest Δt. As stormwater enters the pond, the pond simultaneously drains into the surrounding soil. The purpose of this appendix is to address the following
questions:
1) What is the time required to fill an initially dry rectangular retention pond? 2) What is the total capacity of a rectangular retention pond, which is the sum of the storage capacity (volume of the pond) and the infiltration capacity (volume of water that drains out of the pond while the pond is being filled)?
3) What is the time required to drain a full rectangular pond after stormwater ceases entering the pond?
4) What are the equivalents to the above answers for a retention pond of arbitrary shape?
It is assumed that the flux of water out of the pond is equal to the saturated hydraulic conductivity. This assumption is equivalent to the assumption of unit hydraulic gradient, which is also equivalent to the assumption of a constant infiltration rate for a given Hydrologic Soil Group. Given the above assumption,
𝑑𝑉
𝑑𝑡 = 𝑄!"− 𝐾𝐴 (A1)
where V is the volume of water in the pond and A is the surface area of water in contact with the surrounding soil. The volume V and area A are given by
𝑉 = 𝑊𝐿ℎ 𝑡 (A2)
𝐴 = 𝑊𝐿 + 2𝑊ℎ 𝑡 + 2𝐿ℎ(𝑡) (A3)
where h(t ) is the height of water in the pond. Substituting Eqs. (A2) and (A3) into (A1) yields the differential equation
𝑊𝐿𝑑ℎ
Then integrating (A4) from h(t = 0) = 0 to h(t = tfill) = D yields 𝑡!"## = 𝑊𝐿 2𝐾(𝑊 + 𝐿)ln 𝑄!"− 𝐾𝑊𝐿 𝑄!"− 𝐾𝑊𝐿 − 2𝐾 𝑊 + 𝐿 𝐷 , (A5)
where tfill is the time required to fill the pond. If Δt = tfill (the pond completely fills
within the time period of interest), then the total capacity C of the pond is given by 𝐶 = 𝑄!"𝑊𝐿 2𝐾(𝑊 + 𝐿)ln 𝑄!"− 𝐾𝑊𝐿 𝑄!"− 𝐾𝑊𝐿 − 2𝐾 𝑊 + 𝐿 𝐷 , (A6) so that 𝐼𝐶 = 𝐶 − 𝑊𝐿𝐷, (A7)
where IC is the infiltration capacity.
The time to drain a completely full rectangular pond, tdrain, can be obtained by setting
Qin = 0 in (A4) and integrating from h(t = 0) = D to h(t = tdrain) = 0 to yield
𝑡!"#$%=
𝑊𝐿 2𝐾(𝑊 + 𝐿)ln
2𝐷 𝑊 + 𝐿 + 𝑊𝐿
𝑊𝐿 . (A8)
Suppose that the retention pond is now a vertical cylinder with height h and with base and top of arbitrary shape with perimeter P and area A. Then the equivalents to Eqs. (A5) – (A8) are 𝑡!"## = 𝐴 𝐾𝑃ln 𝑄!"− 𝐾𝐴 𝑄!"− 𝐾(𝐴 + 𝑃ℎ) , (A9) 𝐶 =𝑄!"𝐴 𝐾𝑃 ln 𝑄!"− 𝐾𝐴 𝑄!"− 𝐾(𝐴 + 𝑃ℎ) , (A10) 𝐼𝐶 = 𝐶 − 𝐴ℎ, (A11) 𝑡!"#$%= 𝐴 𝐾𝑃ln 𝐴 + 𝑃ℎ 𝐴 . (A12)
Finally consider an arbitrary cone-shaped pond. Assume that the pond can be
approximated by a stack of N vertical cylinders of base and top of arbitrary shape in which the top of one cylinder is wholly contained within the base of the overlying cylinder. If the cylinders are numbered up from the bottom (j = 1 is the bottom cylinder), then
𝑡!"##,! = 𝐴! 𝐾𝑃!ln 𝑄!"− 𝐾𝐴! 𝑄!"− 𝐾(𝐴!+ 𝑃!ℎ!) , (A13) and 𝑡!"##,! = 𝐴! 𝐾𝑃!ln 𝑄!"− 𝐾(𝑃!!!ℎ!!!+ 𝑃!!!ℎ!!!+ ⋯ + 𝑃!ℎ!+ 𝐴!) 𝑄!"− 𝐾(𝑃!ℎ!+ 𝑃!!!ℎ!!!+ ⋯ + 𝑃!ℎ!+ 𝐴!) , (A14) where Aj is the area of the base or top of cylinder j, hj is the height of cylinder j, Pj is
the perimeter of cylinder j, and tfill,j is the time required to fill cylinder j. The time required
to fill the entire pond is then
𝑡!"## = 𝑡!"##,!+ 𝑡!"##,! + ⋯ + 𝑡!"##,!. (A15)
References
Elrick, D. E. and W. D. Reynolds, 1986: An analysis of the percolation test based on three-dimensional, saturated-unsaturated flow from a cylindrical test hole. Soil Science, 142, 308-321.
King Engineering, 2010: UVU NCAA Track and Field.
NOAA-NWS (National Oceanic and Atmospheric Administration – National Weather Service), 2012: Precipitation Frequency Data Server,
http://hdsc.nws.noaa.gov/hdsc/pfds/pfds_map_cont.html?bkmrk=ut.
NOAA-NCDC (National Oceanic and Atmospheric Administration – National Climatic Data Center), 2012: Climate Data Online: Text and Map Search, http://www.ncdc.noaa.gov/cdo-web/.
NRCS (Natural Resources Conservation Service), 2004: National Engineering Handbook, Part 630 Hydrology. United States Department of Agriculture, Natural Resources Conservation Service. NRCS (Natural Resources Conservation Service), 2012: Web Soil Survey,
http://websoilsurvey.nrcs.usda.gov.
SoilMoisture Equipment, 1986: 2800 K1 Guelph Permeameter Operating Instructions. SoilMoisture Equipment, Santa Barbara, CA.
Young, F., 2012: Personal communication.