Synthesis and Characterization
of Some Nanostructured
Materials for Visible Light-driven
Photo Processes
Linköping Studies in Science and Technology Dissertation No. 2059
Rania Elhadi Adam
Ra ni a E lh ad i A da m S yn th es is a nd C ha ra cte riz ati on o f S om e N an os tru ctu re d M ate ria ls f or V isib le L ig ht-dri ve n P ho to P ro ce ss es 20 20
FACULTY OF SCIENCE AND ENGINEERING
Linköping Studies in Science and Technology, Dissertation No. 2059, 2020 Department of Science and Technology
Linköping University SE-581 83 Linköping, Sweden
Linköping University Studies in Science and Technology Dissertation No. 2059
Synthesis and Characterization of
Some Nanostructured Materials for
Visible Light-driven Photo Processes
Rania Elhadi Adam
Department of Science and Technology Division of Physics, Electronics and Mathematics
Linköping University, Sweden Norrköping 2020
Cover photo by Thor Balkhed, the photodegradation process of the Congo red dye using nanocomposite.
During the course of the research underlying this thesis, Rania Elhadi Adam was enrolled in Agora Materiae, a multidisciplinary doctoral program at Linköping University, Sweden.
Synthesis and Characterization of Some Nanostructured Materials for Visible Light-driven Photo Processes.
© Rania Elhadi Adam, 2020
Printed in Sweden by LiU Tryck, Linköping, Sweden, 2020 ISSN 0345-7524
ISBN 978-91-7929-878-4
Dedicated to My family
i
Abstract
Nanostructured materials for visible light driven photo-processes such as photodegradation of organic pollutants and photoelectrochemical (PEC) water oxidation for hydrogen production are very attractive because of the positive impact on the environment. Metal oxides-based nanostruc-tures are widely used in these photo-processes due to their unique prop-erties. But single nanostructured metal oxide material might suffer from low efficiency under visible light. This fact make it important to have an efficient and reliable nanocomposite for the photo-processes. The combi-nation of different nanomaterials to form a composite configuration can produce a material with new properties. The new properties which are due to the synergetic effect, are a combination of the properties of all the counterparts of the nanocomposite.
Zinc oxides (ZnO) have unique optical and electrical properties which grant it to be used in optoelectronics, sensors, solar cells, nanogenerators, and photocatalysis activities. Although ZnO absorbs visible light from the sun due to the deep level band, it mainly absorbs ultraviolet wavelengths which constitute a small portion of the whole solar spectrum range. Also, ZnO has a problem with the high recombination rate of the photogener-ated electrons. These problems might reduce its applicability to the photo-process. Therefore, our aim is to develop and investigate different nanocomposites materials based on the ZnO nanostructures for the en-hancement of photocatalysis processes using the visible solar light as a green source of energy. Two photo-processes were applied to examine the developed nanocomposites through photocatalysis: (1) the photodegra-dation of organic dyes, (2) PEC water splitting. In the first photo-process, we used the ZnO nanoparticles (NPs), Magnesium (Mg)-doped ZnO NPs,
ii and plasmonic ZnO/graphene-based nanocomposite for the decomposi-tion of some organic dyes that have been used in industries. For the sec-ond photo-process, ZnO photoelectrode composite with different silver-based semiconductors to enhance the performance of the ZnO photoelec-trode was used for PEC reaction analysis to perform water splitting. The characterization and photocatalysis experiment results showed re-markable enhancement in the photocatalysis efficiency of the synthesized nanocomposites. The observed improved properties of the ZnO are due to the synergetic effect caused by the addition of the other nanomaterials. Hence, the present thesis attends to the synthesis and characterization of some nanostructured materials composite with ZnO that are promising candidates for visible light-driven photo-processes.
Keywords: ZnO, Nanoparticles, Nanocomposites, Heterostructures, Pho-tocatalysis.
iii
Acknowledgement
This thesis has been come out due to the help, support, guidance, and collaboration from many people. Some of them are mentioned here: I would like to express my extreme thanks and gratitude to my supervisor
Omer Nour for his support, guidance, encouragement and help during my PhD research. Also, my sincere gratitude to my co-supervisor
Mag-nus Willander for his monitoring, comments, and suggestions throughout my PhD study.
I would like to thank my co-authors Galia Pozina, and Xianjie Liu for their collaboration, useful comments and correcting of some of my man-uscripts used in this thesis.
Special thanks to Michael Hörnquist for taking care of the FEM divi-sion at ITN and all his support.
I would like to thank all the present and past members of the physical
electronics and nanotechnology group for their collaboration, use-ful discussions and the funny moments that we spent together.
My deepest appreciation to our Late research visitor Mahsa
Pirhash-emi for her collaboration, help and friendship.
I would like to thank all the team taking care of lab management and spe-cial thanks to Anna Malmström, Lars Gustavsson, Meysam
iv I also would like to especially thank Ann-Christin Norén for all the re-search and study administrative work.
I would like to express my thanks to Karina Malmström for taking care of all the administrative work of my thesis defense. Also, I would like to thank her for taking care of all Agora Materia School administrative work. Also, I would like to thank the present and past Agora Materia School
members for the interesting time that we spent during my PhD, and special thanks to the leaders of Agora Materia School Per-Olof Holtz and Caroline Brommesson for organizing all the fantastic events. I appreciate the National Energy Research Centre (Sudan),
Minis-try of Higher Education and Scientific Research (Sudan) and
Lin-köping University for the financial support.
I would like to extremely thank my parents for their support, unlimited love, and prayers from the faraway distance to keep me going on. I sincere appreciate my sister Reem and my brothers Ammar, Asim and
Ah-med for their support, love, and encouragements.
Finally, I would like to express my deepest gratitude to my small family, my husband Abdelgadir for the encouragement, patient, tolerance, love and being beside me during all the hard work of my PhD. I appreciate my lovely daughter Sireen who made our life and stay in Sweden more tasty.
Norrköping, April 2020 Rania Elhadi Adam
v
Contents
1 Introduction ... 1
1.1 Global Energy and Environmental Issues ... 1
1.2 Photocatalysis ... 2
1.3 Approaches for an Efficient Photocatalysis ... 3
2 Materials and Synthesis Methods ... 5
2.1 ZnO ... 5
2.1.1 Synthesis of the ZnO NPs ... 7
2.2 Mg-doped ZnO NPs ... 9
2.2.1 Synthesis of Mg-doped ZnO NPs ... 10
2.3 Graphene-based ZnO ... 10
2.3.1 Synthesis of the ZnO/GR ... 11
2.4 Silver-based ZnO Materials ...12
2.4.1 Synthesis of ZnO/GR/Ag/AgI ... 13
2.4.2 Synthesis of ZnO photoelectrode ... 14
2.4.3 Synthesis of ZnO/Ag2CrO4 photoelectrode ... 15
2.4.4 Synthesis of ZnO/Ag/Ag2WO4 photoelectrode ... 16
2.4.5 Synthesis of ZnO/Ag2WO4/AgBr photoelectrode... 17
3 Photocatalysis Theories ... 19
3.1 Photodegradation of Organic Dyes ...19
3.1.1 Kinetic analysis ... 23
3.1.2 Photodegradation Efficiency ... 24
3.2 Photoelectrochemical Water Splitting ... 25
3.2.1 PEC Measurements Performance ... 28
3.2.2 Photon to current conversion efficiency (IPCE) ... 31
4 Characterization Techniques ... 33
4.1 Instruments ... 33
vi
4.1.2 Filed emission scanning electron microscopy (FE-SEM) 34
4.1.3 Transmission electron microscopy (TEM) ... 36
4.1.4 X-ray photoelectron spectroscopy (XPS) ... 38
4.1.5 UV-Vis spectroscopy ... 39
4.1.6 Cathodoluminescence spectroscopy (CL) ... 41
4.2 Photodegradation set up ... 43
4.3 Three Electrodes Set-up ... 44
5 Results and Findings ... 45
5.1 Photodegradation of Organic Dyes ... 45
5.1.1 ZnO NPs ... 45
5.1.2 Mg-doped ZnO NPs... 50
5.1.3 ZnO/GR/Ag/AgI nanocomposite ... 54
5.2 ZnO-based photoelectrode for water oxidation ... 58
5.2.1 ZnO/Ag2CrO4 for enhanced visible-light PEC ... 59
5.2.2 ZnO/Ag/Ag2WO4 with plasmonic behaviour for enhanced PEC 65 5.2.3 ZnO/Ag2WO4/AgBr ... 70
6 Conclusion and Future work ... 75
6.1 Conclusion ... 75
6.2 Future Work ... 78
vii
List of papers included in this thesis
1. R. E. Adam, G. Pozina, M. Willander, O. Nur, Synthesis of ZnO nanoparticles by co-precipitation method for solar driven photo-degradation of Congo red dye at different pH, Photonics and Nanostructures - Fundamentals and Applications. 32 (2018) 11– 18. https://doi.org/10.1016/j.photonics.2018.08.005.
My contribution: I prepared the samples, performed all photodeg-radation experiments, UV-Vis, and XRD. I was part of the SEM and CL measurements. I wrote the first draft of the manuscript. 2. R. E. Adam, H. Alnoor, G. Pozina, X. Liu, M. Willander, O. Nur,
Synthesis of Mg-doped ZnO NPs via a chemical low-temperature method and investigation of the efficient photocatalytic activity for the degradation of dyes under solar light, Solid State Sciences. 99 (2020) 106053. https://doi.org/10.1016/j.solidstatesci-ences.2019.106053.
My contribution: I prepared the samples, performed all photodeg-radation experiments, UV-Vis, and XRD. I was part of the SEM, EDX and CL measurements. I did not perform the XPS. I wrote the first draft of the manuscript.
3. R. E. Adam, E. Chalangar, M. Pirhashemi, G. Pozina, X. Liu, J. Palisaitis, H. Pettersson, M. Willander, O. Nur, Graphene-based plasmonic nanocomposites for highly enhanced solar-driven pho-tocatalytic activities, RSC Adv. 9 (2019) 30585–30598. https://doi.org/10.1039/C9RA06273D.
My contribution: I prepared the samples, performed all photodeg-radation experiments, UV-Vis, and XRD. I was part of the SEM
viii and CL measurements. I did not perform XPS and TEM. I wrote the first draft of the manuscript.
4. M. Pirhashemi, S. Elhag, R. E. Adam, A. Habibi-Yangjeh, X. Liu, M. Willander, O. Nur, n–n ZnO–Ag2CrO4 heterojunction
photoe-lectrodes with enhanced visible-light photoelectrochemical prop-erties, RSC Advances. 9 (2019) 7992–8001. https://doi.org/10.1039/C9RA00639G.
My contribution: I was part of all the samples preparation, PEC measurements, UV-Vis, XRD, and SEM. I did not perform XPS. 5. R. E. Adam, M. Pirhashemi, S. Elhag, X. Liu, A. Habibi-Yangjeh,
M. Willander, O. Nur, ZnO/Ag/Ag2WO4 photo-electrodes with
plasmonic behaviour for enhanced photoelectrochemical water oxidation, RSC Advances. 9 (2019) 8271–8279. https://doi.org/10.1039/C8RA10141H.
My contribution: I prepared the samples, performed all PEC measurements, UV-Vis and XRD. I was part of the SEM and EDX measurements. I did not perform the XPS. I wrote the first draft of the manuscript.
6. R. E. Adam, E. Mustafa, X. Liu, M. Willander, O. Nur, Visible- light driven photoelectrochemical performance of the novel ZnO/Ag2WO4/AgBr photoelectrodes.
Manuscript
My contribution: I prepared the samples, performed all PEC measurements and characterization, I wrote the first draft of the manuscript, and at present complementary experiments are on-going work.
ix
List of papers not included in this thesis
1. Light-induced high-spin state in ZnO nanoparticles, Adrien Sa-voyant, M Rollo, Maxime Texier, Rania E. Adam, Sandrine Ber-nardini, Olivier Pilone, Olivier Margeat, Omer Nur, Magnus Wil-lander, and Sylvain Bertaina. Nanotechnology (IOP) 31 (2020) 095707, https://doi.org/10.1088/1361-6528/ab57f1.
Conference papers
2. Zinc oxide nanostructures and its nano-compounds for efficient visible light photo-catalytic processes, Rania E. Adam, Hatim Alnoor, Sami Elhag, Omer Nur, and Magnus Willander. Proc. SPIE 10105. Oxide-based Materials and devices VIII (2017) 101050X. doi: 10.1117/12.2254872
3. Optical and magneto-optical properties of zinc-oxide nanostruc-tures grown by the low temperature chemical route, M. Willander, H. Alnoor, A. Savoyant, Rania E. Adam, and O. Nur, Proc. SPIE 10533, Oxide-based Materials and Devices IX (2018) 105331D. doi: 10.1117/12.2288970.
4. Photocatalytic properties for different metal-oxide nanomateri-als, Rania E. Adam, Elfatih Mustafa, Sami Elhag, Omer Nur, and Magnus Willander. Proc. SPIE 10919, Oxide-based Materials and Devices X (2019) 1091925D. doi:10.1117/12.2517436.
1
1 Introduction
1.1 Global Energy and Environmental Issues
The fast development in our society due to the industrialization led us to a great challenge to decrease the pollution and fossil fuel usage [1]. First, the textile industry has been using a large number of organic dyes and their wastewater should be treated before exposed to the environment for reuse. The conventional method used for wastewater treatment might be expensive, not very efficient or could generate toxic secondary pollutants [2]. Therefore, an efficient, low cost and environmentally friendly meth-ods for organic dye degradation are highly needed. Secondly, at present fossil-based fuel is the main source of energy and utilized at a high amount of consumption of which has led to global warming and climate change issues [1–4]. However, fossil fuels are depleting and its availabil-ity as a source of energy is decreasing rapidly. Accordingly, an urgent need for clean renewable sources of energy are required.
Energy from the sun is well known as a clean renewable energy source with very high potential, and it could be utilized for diverse applications. Although solar energy has been used in the household sector as well as in the industrial sector for a variety of purposes such as electrification, heat-ing, coolheat-ing, cooking and in space technology [5], still the consumption of solar energy and others renewable energy is very little compared to fossil fuel consumption. This fact is shown in the world´s total primary energy consumption diagram in Figure 1-1. Recently, solar energy has considered for photocatalysis applications including; water antibacterial disinfection, carbon dioxide reduction, pollutant degradation and
photo-2 catalytic water splitting to produce hydrogen (H2)[6]. Among these
pho-tocatalysis applications, two processes were investigated in this work (1) degradation of organic pollutants and (2) PEC water splitting, which could provide an efficient solution for environmental issues and energy sustainability via a direct harnessing of the solar energy [7–9].
1.2 Photocatalysis
Nanostructured materials based on metal oxide semiconductors that ir-radiated to a suitable solar light spectrum such as ultraviolet (UV) or vis-ible light, could become a source of photogenerated electrons and holes and then to active oxygen species [10]. This unique property is the so-called photocatalysis which can be applied to a variety of environmentally friendly mechanisms.
Figure 1-1 Total world primary energy consumption by fuel in 2018 (from world energy consumption Wikipedia).
3
1.3 Approaches for an Efficient Photocatalysis
Since the first reported photocatalysis activities for water splitting to pro-duce H2 in 1972 using titanium dioxide (TiO2) semiconductor [11], a great interest in metal oxides nanostructures ( NSs) have attracted re-searcher to develop and investigate semiconductors NSs for photocataly-sis activities. NSs semiconductors have shown an improvement in photo-catalysis due to their large surface area to volume ratio which provides high efficiency in photocatalysis applications.
Zinc oxide (ZnO) in its NSs forms has a potential for photocatalysis ap-plications due to its unique properties such as; high redox potential to drive the photocatalysis reaction, high chemical and physical stability, non-toxicity, abundancy, different methods for synthesis, and different NSs morphologies can be utilized [12–15].
However, the absorption in the UV range only, the photo corrosion under extremely high or low pH, and the massive recombination rate during the photocatalysis process are the main barriers for the ZnO applicability [16]. These problems could be solved by doping where additional atoms can be introduced into the ZnO such as metals and transition metals, which could reduce the recombination rate of the ZnO and then enhances the photocatalytic performance [17,18]. Also, surface modification of the ZnO by combination with another semiconductor, deposition of noble metals, or hybridization with graphene [19] to form a new nanocompo-site, can supress the recombination rate, shift the absorption into the vis-ible light region and improve the electronic properties. Thus, enhances the photocatalytic activities.
Therefore, the goal of this thesis is to synthesis and characterization of ZnO NSs and some efficient nanocomposite materials based on ZnO and to use them as photocatalysts for photodegradation of organic dyes and
4 PEC water oxidation process. This goal was achieved by using different synthesis methods including the co-precipitation method, the hydrother-mal chemical growth and the ultrasonic irradiation assistance. Also, dif-ferent characterization techniques were used for the nanocomposite’s analysis. These techniques are for optical, structural, morphological and chemical composition characterizations. In addition to that the photo-catalytic experiments for photodegradation of organic dyes and PEC wa-ter splitting were performed using simulated solar light.
5
2 Materials and Synthesis Methods
2.1 ZnO
ZnO NSs are very attractive semiconductor for different photocatalysis processes because it possesses unique optical and electrical properties [20]. ZnO is naturally n-type, binary compound semiconductor with a wide bandgap (3.37 eV) and crystallizes in a wurtzite structure [16,20] as shown in Figure 2-1. ZnO possesses emission/absorption bands in the wavelengths range of the UV and visible light [21], which makes it suita-ble for photocatalysis applications. The deep level emission is originating from different native point defects (intrinsic impurities) such as oxygen vacancies (VO), oxygen interstitial (Oi), zinc vacancies (VZn), , zinc
inter-stitial (Zni), oxygen and zinc anti-site, and other native defect clusters (a
combination of two different native pint defects) [22]. The native point defects could be created during the growth process of the ZnO NSs and greatly reliant on the method and the parameters of the growth [23, 24]. The presence of the native point defects provide ZnO with relatively high electron mobility (⁓ 300 cm2 V-2 s-1 for the bulk ZnO and ⁓ 1000 cm2 V s -1 for ZnO NSs [25, 26]), which enhances the electrons transfer
capabili-ties and provide a considerable photocatalysis performance [16, 25]. Moreover, ZnO has a high redox potential that can drive various reduc-tion and oxidareduc-tion reacreduc-tions during the photocatalysis process, and its wide bandgap offers an excellent driving force to induce the redox reac-tion [16]. In addireac-tion to that, ZnO NSs have the advantage of being grown via a variety of methods with different morphologies, besides other ben-efits such as non-toxicity, physical and chemical stability and abundancy [12–15].
6 All the above-mentioned properties make ZnO NSs are appropriate can-didates for photocatalysis applications.
Figure 2-1 Wurtzite structure of ZnO ( https://en.wikipe-dia.org/wiki/Zinc_oxide).
Although, ZnO have a variety of unique properties which give it high po-tential on the photocatalysis, ZnO have some drawbacks which scale down its performance in photocatalysis. ZnO absorbs mainly the UV light which compromises a small portion of the solar spectrum, and this makes it expensive when using external sources of UV light to excite the bandgap of the ZnO in order to produce electron-hole pairs. Also, the high recom-bination rate in the ZnO prevent the path of electron-hole outward, and then reduce the photocatalysis efficiency. The greatest drawback is that ZnO NSs get photo corrosion when immersed in solvent under the solar light due to hole trapping on the surface which is the most common issue for many NSs materials for photocatalysis [19, 27]. Another problem with the ZnO is the decomposition of the ZnO under extremely high or low pH values [19]. Many studies showed that ZnO can dissolve in high acidic media or in strong basic media under the illumination of light or under-voltage biases [25, 26].
Z nO
7 Many research works concerning overcoming these issues with ZnO to improve its photocatalysis performance through composite with other materials focusing on different approaches such as doping etc.. have been published [29–33]. Deposition of metals [34], composite ZnO with other semiconductors, and hybridization of the ZnO with graphene are some examples [35–39]. Therefore, we are investigating different strategies for coupling ZnO NSs with other nanomaterials and produce a novel new nanocomposite for the enhancement of the ZnO photocatalyst perfor-mance to degrade organic dyes and for water splitting through water ox-idation.
2.1.1 Synthesis of the ZnO NPs
Many methods can be applied for synthesis of ZnO NPs for the degrada-tion of organic dyes which include the hydrothermal, sol-gel, solvother-mal, and co-precipitation methods [38, 39]. Using the different methods and different growth parameters will lead to the synthesis of different ZnO NPs sizes and shapes. Among these methods, the co-precipitation is favourable because it is simple, it only requires a source of zinc and a pre-cipitating agent. Then different parameters such as the precursor concen-tration, time of growth and temperature could be applied to have ZnO NPs with various shapes and sizes. Different synthesis methods for ZnO NPs with different precursors and temperatures are presented in Table 2-1.
8
Table 2-1 Summary of different methods, precursors and temp. of ZnO NPs synthesis.
In this thesis ZnO NPs were synthesized by co-precipitation method as follows: we used 4.39 g (0.1 M) of the zinc acetate dihydrate (Zn(CH3COO)2∙2H2O) with 100 ml deionized (DI) water for the zinc
pre-cursor . Another solution was prepared using a 1.599 g (0.2 M) of sodium hydroxide (NaOH) dissolved in DI water. The two solutions were mag-netically stirred for 10 minutes, then they were poured into one beaker and kept under magnetic stirring for 2 hours at 750 rpm and temperature of 60 ºC on a hot plate [20, 42]. By using centrifugation for 2 minutes at 4500 rpm, the precipitating product was separated from the solution [20, 42]. The precipitate was washed with DI for several times then one time
Synthesis method Precursors Reaction temperature Reaction time Further heating References precipitation Zinc acetate dihydrate
Ammonia
85 °C 3-65 min. Drying 60°C 10 h
[40]
precipitation Zinc nitrate hexahydrate Sodium hydroxide
25 °C 2h Drying 100 °C 2 h
[41]
Solvothermal Zinc acetate dihydrate Triethanolamine Methanol
150 °C 18 h Drying 60 °C overnight
[42]
Hydrothermal Zinc acetate dihydrate Methanol
150 °C 6 h Air drying 2 h
[43]
Hydrothermal Zinc chloride Sodium hydroxide
100-220 °C 5-10 h Drying at room temp.
[44]
Thermolysis Zinc acetate dihydrate 550 °C 10 h - [45] Microwave
assisted
Zinc acetate dihydrate Ethylene glycol
- 1 h Microwave irradiation 200-600 W
9 with acetone to remove undesired particles. Finally, ZnO NPs was ob-tained after drying the precipitating product at 75 ºC for 6 hours in a pre-heated oven [20,42,43]. It is worth to note that the alkaline ratio to Zn2+
is important for the ZnO NPs formation, thus the number of moles of OH- to Zn2+ should be 1: 2 or higher [44]. This is because the growth of
the ZnO starts by the precipitation of zinc hydroxide (Zn(OH)2), then
con-verted to the ZnO NPs according to the following chemical reaction [49, 50]:
𝑍𝑛(𝐶𝐻3𝐶𝑂𝑂)2∙ 2𝐻2𝑂 + 2𝑁𝑎𝑂𝐻 → 𝑍𝑛(𝑂𝐻)2… … … . . (2-1) 𝑍𝑛(𝑂𝐻)2→ 𝑍𝑛𝑂 + 𝐻2𝑂 … … … . (2-2)
2.2 Mg-doped ZnO NPs
In order to utilize the photocatalysis more efficiently, it is necessary to synthesis an efficient photocatalysts under solar light [47]. Some ele-ments such as (Mg, Cd, Co, and Mn) can be used as a dopant to improve the photocatalysis activities of the ZnO under the illumination of solar light [51, 52]. Among these elements, magnesium (Mg) is attractive for doping ZnO because of the similar ionic radius (0.57 and 0.60 Å for Mg and Zn respectively), thus the high probability of incorporation of Mg2+
into the ZnO crystal lattice is expected. This incorporation will tune the bandgap of the ZnO and then increase the absorption of light which im-proves the photocatalytic efficiency of organic dyes[17, 53–55]. Also, the incorporation of Mg2+ into the ZnO will cause superior textural properties
and efficient separation of electron-hole which enhances the solar-driven photocatalytic efficiency [47].
10
2.2.1 Synthesis of Mg-doped ZnO NPs
For the synthesis of Mg-doped ZnO NPs, a diluted solution of magnesium nitrate hexahydrate Mg (NO3)26H2O with different atomic
concentra-tions relative to Zn (0, 3, 5, and 7%) were prepared then mixed with 0.2 M of NaOH solution and stirred overnight at room temperature [42]. Then, 0.1 M of the (Zn(CH3COO)2∙2H2O) solution was added to the above
mixture and stirred at 750 rpm for 2 hours under a temperature of 60 ºC in a hot plate. Then, the precipitating product was separated by using cen-trifugation at 4500 rpm for 2 minutes then it was washed several times with DI water and one time with acetone. Mg-doped ZnO NPs with dif-ferent doping concentrations (0, 3, 5, and 7%) were obtained by drying of the precipitate product into a preheated oven at 75 ºC for 6 hours [25, 47].
2.3 Graphene-based ZnO
Graphene (GR) is a two-dimensional (2D) material and its carbon atoms are assembled in a honeycomb lattice structure formed by sp2 hybridized
atomic orbital consisting of sigma bonds between carbon atoms and pi pond out of the plane [36,51,52] as shown in Figure 2-2. GR possesses many interesting electronic properties, such as high charge carrier mo-bility up to 106 cm2V-1s-1 with low resistivity (0.1-6 KΩ/□), relatively very
large surface area to volume ratio, and high optical transparency over a very large spectral range from IR to UV [33–37, 57], which makes it an excellent candidate for enhancing the performance of photocatalysts due to the improved separation efficiency of photogenerated electron-hole pairs during the photocatalytic processes [33, 34, 57–61]. Particularly, ZnO/GR nanocomposite is interesting due to the capability of inhibiting
11 the recombination of photogenerated charge carriers during the photo-catalytic process. It is worth to note that the amazing properties of the honeycomb carbon structures are not really new, it is abundant and nat-urally occurring in the form of graphite which has been used as minerals for a long time [58]
Figure 2-2 (a) Graphene lattice structure, (b) SP2 hybridized orbitals of
car-bon atoms.
2.3.1 Synthesis of the ZnO/GR
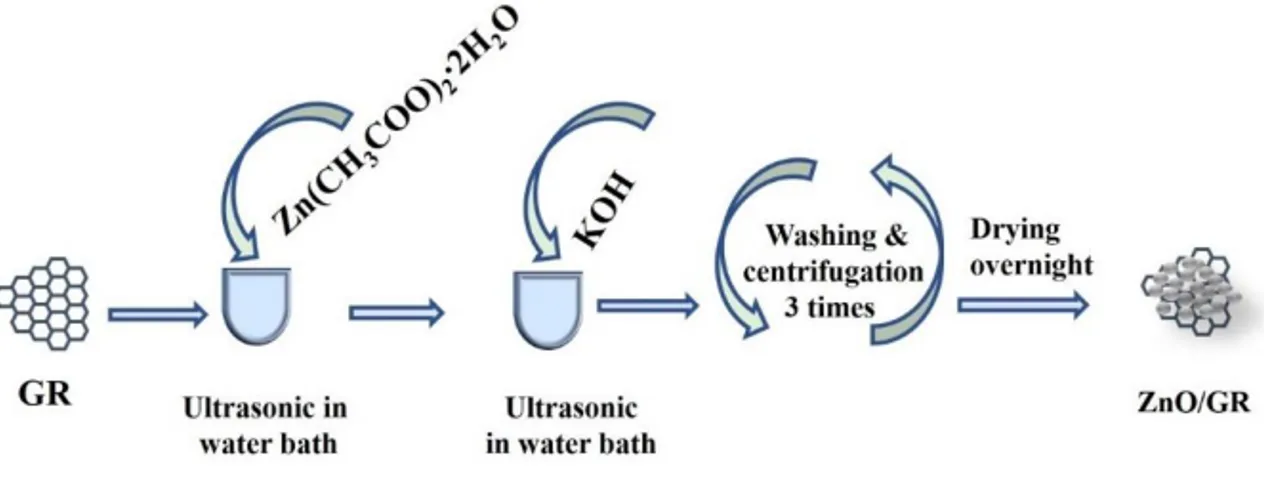
The ZnO/GR nanocomposite was synthesized according to our published work [52], by the dispersion of GR powder (10 mg.l-1) into
Zn(CH3COO)2∙2H2O solution (0.01 M). Then potassium hydroxide
(KOH) solution (0.05 M) was added drop wise under ultrasonic water bath for 10 minutes at 60 °C. Then, by centrifugation at 3000 rpm for 10 minutes the precipitating product was separated. Afterword, the precipitate was washed with DI water and acetone three times. The ZnO/GR nanocomposite was obtained after drying the precipitate overnight in a preheated oven at 120 °C. The preparation process of the ZnO/GR nanocomposite is presented in Figure 2-3.
12
2.4 Silver-based ZnO Materials
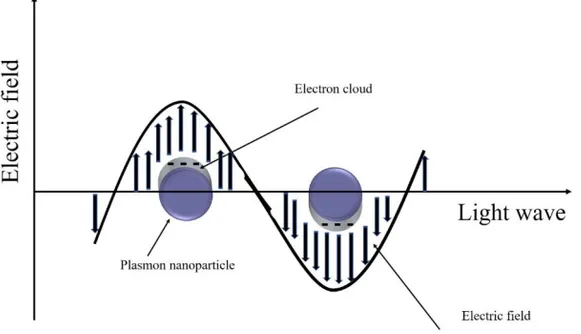
Ag compounds materials have been considered as a promising candidate to be used as co-catalysts to enhance photocatalytic efficiency [59]. The deposition of Ag-materials on the surface of ZnO can improve the photo-catalytic performance due to the surface plasmon resonance (SPR) effect of metallic silver [60]. The SPR is a collective oscillation of electrons in-duced by the electromagnetic field of the incident visible light which en-hances the photocatalytic process [60,61] (see Figure 2-4) and it depends on the size and shape of the plasmon particles [62]. The existence of the SPR can enhance the absorption of the catalyst by confining or scattering the light into the photocatalyst [61]. Also, the SPR allows absorption of visible light in higher wavelength which then extend the absorption range of the light [61]. Consequently, electronic and photocatalytic properties of the photocatalyst will be improved. Therefore, different Ag-based sem-iconductors were prepared and their characteristics for photocatalysis performance were investigated in this thesis, which includes AgI, Ag2CrO4, Ag2WO4 and AgBr. These Ag- compound semiconductors were
13 nanocomposite with ZnO to produce new heterostructure with effectively enhanced photocatalysis performance.
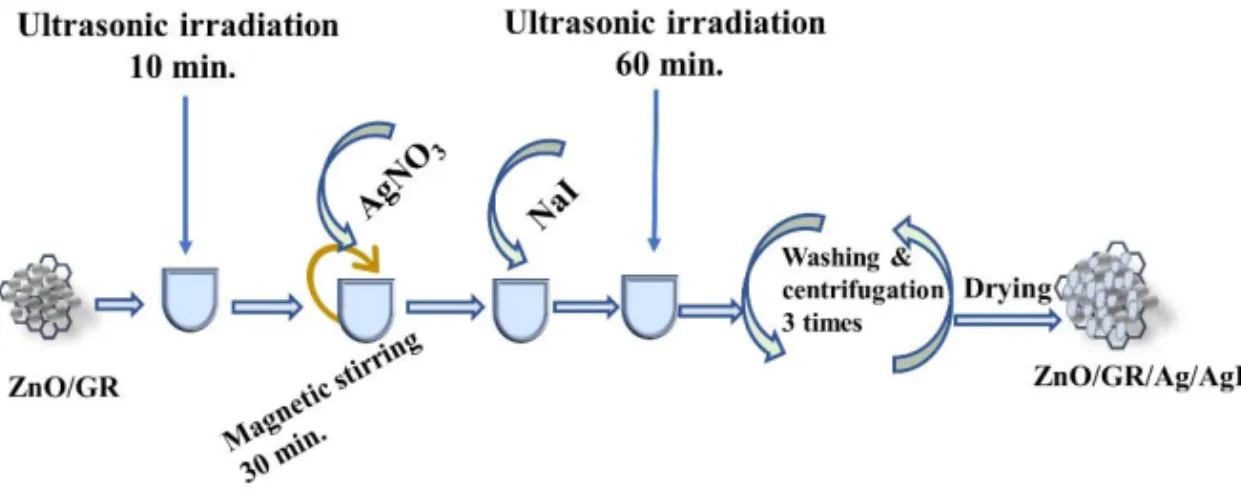
2.4.1 Synthesis of ZnO/GR/Ag/AgI
ZnO/GR/Ag/AgI nanocomposites were synthesized according to our previous published work [52] using different AgI percentage by dispersion of the as-prepared ZnO/GR in a 200 ml of DI water under ultrasonic irradiation for 10 minutes. Then a AgNO3 powder was added to
the mixer and kept under stirring for 30 minutes. Afterword, NaI was dissolved in DI water with three different weight ratios (10%, 20%, and 30%) and added dropwise to the above mixture and kept under ultrasonic irradiation for one hour. By using the centrifugation, the product was separated and washed two times with DI water and one time with acetone to remove any undesired salt. Finally, by drying the product in a preheated oven at 75 °C for 6 hours, the ZnO/GR/Ag/AgI
Figure 2-4 Illustration of the surface plasmon resonance in a plasmon nanoparticles.
14 nanocomposites were obtained successfully. The synthesis process of the ZnO/GR/Ag/AgI nanocomposites are explained in Figure 2-5 [52]. It is worth to note that the Ag particles could be introduced in the nanocomposite during the sample preparation, or during the irradiation of the visible solar light due to the photoreduction reaction.
2.4.2 Synthesis of ZnO photoelectrode
A clean conductive substrate such as Au coated glass or florin tin oxide (FTO) were used to grow ZnO nanorods (NRs) as described in our previ-ous publications [63, 67] throw the following steps:
1. The substrates were cleaned with acetone, isopropanol, and DI water, subsequently using ultrasonic bath for 10 min.
2. Seed solution preparation: 0.03 M potassium hydroxide (KOH) was dissolved in 125 ml methanol and added dropwise into a 0.01 M of Zn(CH3COO)2∙2H2O dissolved in a 65 ml methanol. The mixture was
magnetically stirred at 750 rpm for 2 h in a hot plate at 60 °C. Then the temperature was turned off and the seed solution was kept under magnetic stirring overnight.
15 3. Using spin coating at 3000 rpm for 25 s, the seed solution deposited on to the substrate and this process was repeated three times to obtain good coverage of the ZnO NPs onto the substrate to allow condense growth of the ZnO NRs. Then, the substrates were annealed into an air in an oven at 120°C for 10 min. to let the seeds attached to the sub-strates.
4. The precursor solution of the growth was prepared using equal molec-ular concentrations (0.05 M) of zinc nitrate hexahydrate (Zn (NO₃)₂.6H₂O) and hexamethylenetetramine (HMT) in 100 ml DI wa-ter. The seeded substrates prepared in step 3 were fixed into Teflon samples holder and immersed horizontally facing down in the precur-sor solution. Then the samples were loaded into a preheated oven at 90 °C for 5 hours. After cooling down to room temperature, the sam-ples were washed with DI water and dried with blowing nitrogen.
2.4.3 Synthesis of ZnO/Ag2CrO4 photoelectrode
Silver chromate Ag2CrO4 nanoparticles were deposited over the above
prepared ZnO NRs photoelectrode using successive ionic layer adsorp-tion and reacadsorp-tion (SILAR) method followed by annealing process [63]. SILAR method implies immersion of the substrate into cationic precur-sor, then rinse with DI water, flowed again by immersion into the anionic precursor and then rinse again with DI water to complete one SILAR cy-cle as shown in Figure 2-6. A SILAR cycy-cle can be repeated several times to have enough particles on the ZnO. Herein Ag2CrO4 particles deposit on
the ZnO NRs using the SILAR method at room temperature as follows and as described in our previous work [63]: first ZnO NRs immersed into 0.05 M AgNO3 solution (20 ml) for 2 min. Then the substrates were
16 washed with methanol to remove the excess of regent and dried by blow-ing nitrogen. Secondly, the substrate was immersed int 0.05 M of sodium chromate (Na2CrO4) solution (20 ml) for 2 min., again the sample was
washed and was dried by blowing nitrogen. SILAR cycle was repeated for several times producing dark purple samples. Finally, the prepared ZnO/Ag2CrO4 photoelectrodes were dried for 1 h at 60 °C.
2.4.4 Synthesis of ZnO/Ag/Ag2WO4 photoelectrode
Ag/Ag2WO4 nanoparticles were deposited into the ZnO NRs using the
SILAR method. A 0.05 M solution of Ag(NO)3 and 0.05 M of sodium
tungstate (Na2WO4.2H2O) were used as cationic and anionic aqueous
precursors, respectively as shown in Figure 2-6. ZnO NRs photoelectrode was immersed into the AgNO3 solution (20 ml DI water) solution for 2
minutes to absorb silver ions (Ag+). Then the photoelectrodes were
washed with DI water to remove the excess ions. After that, the photoe-lectrodes were immersed in the Na2WO4.2H2O solution for 2 min. and
17 washed with DI water to complete one SILAR cycle. This cycle was re-peated several times to obtain enough Ag/Ag2WO4 particles on the ZnO
NRs.
2.4.5 Synthesis of ZnO/Ag2WO4/AgBr photoelectrode
AgBr was deposit into ZnO/ Ag/Ag2WO4 photoelectrode by ion exchange
of Ag2WO4 into AgBr using the hydrothermal treatment. First, 0.1 M (0.3
g) of sodium bromide (NaBr) dissolved into 30 ml DI water, then the as-prepared ZnO/Ag/Ag2WO4 was immersed horizontally facing up into the
NaBr solution and it was loaded to a preheated oven at 90 °C for 5 hours. After the photoelectrode was cooled down to room temperature, it was ultrasonically washed with DI water, and dried with blowing nitrogen.
19
3 Photocatalysis Theories
3.1
Photodegradation of Organic Dyes
A catalyst with suitable band edge position is important to perform the photocatalytic reaction. The band edge energy of the ZnO with other in-teresting semiconductors are presented in Figure 3-1, which shows their potentials for photocatalysis activities [6]. According to the positions of the conduction /valence (CB/VB) band and the redox potentials of the reactions, the semiconductors can be strongly oxidative, strongly reduc-tive, or having reasonable oxidation and reduction reaction [6]. The strongly oxidative catalysts have high VB levels for water oxidation reac-tions (e.g. ZnO). Whereas, the strongly reductive catalysts have a high CB level suitable for CO2 reduction reaction and H2 evaluation reaction [64].
However, the CB and VB edge potentials of a semiconductor at zero point charge can be calculated using the electronegativity theory [63, 69, 70]:
𝐸𝑉𝐵= 𝜒 – 𝐸𝑒 + 0.5 𝐸𝑔… … … (3-1)
𝐸𝐶𝐵 = 𝐸𝑉𝐵 – 𝐸𝑔… … … . . (3-2)
where EVB and ECB are the VB and CB edge potentials, χ is the absolute
electronegativity of the semiconductor, Ee is the energy of free electrons
on the hydrogen scale (⁓4.5 eV), and Eg is the bandgap energy of the
20 Therefore, it is possible to calculate the EVB and ECB for the
nanocompo-site materials and propose the photocatalysis mechanism accordingly (more information are provided in paper IV and V [59,67].
Figure 3-1 Band edge energy consideration for some interesting catalysts [6].
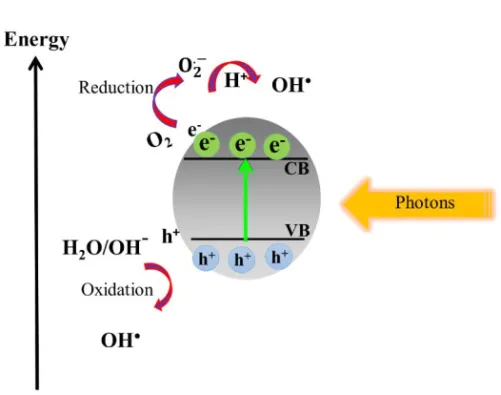
However, in the photocatalysis process for dye degradation the photons with suitable energy for the catalyst bandgap can create electron-hole pairs [9, 19-22]. Electrons in the CB will be captured by oxygen molecules (O2) to produce hydroxyl radical (OH.), superoxide radical (O2.- ), and
hy-droperoxyl radical (HO2) [68].On the other hand, holes in the VB will
react with water molecules (H2O) and hydroxyl ions (OH-) to form OH.
[68]. The overall mechanism of dye degradation by the semiconductor under solar light is presented in Figure 3-2. All radical species that pro-duced will attack the organic dye leading to the decomposition or miner-alization of the dye into a final product according to the following reaction [20].
21 𝐷𝑦𝑒 + (𝑂𝐻.), (𝑂2.−), (𝐻𝑂
2.) → 𝑖𝑛𝑡𝑒𝑟𝑚𝑒𝑑𝑖𝑎𝑡𝑒𝑠
→ 𝑓𝑖𝑛𝑎𝑙 𝑝𝑟𝑜𝑑𝑢𝑐𝑡 … … … . (3-3)
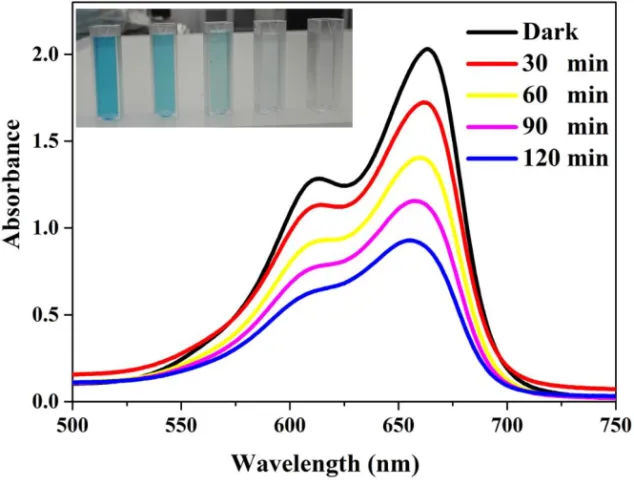
The organic dye could be degraded through direct mineralization or step-wise N-deethylation process. The direct mineralization produces gaseous as end products such as CO2, NO3, and NOx [52]. Whereas in the stepwise
N-deethylation process the conjugated structure of the dye will be de-stroyed. If the measured absorption spectrum of the dye during the pho-tocatalysis reaction time detected without any shift, the dye is directly mineralized, otherwise, it is a stepwise N-deethylation process [39, 69, 70]. Figure 3-3 shows the UV-Vis absorbance spectrum of methylene blue (MB) dye during the photocatalysis reaction with Mg-doped ZnO NPs. The inset shows the discoloration of the MB dye. However, many factors can affect the photocatalytic reaction and the degradation rate of the dyes.
22 These factors include the source of light and its intensity, catalyst amount, type of the dye, reaction time and pH of the dye solution.
The organic dyes could be classified as an anionic or cationic dye. Congo red (CR) and MB are used in this thesis as a model dye. CR is an anionic dye which is more acidic, and when dissolved in water it will become neg-atively charged, which allow its adsorption by the positive surface of the catalyst [75]. Whereas MB is a cationic/basic dye and its surface is posi-tively charged, therefore electrons in the CB will be migrated to the sur-face of the catalyst and attack the molecular structure of the dye leading
Figure 3-3 Absorbance spectra of MB dye during the photocatalysis reaction. The inset shows the colour of MB changing to transparent.
23 to the decomposition of the dye [76]. The chemical structures of the CR and the MB are presented in Figure 3-4.
3.1.1 Kinetic analysis
A photocatalytic mechanism should follow the Langmuir-Hinshelwood´s pseudo-first-order kinetic model [73], where the apparent reaction con-stant for the photocatalyst is determined according to equation (3-4).
𝐾𝑎𝑝𝑝 =𝑙𝑛 [ 𝐶0
𝐶 ]
𝑡 … … … . (3-4)
where 𝐾𝑎𝑝𝑝 is the apparent reaction constant (min-1), C0 is the initial
concentration of the dye (mol l-1 ), C is the dye concentration after irra-diation time t (mol l-1) and t is the irrairra-diation time (min.), The plot of ln [𝐶0
𝐶] versus irradiation time for the ZnO NPs with different
nanocom-posites are shown in Figure 3-5.
24
Figure 3-5 The plot of (lnC0/C) vs. illumination time for ZnO NPs and
differ-ent synthesized nanocomposites based on ZnO NPs.
3.1.2 Photodegradation Efficiency
The photodegradation efficiency (%) versus irradiation time can be esti-mated from the UV-vis absorbance spectra measurement according to equation (3-5).
𝑃ℎ𝑜𝑡𝑜𝑑𝑒𝑔𝑟𝑎𝑑𝑎𝑡𝑖𝑜𝑛 (%) =𝐴₀ − 𝐴
𝐴₀ 𝑥 100 … … … . . (3-5) Where A0 is the initial maximum absorbance of the dye, and A is the
25
3.2 Photoelectrochemical Water Splitting
The PEC water splitting needs (1) a semiconductor in a form of Schottky junction to absorb light and generated charge carriers (electron-hole pairs), (2) separation of the photogenerated charge carriers, and (3) charge carriers collection and transportation. As shown in Figure 3-6 be-low. The suitable semiconductor for water splitting should meet the fol-lowing criteria:
1. Suitable bandgap which is small enough to absorb a large range of sun-light, and large enough to split water (larger than electron energy >1.23 eV)
2. Suitable band edge; the position of the CB of the semiconductor should be higher than the H2/H2O level, whereas the VB position should be
lower than H2O/O2 level.
3. Long charge carrier lifetime and higher charge carrier mobility which results in fast charge carrier transportation(Table 3-1) shows some typical metal oxides photoelectrodes with their charge carrier mobility and lifetime [23, 78, 79].
26 The overall water splitting reaction can be summarized as follows:
2𝐻2𝑂 → 2𝐻2+ 𝑂2 𝐸 = 1.23 𝑉 (∆𝐺 = +
237.22𝐾𝐽
𝑚𝑜𝑙 ) … … … (3-6)
Table 3-1 The charge carrier mobility and lifetime of some metal ox-ides photoelectrodes
27 Equation (3.6) theoretically explains that the minimum requirement for water splitting into hydrogen and oxygen molecules is 1.23 V at the stand-ard temperature (T0=298K) and pressure of (P0 =1 bar) [74]. The
chemi-cal reaction in equation (3-6) can be written into two relevant equations at (pH =0):
2𝐻2𝑂 → 4𝐻++ 4𝑒−+ 𝑂
2 𝐸0= 1.23 𝑉 𝑣𝑠. 𝑁𝐻𝐸 … … … . . (3-7)
4𝐻++ 4𝑒−→ + 2𝐻2 𝐸0= 0.00 𝑉 𝑣𝑠. 𝑁𝐻𝐸 … … … … (3-8) But practically, overpotential is required due to different electrode mate-rials, the electrolyte used and the distance between the electrodes. This reaction is performed at two different electrodes locations which are the photoanode/semiconductor where oxidation reaction arises and oxygen is produced, and the cathode where reduction reaction arises and hydro-gen is produced (see Figure 3-6). If the photoanode is an n-type ductor, the photogenerated holes moves to the surface of the semicon-ductor to drive the water oxidation reaction, while electrons migrate to the bulk of the photoelectrode to reach the back contact, then to the metal electrode through a wire to perform water reduction. If the photoanode is a p-type semiconductor, the photogenerated electrons migrate to the surface of the semiconductor to drive the water reduction, while holes should migrate to the bulk of the semiconductor to reach the back con-tact, then to the metal electrode through a wire to perform water oxida-tion.
28
3.2.1 PEC Measurements Performance
In order to study the PEC performance and water splitting analysis, the charge carrier characteristics at the semiconductor/electrolyte interface for the synthesized nanocomposites should be performed with three -electrodes configuration. This can be obtained from the photocurrent density versus the applied potential through the linear sweep voltamme-try (LSV) measurements as shown in Figure 3-7(a) for the ZnO NRs. Which shows the LSV curves in the dark and under illumination of solar light. It could be observed that negligible photocurrent is detected in the dark, while the photocurrent increased obviously under illumination of solar light. The photo response over time also could be investigated through chronoamperometry measurements and the photocurrent den-sity versus time can be recorded and analysed as shown in Figure 3-7(b). More details on the PEC performance and results of the synthesized nanocomposites are discussed in chapter 5.
Figure 3-7 (a) LSV curves in dark and light condistions, and (b) photo response over time for ZnO NRs photoelectrode.
29 From the electrochemical impedance measurement under dark, we can get the Mott-Schottky plot where the flat band potential (VFB) could be
extracted. At the VFB no band bending occurs at the
semiconductor-elec-trolyte junction, so the CB and VB are flat as shown in Figure 3-8(a) for the n-type semiconductor-based photoelectrode. If the photoelectrode il-luminated with light or biased with an applied potential (𝑉𝑎𝑝𝑝) greater
than the VFB, the conditions of VFB are not valid. In this case, the relative
change in the charge carriers concentration leads to the photocatalysis reaction [74] (Figure 3-8(b)).
During the VFB measurements, the capacitance of space charge layer (Csc)
is recorded and (1/Csc ) versus the applied potential is plotted as shown
in Figure 3-9 [67] for the synthesized ZnO NRs and ZnO/Ag/Ag2WO4
photoelectrodes grown on FTO by the hydrothermal method [59]. The in-tercept of the linear regression is the VFB which is +0.60 and +0.4V for
the ZnO and ZnO/Ag/Ag2WO4 photoelectrodes, respectively. The plot is
following the Mott-Schottky equation given in equation (3-9).
Figure 3-8 The band position of n-type semiconductor (a) at the flat band condition, and (b) under illumination of solar light.
30 1 𝐶𝑠𝑐2 ⁄ = 2 𝜀𝜀0 𝑒𝑁𝑑𝐴2 (𝑉𝑎𝑝𝑝− 𝑉𝐹𝐵− 𝑘𝑇 𝑒 ) … … … (3-9) where 𝜀 is the permittivity of the semiconductor and 𝜀0 and is the
per-mittivity of the vacuum, Nd is the charge carrier density, and A is the area
of the photoelectrode.
Figure 3-9 Mott-Schottky plots of 1/C2 versus applied potential (V) in complete darkness at a frequency of 3 kHz for the ZnO NRs, and the ZnO/Ag/Ag2WO4
31
3.2.2 Photon to current conversion efficiency (IPCE)
The IPCE can be studied for more PEC analysis. It is a measure of how efficient a photoelectrode in converting an individual photon to an ex-tractable electron [74]. The measurement performed with a monochrom-ator light source for spectral distribution that can be selected by the length, and at the same time, the current density generated at each wave-length should be measured. Then IPCE can be calculated from equation (3-10) [76]:
𝐼𝑃𝐶𝐸(%) =1240 ×𝐼𝑝ℎ
𝜆×𝐽 × 100………(3-10)
Where Iph is the photocurrent density, 𝜆 is the wavelength of the incident
33
4 Characterization Techniques
4.1 Instruments
4.1.1 X-ray diffraction spectroscopy (XRD)
Philips powder XRD diffractometer using Cu Ka radiation and wave-length of 0.15406 nm was used to investigate the structural properties of the nanomaterials. The generator was adjusted at a voltage of 40 kV and a current of 40 mA to carry out the measurements. From the XRD meas-urements, we can obtain information about the crystallinity of the sam-ples where the crystalline structure of the sample makes the incident of the monochromatic x-ray beam with incident angle (θ) and wavelength (λ) to be diffracted into specific directions as shown in Figure 4-1. Where the diffracted beam collected at the detector at (2θ) according to Bragg’s law [77]:
𝑛𝜆 = 2𝑑𝑠𝑖𝑛(𝜃) … … … . (4-1)
Where 𝑛 is the diffraction order, d is the distance between the diffraction plane, λ is the x-ray wavelength, and 𝜃 is the Bragg diffraction angle. Ac-cordingly, the density of electrons and distance between neighbour atoms could be determined. From the angels and the higher intensities of the diffracted beams due to effective interference, a pattern of XRD intensi-ties vs. (2θ) could be obtained. The study of this pattern will give infor-mation about crystal structure and orientation. Also, we can calculate the crystallite size of the NPs using Scherrer equation [78]:
𝐷 = 𝑘𝜆
34 where D is the crystallite size of the NPs, λ is the x-ray wavelength, 𝜃 is the Bragg diffraction angle, 𝛽 is the full width at the half maximum (FWHM) of the highest peak, and 𝑘 is Scherrer constant = 0.9.
4.1.2 Filed emission scanning electron microscopy (FE-SEM)
FE-SEM (Quanta 200 FEG) was used to study the morphology of the syn-thesized ZnO and its nanocomposites with an accelerating voltage of 30.0 kV. From the FE-SEM imaging we can obtain information about the shape, the size distribution, and dimensions of the nanocomposites. The FE-SEM is composed of electron source, electromagnetic lenses, and electron detector. An electron beam with high energy is accelerated and focused by the lenses on the surface of the sample. Then the sample emits secondary electrons which can be detected. The emitted secondary elec-trons number are varied due to the surface variation of the sample. The SEM image is created by scanning the beam over the surface of the sam-ple in a raster way and detecting the variation of electrons number that
35 emitted from the surface of the sample as shown in the schematic dia-gram in Figure 4-2. Another interaction is that the electron beam can ion-ize the atoms, and x-ray emitted, which depend on the elemental compo-sition of the sample. Also, by scanning the surface of the sample and de-tecting the x-ray with another detector, chemical composition and their distributing over the sample which known as energy dispersive x-ray (EDX) could be analysed. Therefore, from the SEM we can obtain a mag-nification image of the surface of the sample as well as the chemical com-position. The SEM imaging for the ZnO NPs and ZnO NRs are shown in Figure 4-3. The estimated average size of the ZnO NPs is ⁓80 nm [52], while the dimeter of the ZnO NRs estimated to be ⁓100 nm [59].
36
4.1.3 Transmission electron microscopy (TEM)
The TEM was performed using double-corrected Linköping FEI Titan3 60–300, operated at 300 kV. The microscope is equipped with a mono-chromator with high brightness XFEG gun image, probe Cs correctors and solid angle Super-X EDX detector. The TEM measurement is quite similar to SEM, but it requires sample preparation to be in a very thin thickness (⁓100nm). Also, the TEM is composed of electron source, elec-tromagnetic lenses, and electron detector. The sample should be fixed along the electron beam. The electron beam is accelerated and focused into the sample by lenses then transmitted through the sample. The transmitted beam is magnified and then detected. It is possible for the TEM to magnify images at the atomic resolution. Scanning TEM (STEM) can be measured by focusing the electrons beam into specific point of the sample and detecting the transmitted beam, and by scanning the surface of the sample we can view the magnified image of the sample as well as the chemical composition of the sample (EDX). Figure 4-4 shows the
37 principle operation of the TEM (left) and the TEM image of the synthe-sized ZnO/GR/Ag/AgI nanocomposite (right). We could see that there is a conjunction between the GR sheet and the nanocomposite, where the GR is functioning as a substructure for assembling the NPs besides being an electrical bridge between the nanocomposite during the photocatalytic reaction [52].
Nanocomposite
Figure 4-4 Schematic diagram of TEM set up (left) and TEM im-age of the ZnO/GR/Ag/AgI nanocomposite (right).
38
4.1.4 X-ray photoelectron spectroscopy (XPS)
XPS (PHI 5600 mode) was used in this thesis to study the surface prop-erties and the chemical composition of the synthesized ZnO nanocompo-sites. The XPS was calibrated using (C 1s) 284.6 eV as a reference for all binding energies. The theory behind the XPS is the photoelectric effect, where x-ray beam with specific photons energy (hυ) strike the nanocom-posite surface at ultra-high vacuum conditions, then the photoelectrons are emitted at different kinetic energy (Ek) where Ek = hυ - Eb [79]as
shown in Figure 4-5. Any element existence in the surface of the nano-composites will produce an energy spectrum with certain binding energy according to their electronic structure [79]. From the spectrum and with a comparison of the XPS database the chemical composition of the nano-composite can be determined. The spectrum of XPS scan survey of the ZnO/GR/Ag/AgI nanocomposite is presented in Figure 4-6. As can be seen, the presence of the Zn, O, C, Ag, and I elements in the ZnO/GR/Ag/AgI nanocomposite could be identified.
39
4.1.5 UV-Vis spectroscopy
Light absorption properties were measured by Perkin Elmer Lambda 900 UV-Vis spectrophotometer DRS (JASCO, UV-550) in the wavelength range of 200–800 nm. It provides a double beam produced by Tungsten or Deuterium lamp, one of the beams goes through a reference medium for system calibration, whereas the other beam goes through the sample. The beam will be transmitted, then detected by a photodetector as ex-plained in Figure 4-7. Finally, the absorption of the sample calculated and the absorbance spectrum of the sample versus the wavelengths will be plotted. The absorbance of the sample (A) is calculated from the following equation:
𝐴 = 𝑙𝑜𝑔 [𝐼
𝐼0] … … … . . (4-3)
40 Where I is the light intensity transmitted through the sample, I0 is the
intensity of the incident light.
The UV-Vis absorption spectrum of the synthesized ZnO NPs presented in Figure 4-8 Which shows that the ZnO NPs exhibit an absorption peak in the UV range at 366 nm.
41
Figure 4-8 The UV-Vis absorbance spectrum of the synthesis ZnO NPs.
4.1.6 Cathodoluminescence spectroscopy (CL)
Optical characterization by cathodoluminescence (CL) using Gatan Mono CL4 system combined with Gemini LEO 1550 FE-SEM was tained in this thesis. All CL measurements of the nanocomposites ob-tained at room temperature in the wavelength range of 200-800. In the CL measurements an electron beam (with several keV) attacks the sample at a very small focussing area, and the electrons are excited from the VB to the CB. Due to the recombination of the excited elec-trons and holes, elecelec-trons emit photons to be detected as illustrated in Figure 4-9, and the emission can be in a wide spectra range including ultraviolet, visible light and infrared. The CL image and CL spectrum of the ZnO NPs are presented in Figure 4-10. The spectrum shows a near band edge emission band beak at 376, and a broad emission which cover all the visible light wavelength band with beak at 614.
42
Figure 4-10 Focusing area of the CL image (left), and CL spectrum of the ZnO NPs (right).
43
4.2 Photodegradation set up
The photocatalytic experiments were performed using a solar simulator equipped with 100 W ozone free xenon lamp have a power of 1 sun (AM 1.5) to provide simulated solar light as presented in Figure 4-11. First, a 100 ml of the dye solution was mixed with an amount of 0.05 g catalyst and stirred for 30 min. under dark condition to reach the adsorption-de-sorption equilibrium between the dye and catalyst. Then a small amount of the mixture was withdrawn and centrifuged to separate the powder from the solution. After that the UV-Vis absorption spectrum was rec-orded for the separated solution. Then, the solar simulator was turned on, and with a specific time interval a small amount of the mixture was with-drawn, centrifuged and the UV-Vis absorption spectra were recorded.
44
4.3 Three Electrodes Set-up
The PEC activities of the synthesized photoelectrodes were studied using SP-200 potentiostat (Bio-Logic, Claix, France) with three electrodes set-ting as presented in Figure 4-12. A platinum (Pt) sheet and standard Ag/AgCl in 3 M KCl was applied as counter and a reference electrode, respectively. Whereas, the as synthesized photoelectrodes applied as working electrodes with a total area of the electrode immersed in the elec-trolyte of 1 cm2. Sodium sulfate (Na2SO4) with 0.1 M was used as an
elec-trolyte for all the PEC measurements. Solar light was obtained from 100W ozone free xenon lamp in a solar simulator with an output power of 1 sun.
45
5 Results and Findings
The result of the synthesis and characterization of some nanostructured materials based on ZnO NSs for visible light photo-processes are dis-cussed based on five published papers and one manuscript. Also, some of the materials discussed in this thesis comes from my previous works at-tached to this thesis [20, 42, 52, 63, 67].
5.1 Photodegradation of Organic Dyes
5.1.1 ZnO NPsIn this thesis, we started by exploring the photocatalysis performance of the ZnO NPs through the photodegradation of the CR dye under the illu-mination of solar light as published in paper I [20]. First, ZnO NPs were synthesized by the co-precipitation method at low temperature, the syn-thesized NPs were characterized by a variety of techniques. Finally, the photocatalysis activities were performed under different pH. The synthe-sized ZnO NPs have a quit well-distributed particles shape with an aver-age of 100 nm in the size as estimated from the SEM imaging in Figure 5-1.
46
Figure 5-1 FE-SEM images of ZnO NPs at two different magnifications.
The optical properties of the ZnO NPs were obtained from the UV-Vis and CL measurements as shown in Figure 5-2 (a and b). From the UV-Vis spec-trum, the ZnO NPs exhibited a maximum absorption peak at 366 nm. The optical band gap of the prepared ZnO NPs was found to be ~2.9 eV which calculated from the Tauc’s plot (see the intersect of Figure 5-2(a)) which is smaller than the band gap of the bulk ZnO. This could be ascribed to the native point defects on the ZnO NPs that occurred during the growth pro-cess of the ZnO NPs. This resulted in a shift of the absorption toward the visible light region and a betterphotocatalysis performance could be ob-served. The CL spectrum of the ZnO consists of ultraviolet emission peak at 376 nm and a broad peak centered at ~600 nm as displayed in Figure 5-2 (b), which covers the whole visible light region. The broad beak could be attributed to the existence of intrinsic deep level emission of oxygen
47 interstitial (Oi) and the presence of a hydroxyl group on the surface of the
ZnO NPs [80–83].
The photocatalysis activities of the ZnO NPs were performed for the deg-radation of CR dye under the illumination of solar light at different con-ditions as presented in Figure 5-2 (c). When the CR irradiated with solar light without catalyst, no degradation was observed. When ZnO NPs were added to the CR solution without solar light, negligible degradation was observed. The photodegradation of the CR dye was obtained successfully when ZnO NPs were added under solar light illumination, where the con-centration of the CR dye was reduced obviously. Although the ZnO is a wide band gap, it is observed that the ZnO NPs exhibit remarkable pho-tocatalytic performance for the degradation of the CR dye under visible solar light. This performance is attributed to (O2.−) and (OH.) radicals.
Also, the high redox potential, native points defects, and the unique nano-size are playing an important role in the photocatalysis performance. The electrical properties of the ZnO NPs can be varied due to variation of the dye pH values [84] where the surface of the ZnO NPs could be nega-tively charged above zero point charge (9.0) and could be posinega-tively charged below the zero pint charge. Therefore, the photodegradation of the CR dye was studied for three different pH values (4, 7, and 10) and results for different pH values is presented in Figure 5-2 (d). Which shows the concentration of the CR dye during the photocatalysis reaction for 120 min. When the pH increased up to 10 better photocatalysis reaction was observed compared to the basic pH value of 7 and the degradation effi-ciency calculated to be 83 %. This is because, at high pH values, more OH
-ions are available to drive the photocatalytic reaction and produce OH.,
which is the main species responsible for the photocatalysis reaction. Thus the degradation efficiency was increased [25, 89]. The best degra-dation efficiency was found to be 85 % at the lower pH 4. We can observe
48 that the adsorption of the CR dye at pH 4 is higher where a photocatalytic reaction was observed in the dark which enhances the degradation effi-ciency. Moreover, anionic dyes such as CR can reach its maximum pho-todegradation efficiency at lower pH values. Because its surface will be negatively charged at lower pH value, which makes induced interaction with the positively charged ZnO NPs and increases the reaction rate. The positively charged NPs surface helps the movement of photogenerated electrons to react with the adsorbed O2 to produce O2.- which is an active
species in the photocatalytic reaction. In the end, higher degradation ef-ficiency was obtained at pH 4. In addition to that from the radical scav-enger experiment, it was found that O2.- is the major species responsible
49
Figure 5-2 (a) UV-Vis spectrum of the synthesis ZnO NPS and the intersect shows the estimated optical band gap from Tauc’s plot, (b) the CL spectrum of the syn-thesis ZnO NPs which dominated by two main beaks, (c) the photocatalysis per-formance at different condition.
50
5.1.2 Mg-doped ZnO NPs
To improve the photodegradation efficiency of ZnO NPs and its photo re-activities, Mg-doped ZnO NPs were investigated for photodegradation of MB dye as published in paper II [42]. Also, the low-temperature co-pre-cipitation method was used to synthesized Mg-doped ZnO NPs with dif-ferent Mg atomic concentrations relative to Zn (0, 3, 5, and 7 %). The syn-thesized Mg-doped ZnO NPs morphologies were seen by the FE-SEM im-aging shown in Figure 5-3. We could see that more uniform size and mor-phology distribution of the ZnO NPs, than Mg-doped ZnO. The estimated average size was found to be ~ 58, ~67, ~90, and ~100 nm for the 0, 3, 5, and 7% samples, respectively. The size of the NPs was found to increase with increasing the doping concentration with an agglomeration of the particles. This is explained due to the increasing of the Mg2+ that were
incorporated into ZnO crystal lattice which enhances the electron-hole separation and transfer during the photocatalytic reaction. The corre-sponding EDX spectrum was performed to study the Mg-content on the sample as shown in Figure5-4 for the 7% Mg-doped sample.
Furthermore, the incorporation of the Mg into the ZnO crystal lattice was confirmed by the XPS analysis as shown in Figure 5-4(a) for the 7 % sam-ple. Figure 5-4(b) present the Zn 2p core-level spectrum which is divided into two peaks centered at 1022.3 and 1045.3 eV which indicates the pres-ence of Zn2+[86]. The Mg 2p XPS peak centered at 50.6 eV of the
Mg-doped ZnO NPs is shown in Figure 5-4(c) which is attributed to the pres-ence of Mg2+ that could replace the Zn2+ [87]. Figure 5-4(d) showes the O1s
core level XPS spectra of 0% and 7% samples which decomposed into two Gaussian peaks. One peak at low binding energy centered at 530.97 and 530.99 eV for 0% and 7% Mg doping concentration, respectively. Which ascribe to the O2- ions of the wurtzite structure of the samples [20,87].
51 532.09 eV, respectively is suggested to be related to H2O and O2 [22, 92].
There is a slight shift towards higher binding energy for the 7% sample compared to the pristine ZnO NPs, which could be a sign of the Zn-O-Mg bond formation due to the substitution of Zn2+ by Mg2+ [89].
Figure 5-3 FM-SEM images of the synthesized Mg-doped ZnO NPs with dif-ferent Mg/Zn atomic concentration (a) 0 %, (b) 3 %, (c) 5 % and (d) 7 %.
52 The photodegradation efficiency result is presented in Figure 5-5 which shows the UV-Vis absorbance spectra of the MB for 0, 3, 5, and 7 % sam-ples. The MB spectra exhibit the main beak centered at 663 nm, and its intensity decreases with time illumination for all samples which due to the degradation of the MB. The MB photodegradation efficiency (%) ver-sus illumination time is shown in Figure 5-6. We could see that the photo-degradation efficiency is improving with the addition of Mg doping con-centration reaching 96 % for the 7 % sample. This could be attributed to the efficient substitution of the Zn2+ by the Mg2+which enhances the
pho-togenerated electron-hole pairs and, to the good absorption of hydroxyl
Figure 5-4 (a) EDX spectrum of 7% Mg-doped ZnO NPs and (b) XPS core level spectra of Zn 2p, (c) Mg 2p XPS core level spectra, and (d) O 1s XPS spectra of the ZnO NPs and Mg-doped ZnO NP.
53 ions [90] which is an important species to drive the photocatalytic reac-tion as suggested by our previous study [42].
Figure 5-5 Absorbance spectra of MB during photocatalytic activities for Mg-doped ZnO NPs (0, 3, 5, and 7%) under simulated solar light.
54
5.1.3 ZnO/GR/Ag/AgI nanocomposite
The addition of the GR into the ZnO NPs can hinder the recombination of the electron-hole pairs in the photocatalysis reaction and enhances the separation and transportation process. Also, the deposition of the Ag/AgI nanoparticles can shift the absorption of light towards the visible range due to the lower band gap energy of the AgI and to the SPR effect from the Ag particles. The main purpose of this work is based on paper III which is to synthesis a new plasmonic ZnO/GR/Ag/AgI nanocomposite to enhance the photocatalysis activities under solar light. The blending of the AgI into the ZnO/GR/Ag/AgI nanocomposite with different AgI amounts (10, 20, and 30 %) was also studied. By low-temperature chem-ical methods combined with ultrasonic irradiation, we successfully ob-tained theZnO/GR/Ag/AgI nanocomposite. The morphology of the nano-composite was studied using SEM, and TEM as shown in Figure 5-7.The estimated average of the particles is ~100 nm [52]. From the TEM image in Figure 5-7 (b) we can see the association of the NPs and the GR
nano-Figure 5-6 Photodegradation efficiency of MB for Mg-doped ZnO NPs (0, 3, 5, and 7 %) under simulated solar light.


![Figure 3-1 Band edge energy consideration for some interesting catalysts [6].](https://thumb-eu.123doks.com/thumbv2/5dokorg/4298839.96191/35.892.156.776.311.597/figure-band-edge-energy-consideration-interesting-catalysts.webp)