Supplementary Material
The effects of polar excipients transcutol and dexpanthenol on
molecular mobility, permeability, and electrical impedance of the
skin barrier
Sebastian Björklunda,b,*, Quoc Dat Phamc, Louise Bastholm Jensend, Nina Østergaard Knudsend, Lars Dencker Nielsend, Katarina Ekelundd, Tautgirdas Ruzgasa,b, Johan Engbloma,b, and Emma Sparrc
aDepartment of Biomedical Science, Faculty of Health and Society, Malmö University,
SE-205 06, Malmö, Sweden
bBiofilms Research Center for Biointerfaces, Malmö University, SE-205 06, Malmö, Sweden cPhysical Chemistry, The Center for Chemistry and Chemical Engineering, Lund University,
Box 124, SE-221 00 Lund, Sweden
dLEO Pharma A/S, Industriparken 55, DK-2750 Ballerup, Denmark
*Corresponding author (sebastianbjorklund@gmail.com, tel:+46732010910)
Supplementary Tables
Table S1. Metronidazole solubility (mg g-1), adjusted formulation concentration (mg g-1), and water activity (aw) in the formulations. Deviations are given by the standard error of the mean
(±SEM).
Formulation† [Solubility] [Adjusted] a w PBS 12.5 ± 0.19 (n=6) 7.50 0.992 ± 0.002 (n=2) TC5 14.3 ± 0.22 (n=6) 8.62 0.984 ± 0.002 (n=2) TC10 15.8 ± 0.27 (n=6) 9.55 0.975 ± 0.001 (n=2) TC15 17.4 ± 0.29 (n=6) 10.5 0.965 ± 0.001 (n=2) TC30 22.1 ± 0.52 (n=3) 13.3 0.936 ± 0.000 (n=2) DexP5 14.1 ± 0.18 (n=6) 8.51 0.986 ± 0.001 (n=2) DexP10 15.5± 0.08 (n=6) 9.35 0.981 ± 0.001 (n=2) DexP15 16.8 ± 0.18 (n=5) 10.1 0.976 ± 0.001 (n=2) DexP30 20.4 ± 0.14 (n=5) 12.3 0.955 ± 0.001 (n=2)
Table S2. Impedance spectroscopy data of initial ( i ) and final ( f ) values of R (Ohm cm2) and CPE parameters α, Qeff (Ohm-1 cm-2 sα), and Ceff (nF cm-2).
Formulation† R α Qeff Ceff
i f i f i f i f PBS A 21691 1818 0.830 0.599 1.29E-07 2.55E-06 39 70 PBS B 7844 752 0.769 0.375 3.22E-07 3.89E-05 53 107 PBS C 14685 1268 0.816 0.490 1.53E-07 1.06E-05 39 119 PBS D 13069 988 0.790 0.469 2.65E-07 1.59E-05 59 145 PBS E 6915 1369 0.757 0.565 3.68E-07 4.93E-06 54 105 PBS F 11544 801 0.754 0.508 3.31E-07 1.03E-05 54 98 PBS G 11239 2227 0.686 0.663 4.72E-07 1.37E-06 43 72 PBS H 3899 548 0.704 0.412 7.30E-07 3.64E-05 62 137 PBS I 11625 1073 0.780 0.557 2.58E-07 5.59E-06 50 96 PBS J 4196 1270 0.713 0.592 5.13E-07 3.67E-06 43 91 TC5 A 7142 1072 0.747 0.583 5.46E-07 4.87E-06 83 114 TC5 B 4487 971 0.747 0.476 4.06E-07 1.29E-05 48 104 TC5 C 7744 834 0.767 0.509 3.56E-07 1.10E-05 59 119 TC5 D 10736 1398 0.678 0.580 7.67E-07 4.20E-06 78 101 TC5 E 3988 1629 0.684 0.589 7.46E-07 2.74E-06 51 62 TC30 A 7136 831 0.751 0.556 4.80E-07 7.16E-06 73 120 TC30 B 8009 2033 0.753 0.674 3.63E-07 1.19E-06 53 65 TC30 C 3015 995 0.494 0.581 5.44E-06 4.46E-06 80 89 TC30 D 4232 1232 0.526 0.610 3.32E-06 2.74E-06 71 72 TC30 E 5870 687 0.719 0.495 6.21E-07 1.40E-05 69 122 DexP5 A 9398 1682 0.790 0.584 2.66E-07 3.89E-06 54 108 DexP5 B 4257 1092 0.738 0.556 4.20E-07 4.59E-06 44 67 DexP5 C 5191 664 0.738 0.419 6.02E-07 3.04E-05 78 137 DexP5 D 8794 1118 0.757 0.540 4.18E-07 7.08E-06 69 115 DexP5 E 9343 633 0.7667 0.423 4.27E-07 3.29E-05 79 167 DexP30 A 8919 8828 0.757 0.767 3.14E-07 3.50E-07 48 60 DexP30 B 9373 7952 0.789 0.761 2.42E-07 4.01E-07 48 66 DexP30 C 5183 1427 0.724 0.640 6.15E-07 2.45E-06 69 101 DexP30 D 2733 1888 0.699 0.669 6.49E-07 1.34E-06 43 69
DexP30 E* 861 - 0.38 - 2.3E-05 - 41 -
†Abbreviations: TC - transcutol, DexP - dexpanthenol. Numbers give concentration in wt%. *Membrane defect at final measurement
Table S3. Relative change of R (Ohm cm2), CPE parameters α and Qeff (Ohm-1 cm-2 sα), and Ceff (nF cm-2) given by the ratio of the final ( f ) and initial ( i ) values.
Formulation† Rf / Ri αf / αi Qeff,f / Qeff,i Ceff,f / Ceff,i
PBS A 0.08 0.72 19.8 1.8 PBS B 0.10 0.49 120.6 2.0 PBS C 0.09 0.60 69.5 3.1 PBS D 0.08 0.59 60.0 2.5 PBS E 0.20 0.75 13.4 1.9 PBS F 0.07 0.67 31.1 1.8 PBS G 0.20 0.97 2.9 1.7 PBS H 0.14 0.59 50.0 2.2 PBS I 0.09 0.71 21.7 1.9 PBS J 0.30 0.83 7.2 2.1 TC5 A 0.15 0.78 8.9 1.4 TC5 B 0.22 0.64 31.7 2.2 TC5 C 0.11 0.66 30.9 2.0 TC5 D 0.13 0.86 5.5 1.3 TC5 E 0.41 0.86 3.7 1.2 TC30 A 0.12 0.74 14.9 1.6 TC30 B 0.25 0.90 3.3 1.2 TC30 C 0.33 1.18 0.8 1.1 TC30 D 0.29 1.16 0.8 1.0 TC30 E 0.12 0.69 22.5 1.8 DexP5 A 0.18 0.74 14.6 2.0 DexP5 B 0.26 0.75 10.9 1.5 DexP5 C 0.13 0.57 50.5 1.8 DexP5 D 0.13 0.71 16.9 1.7 DexP5 E 0.07 0.55 77.1 2.1 DexP30 A 0.99 1.01 1.1 1.3 DexP30 B 0.85 0.96 1.7 1.4 DexP30 C 0.28 0.88 4.0 1.5 DexP30 D 0.69 0.96 2.1 1.6 DexP30 E* - - - -
†Abbreviations: TC - transcutol, DexP - dexpanthenol. Numbers give concentration in wt%. *Membrane defect at final measurement
Supplementary Figures
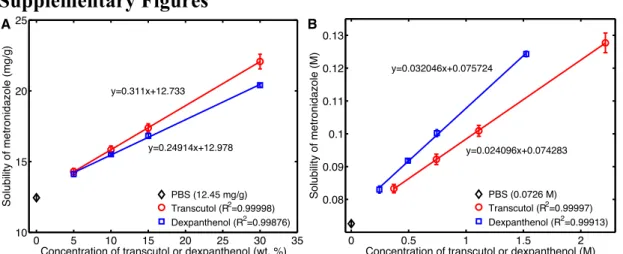
Figure S1. (A) Metronidazole solubility (mg/g) as a function of transcutol or dexpanthenol
concentration (wt%). (B) Metronidazole solubility (M) as a function of transcutol or dexpanthenol concentration (M), showing that dexpanthenol is more efficient in solubilizing metronidazole in a mole-per-mole basis, as compared to transcutol.
Figure S2. Water activity in the formulations as a function of transcutol or dexpanthenol
concentration (M). The regression line shows good correlation, which suggests that the water activity is mainly determined by the number of transcutol or dexpanthenol molecules, irrespective of type. 0 5 10 15 20 25 30 35 10 15 20 25
Concentration of transcutol or dexpanthenol (wt. %)
Solubility of metronidazole (mg/g) y=0.311x+12.733 y=0.24914x+12.978 PBS (12.45 mg/g) Transcutol (R2=0.99998) Dexpanthenol (R2=0.99876) 0 0.5 1 1.5 2 0.08 0.09 0.1 0.11 0.12 0.13
Concentration of transcutol or dexpanthenol (M)
Solubility of metronidazole (M) y=0.024096x+0.074283 y=0.032046x+0.075724 PBS (0.0726 M) Transcutol (R2=0.99997) Dexpanthenol (R2=0.99913) A B 0 0.5 1 1.5 2 2.5 0.93 0.94 0.95 0.96 0.97 0.98 0.99 1 y=−0.0257x+0.994
Concentration of transcutol or dexpanthenol (M)
a w
All data (R2=0.99753) PBS
Transcutol Dexpanthenol
Figure S3. Determination of steady-state flux of metronidazole across skin membranes from
(A) neat PBS formulation (n=12) and (B) formulation containing 5 wt% TC (n=10, 2 outliers). Cumulative mass of permeated metronidazole is plotted as a function of time and the steady-state flux is given by the slope of each individual curve between 16 and 24 h. Statistical outliers were excluded based on a two sided Grubbs’ test at p=0.05.
Figure S4. (A) Schematic representation of the Franz cell equipped with four electrodes for
electrical impedance measurements. Two platinum wires served as working and counter electrodes and two Ag/AgCl/3M KCl electrodes were used as sensing and reference electrodes. The water jacket of the Franz cell was kept at 32 °C by a circulating water bath. (B) Equivalent electrical circuit used to model the experimental impedance data. Rsol is the
resistance of the donor and receptor solution, R is the membrane resistance, and CPE is a constant-phase element. 0 2 4 6 8 10 12 14 16 18 20 22 24 0 50 100 150 200 250 Cumulative mass / µ g cm − 2 Time / h 1 2 3 4 5 6 7 8 9 10 11 12 A 0 2 4 6 8 10 12 14 16 18 20 22 24 0 50 100 150 200 250 Cumulative mass / µ g cm − 2 Time / h 1 2 3 4 5 6 7 8 9 10 (outlier) 11 (outlier) 12 B R Rsol CPE Potentiostat Reference Counter Sensing Working Franz cell Membrane Receptor Donor A B
Figure S5. The imaginary part of the impedance as a function of frequency in logarithmic
coordinates. Parameter α was determined from the high frequency region where the imaginary part contributes greatest to the total impedance, relative to the real part of the impedance (in this region, the phase angle is approaching its maximum value; cf. Fig. S8). Parameter α was graphically determined from the slope of the decaying region, which for the presented data corresponds to the slope of the solid circles in red.
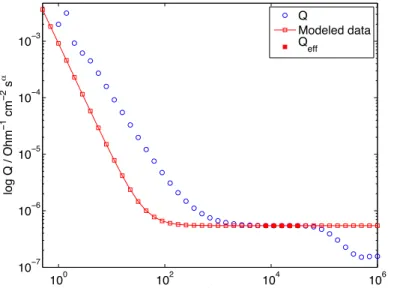
Figure S6. CPE parameter Q as a function of frequency in logarithmic coordinates. Solid red
circles represent data points used to determine Qeff, which corresponds to the mean value of
these data points.
100 102 104 106 102 103 log f / Hz log |Z| IM / Ohm cm 2 −ZIM α = slope 100 102 104 106 10−7 10−6 10−5 10−4 10−3 log f / Hz log Q / Ohm − 1 cm − 2 s α Q Qeff
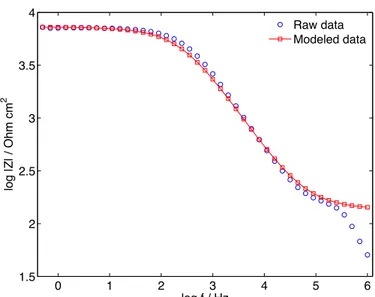
Figure S7. Total impedance as a function of frequency in logarithmic coordinates. Blue
circles represent raw data, while red squares represent modeled data according to (cf. model circuit in Fig. S4 B). Input data: R = 7142 Ohm cm2, α = 0.7465, Qeff = 5.458*10-7 Ohm-1 cm-2
sα. The values of these parameters were determined following the graphical method described in the supplementary text below.
Figure S8. Phase angle ϕ as a function of frequency in logarithmic coordinates. Blue circles
represent raw data, while red squares represent calculated data according to the model described by eq. S1. Input data: R= 7142 Ohm cm2, α = 0.7465, Qeff = 5.458*10-7 Ohm-1 cm-2
sα. The values of these parameters were determined following the graphical method described in the supplementary text below.
0 1 2 3 4 5 6 1.5 2 2.5 3 3.5 4 log f / Hz log |Z| / Ohm cm 2 Raw data Modeled data 0 1 2 3 4 5 6 0 10 20 30 40 50 60 70 80 90 log f / Hz φ Raw data Modeled data
Figure S9. Effective CPE parameter Q as a function of frequency in logarithmic coordinates.
Red squares represent data points used to determine Qeff, while the modeled data were
calculated from eq. S1 and S2 with α = 1, R = 7142 Ohm cm2, Cideal (= Q) = 546 nF cm-2. The
good agreement between the modeled data under ideal conditions and the value of Qeff in the
high frequency region (from which Qeff was obtained) confirms the validity of the method
used to determine Qeff.
Figure S10. Relative change of skin membrane resistance R as a function of water activity
(aw) in the donor solution. The relative change is given by the ratio of the final value, after 24
h exposure of the formulation, and the initial value before the steady-state diffusion experiment. Abbreviations: TC - transcutol, DexP - dexpanthenol. Numbers give concentration in wt%. *PEG shows data from [1].
100 102 104 106 10−7 10−6 10−5 10−4 10−3 log f / Hz log Q / Ohm − 1 cm − 2 s α Q Modeled data Q eff 0.82 0.84 0.86 0.88 0.9 0.92 0.94 0.96 0.98 1 0 0.5 1 1.5 2 2.5 3 3.5 4 a w Γ R PBS TC5 TC30 DexP5 DexP30 ∗PEG
Supplementary Text
Impedance spectroscopy
The total impedance Z of the equivalent circuit in Fig. S4 is given by eq. S1. 𝑍 = 𝑅!"#+ 𝑅
1 + (𝑖2𝜋𝑓)!𝑄𝑅 (1)
In eq. S1, 2πf is the angular frequency, while Q and α are CPE parameters. The resistance values were obtained from the real part of the impedance in the frequency regions where the imaginary part gives minimum contribution to the total impedance. For Rsol, this region
corresponds to high frequencies in the range of ~ 0.2-0.1 MHz. In average, Rsol=134 ± 4 Ohm
(±SEM) including all measurements (n=60). The corresponding frequency region for the membrane resistance R occurs at low frequencies close to direct current (DC) where R = ZRe - Rsol. In this analysis, all data were normalized with the skin membrane area (0.64 cm2) to get
units in Ohm cm2. It should be noted that the measured value of Rsol depends on the distance
between the reference and sensing electrodes, which in the present experiments was subject to minor variations. Therefore small deviations from the separately determined values of Rsol
were expected and accepted. Rsol was in all cases significantly lower than R, which assures
that the effect of the uncertainty of Rsol on the determined value of R is negligible.
Referring to eq. S1, when α equals unity, Q represents an ideal capacitor with units of F m-2. However, in the present work α was in the order of ~ 0.50-0.85, which is consistent with several impedance studies on skin [2-4]. The deviation of the heterogeneous skin membrane from ideal properties is accounted for by the empirical CPE element, which can be used to derive an effective capacitance of the SC [5]. For this, we followed a procedure in which the SC layers are considered to have a distribution of varying time-constants in the vertical direction across the skin membrane [2]. In this case, the effective CPE coefficient Qeff is
derived from the high frequency region where Qeff in theory provides a correct value of Q in
the case when α equals unity (see Fig. S9) [5]. The CPE parameters, α and Qeff were obtained
from the imaginary impedance data following a graphical representation method, which does not involve any fitting [5]. In brief, α was determined by plotting the imaginary part of the impedance as a function of frequency in logarithmic coordinates, where the slope of the decaying region corresponds to α (Fig. S5). The parameter α was consistently calculated in the high frequency region where the imaginary part contributes greatest to the total impedance, relative to the real part. Once parameter α is obtained, Qeff is determined from the
imaginary part of the impedance, Zim, according to eq. S2.
𝑄!"" = 𝑠𝑖𝑛 𝛼𝜋 2
−1
𝑍!"(𝑓)(2𝜋𝑓)! (2)
The average value of the high frequency asymptote data, corresponding to the frequencies used to calculate α, was used to determine Qeff (Fig. S6). Finally, the effective capacitance, Ceff, of the skin membrane was calculated using eq. S3 with the determined values of Qeff, α,
and R.
The impedance data were evaluated in Matlab (www.mathworks.com) to derive R, Qeff, α, and Ceff and the validity of this procedure to extract the skin impedance parameters is further
commented in relation to Fig. S7-S9. The values of these parameters from the initial and final measurements are compiled in Table S2. From these data, the general observation is that R and α decreases, while Qeff and Ceff increases when comparing the initial and final values. In
addition, the results illustrate the natural variability of impedance data, generally observed for different skin membranes [1].
Supplementary References
[1] S. Björklund, T. Ruzgas, A. Nowacka, I. Dahi, D. Topgaard, E. Sparr, J. Engblom, Skin membrane electrical impedance properties under the influence of a varying water gradient, Biophys J, 104 (2013) 2639–2650.
[2] B. Hirschorn, M.E. Orazem, B. Tribollet, V. Vivier, I. Frateur, M. Musiani, Determination of effective capacitance and film thickness from constant-phase-element parameters, Electrochimica Acta, 55 (2010) 6218-6227.
[3] Y.N. Kalia, R.H. Guy, The electrical characteristics of human skin in vivo, Pharm. Res., 12 (1995) 1605-1613.
[4] K. Kontturi, L. Murtomaki, Impedance spectroscopy in human skin. A refined model, Pharm. Res., 11 (1994) 1355-1357.
[5] M.E. Orazem, N. Pebere, B. Tribollet, Enhanced graphical representation of electrochemical impedance data, Journal of the Electrochemical Society, 153 (2006) B129-B136.