TREND ANALYSIS TO AUTOMATICALLY IDENTIFY HEAT PROGRAM CHANGES
S. Abghari1, E. G. Martin1, C. Johansson2, N. Lavesson1and H. Grahn11 Blekinge Institute of Technology, SE-371 79, Karlskrona, Sweden
2 NODA Intelligent Systems AB, Biblioteksgatan 4, SE-374 35, Karlshamn, Sweden
Keywords: District heating, Trend analysis, Change detection, Smart automated system ABSTRACT
The aim of this study is to improve the monitoring and controlling of heating systems located at customer buildings through the use of a decision support system. To achieve this, the proposed system applies a two-step classifier to detect manual changes of the temperature of the heating system. We apply data from the Swedish company NODA, active in energy optimization and services for energy efficiency, to train and test the suggested system. The decision support system is evaluated through an experiment and the results are validated by experts at NODA. The results show that the decision support system can detect changes within three days after their occurrence and only by considering daily average measurements.
INTRODUCTION
In the district heating (DH) domain, operators address several conflicting goals, such as satisfying customer demand while minimizing production and distribution costs. To achieve this, one solution is to equip each customer building with a smart system. Such a system should continuously monitor heat usage, predict future demand, exchange information with operators, and perform demand-side management. Moreover, the system needs to automatically learn the energy usage of the building and adopt its behavior accordingly. NODA Intelligent Systems AB1, an active company in the DH domain, is developing and providing retrofit smart systems to maximize energy efficiency in buildings. These systems consist of controlling hardware together with a range of sensors, which are added on top of the existing control system.
Self-learning and adaptation are two important features of any smart system. However, these two features make the system sensitive to manual changes in the heating system, forcing the system to re-learn its characteristics. Most commonly this relates to applying changes in the temperature program of the controller e.g. by the owner’s building. These changes can lead to use more energy and to add extra charges in the case of increasing the temperature of the system.
Although retrofit solutions such as NODA’s smart system can decrease the cost of replacement of the
1
www.noda.se/en/main
existing control system, their functionality can be affected by the limitation of these existing controllers. Due to this reason, NODA’s smart system is unable to detect manual changes online. Hence, NODA’s operators need to spend significant efforts to detect the manual changes by analyzing the received information from each building controller. To make this process more efficient, a decision support (DS) system can be used to assist operators. DS systems are computer-based information systems, which aim to facilitate and support the decision making processes [1]. The major components of DS systems are: 1) the user-interface, 2) the models and main logic, 3) the database, and 4) the DS functionalities and architecture. DS systems are categorized based on their functionalities into: data-driven, knowledge-data-driven, model-data-driven, document-driven and communication-document-driven DS systems [1]. Among these different types, data-driven systems can provide an online support for decision making through applying machine learning (ML) and statistical techniques to analyze large collections of data.
Machine learning is a branch of artificial intelligence, which includes the study of algorithms that can learn and improve their knowledge by building models from input data to perform specific tasks. Most common tasks in ML, such as classification and regression modeling, are solved with supervised learning methods. Supervised learning uses labeled data to train models [2]. Suppose we are given data in the form of (𝑥", 𝑦"), (𝑥&, 𝑦&),…, (𝑥', 𝑦'). In each pair or instance 𝑥( 𝑖𝑛𝑝𝑢𝑡 denotes a vector, which consists of feature values such as indoor and outdoor temperature, and 𝑦((𝑜𝑢𝑡𝑝𝑢𝑡) indicates a label or outcome of the target attribute. The aim is to train a model to predict the label of the target attribute ( 𝑦() of each new instance, e.g. predicting the secondary supply temperature based on the indoor and outdoor temperature. The target attribute in regression modeling is numeric and in classification modeling it is categorical. In this paper, we propose a data-driven decision support system that uses ML techniques to detect manual changes by predicting the secondary supply temperature based on the outdoor temperature and analyzing the energy consumption of each building. The aim of such a system is to provide complementary decision support for NODA’s operators to detect manual
changes easily and efficiently. The proposed DS system uses a two-step classifier, a combination of k-means and support vector regression (SVR), to detect manual changes within three days after their occurrence by considering daily average measurements.
BACKGROUND AND RELATED WORK
A district heating system (DHS) is a centralized system with the aim of producing space heating and hot tap water for consumers based on their demand at a limited geographic area. A DH system consists of three main parts: production units, distribution network, and consumers. The heated water supplied in a production unit circulates through the distribution network and will be available to consumers.
The main aim of a DHS is to minimize the cost and pollution by considering consumers’ demand and producing just the necessary amount of heat. Hence, being able to predict the heat demand can assist production units to plan better. However, modeling the heat demand forecasting is a challenging task, since water does not move fast. In some situations, the distribution of heated water can take several hours. Moreover, there are a number of factors that affect the forecast accuracy and need to be considered before any plan for production units can be constructed. Some of these factors include [3], [4]:
• Weather condition, mainly the outdoor temperature
• Social behavior of the consumers • Irregular days such as holidays
• Periodic changes in conditions of heat demand such as seasonal, weekly and day-night Fumo [5] pointed out in his review two commonly used techniques for energy demand estimation, namely; forward (classical) and data-driven (inverse) techniques. The first approach describes the behavior of systems by applying mathematical equations and known inputs to predict the outputs. In contrast, data-driven techniques use ML methods to learn the system’s behavior by building a model with training data in order to make predictions.
Dotzauer [4] introduced a very simple model for forecasting heat demand based on outdoor temperature and social behavior. He showed that the predictions of his simple model were comparable with complicated models such as autoregressive moving average model (ARMA). The author concluded that better predictions can be achieved by improving the weather forecasts instead of developing complicated heat demand forecasting models.
In general, different ML methods and techniques have been used to predict the heat demand. Some of the most popular prediction models are autoregressive moving average (ARMA) [6], support vector regression (SVR)
[7], [8], multiple linear regression (MLR) [9] and artificial neural network (ANN) [10], [11]. In [8] the authors compared four supervised ML methods for building short-term forecasting models. The models are used to predict heat demand for multi-family apartment buildings with different horizon values between 1 to 24 hours ahead. The authors concluded that SVR achieves the best performance followed by MLR in comparison to feed forwards neural network (FFNN), and regression trees methods. Recently, Provatas et al.[12], proposed the usage of on-line ML algorithms in combination with decision tree-based ML algorithms for heat load forecasting in a DH system. The authors investigated the impact of two different approaches for heat load aggregation. The results of the study showed that the proposed algorithm has a good prediction result. In another study [13], the authors showed the application of a context vector (CV) based approach for forecasting energy consumption of single family houses. The proposed method is compared with linear regression, K-nearest neighbors (KNN) and SVR methods. The results of the experiment showed that CV performed better in most cases followed by KNN and SVR. The authors concluded the proposed solution can help DH companies to improve their schedule and reduce operational costs.
There are a number of studies that focused on the application of DS systems in domains such as DH and mainly related to advanced energy management [14], [15], [16], [17], [18], [19]. In these studies, the main focus is on forecasting and optimization methods that facilitate and support the decision making processes to increase the energy management quality and bring considerable savings. Furthermore, there are some other works that focused on DH network design [20], [21]. Bordin et al. [20] presented a mathematical model to support DH system network planning by selecting an optimal set of new users to be connected to a thermal network that maximizes revenues and minimizes infrastructure and operational costs.
In summary, the main focus of the studies that have been done in the context of heat demand forecasting in the DH domain was related to using weather forecast data and mainly the outdoor temperature. In contrast, the aim of the proposed solution in this study is twofold: 1) to provide decision support for operators to detect manual changes efficiently, and 2) to decrease the energy consumption cost and control heat demand by identifying these changes and resolving them at each building.
DETECTION OF CHANGES IN TRENDS BY USING REGRESSION METHODS
In DH, operators try to address several conflicting goals, such as satisfying customer demand while minimizing production and distribution costs. One way to solve this is to use demand side management and data analytics
in the customer substations. This can be achieved by a system that continuously predicts the future heat demand, exchanges information with the operator and performs demand side management when the need arises. Such systems can be implemented both in the existing heating controllers as well as in retrofit solutions. One such retrofit system is developed by NODA and it has been used within this study. To make the system efficient, its behavior has to be as automated and self-learning as possible. However, this also makes the system sensitive to manual changes (i.e. changing the temperature) in the heating system, since such changes forces the system to re-learn the characteristics of the heating system.
In order to assist operators to detect these manual changes more efficiently a DS system is implanted to provide decision support for operators. The proposed DS system uses a two-step classifier, k-means and SVR, to detect manual changes. To achieve this goal and to avoid generating false alarms in confront with noisy data, changes should be monitored for some days. Hence, in this study only those deviations that last for at least 3 consecutive days would be marked as manual changes. k-means, which is the most well-known algorithm for classification task, is used to identify the operational status of the heating system (on or off) by partitioning the consumed energy at each building.
Figure 1. The process of automatically identifying the
manual changes for each building by the DS system The main reason to perform this task is to decrease the effect of outliers when the heating system is not operating. SVR has been used for both electricity and heat demand forecasting and has been found to be very efficient and accurate [8], [22]. Therefore, SVR is chosen to predict secondary supply temperature based on outdoor temperature and consumed energy for each building. By considering the status of the system and the predicted value of the secondary supply temperature, the DS system can identify manual changes as follows:
IF the absolute difference (actual – predicted) is greater than the threshold FOR 3 consecutive days THEN changes have occurred during these days.
The warning threshold determines the sensitivity of the system to change. This threshold, set to 4.6°C, was
determined empirically after performing some preliminary tests and checking the results with the subject matter experts. Figure 1 summarizes the process of automatically identifying the manual changes for each building by the proposed DS system.
Algorithms
The k-means algorithm belongs to the group of distance-based clustering methods. It is the best known greedy algorithm for partitioning data into k clusters. This popularity is mainly related to k-means’ simplicity, efficiency, and applied success in partitioning and pattern recognition tasks [2], [23]. It works by reducing the total sum of the squared error over all k clusters. k-means iterates by generating partitions and assigning data to the closest cluster and computing the centroid from a partition until no further improvement can be achieved [23].
The support vector machine (SVM) algorithm is based on statistical learning theory. SVM is a state-of-the-art algorithm, which belongs to a group of supervised learning methods that can solve different ML tasks such as classification, pattern recognition and regression [24]. An extended version of SVM for regression tasks is called support vector regression. SVR uses the training data to find the regression line that best fits the data. Using an epsilon-intensive loss function, SVR produces a decision boundary, a subset of training data which is called support vectors (SVs), in order to determine a tube with radius 𝜀 fitted to the data. In other words, epsilon defines how well the regression line fits the data by ignoring errors as long as they are less than 𝜀.
RESEARCH METHOD Data collection
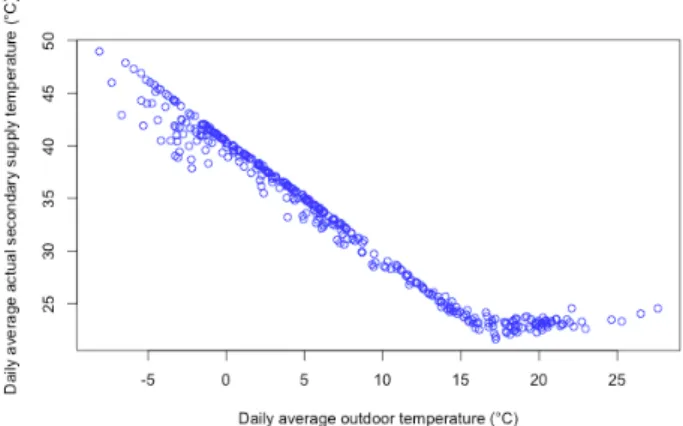
The data used in this study consists of daily average measurements from 9 buildings equipped with the NODA controller. The buildings are located in Karlshamn in south Sweden. The collected data was obtained on the period between April 2014 and March 2016. This yields 730 instances per building (one instance per day). However, since data collection instruments, such as sensors, might be faulty, or since data transmission errors can occur [25], some of the measurements were incomplete. Therefore, after performing the data cleaning process the number of instances decreased to approximately 630 per building. Table 1 summarizes the information and the way the data is split to train and test set for each building. Figure 2 shows the daily average of the secondary supply temperature of building D with respect to the outdoor temperature for the year 2015 (365 instances). The plot shows that the secondary supply temperature has a strong correlation with the outdoor temperature.
We used R and RWeka package to conduct the experiment. R is a language and a free software environment for statistical computing with data [26]. R is widely used for visualization and statistical tasks such as linear and non-linear modelling, regression analysis, and statistical tests. RWeka is an R interface to WEKA (Waikato environment for knowledge analysis) [27]. WEKA [28] is a well-known machine learning and data mining workbench written in Java. It contains a wide range of algorithms for different ML tasks such as classification, regression, and clustering. We used RWeka’s k-means and SVR implementation with their default parameters.
Table 1. Summary of the data collection for each building
Building ID
Data (no. instances) Train set (Apr 14 - Mar 15) Test set (Apr 15 - Mar 16) Total A 251 249 500 B 349 365 714 C 357 365 722 D 357 365 722 E 347 347 694 F 270 365 635 G 251 249 500 H 357 332 689 I 362 345 707 Experimental design
To detect manual changes in the heating system for each building, the implemented DS system uses a two-step classifier. 10-fold cross validation is used on data from April 2014 to March 2015 to build the model for each building. m-fold cross validation is a standard procedure for a model evaluation in ML. The main idea is to randomly split the dataset into m equal subsets. The
model is trained and tested m times. Each time one of the m subsets is used as a test set and the other m-1 subsets are form the training set. The overall performance of the model is computed as the average error across all m runs [29]. The train set is preprocessed and cleaned to make sure that the DS system only learns the normal behavior of the heating system.
Additionally, the quality of the model is tested with the data from April 2015 to March 2016.
The performance of the system is evaluated in two ways: 1) using mean absolute error (MAE) as a performance measure to evaluate the accuracy of SVR in terms of predicting the secondary supply temperature. 𝑀𝐴𝐸 = 1
𝑛 𝑎𝑐𝑡𝑢𝑎𝑙 − 𝑝𝑟𝑒𝑑𝑖𝑐𝑡𝑒𝑑 >
(?"
(1) In equation (1), the actual refers to the measured secondary supply temperature by the controller system, predicted refers to the estimated secondary supply temperature by the proposed DS system, and n is the total number of predicted instances.
2) validating the detected changes by subject matter experts at NODA. In this case the accuracy of the system is calculated based on the number of true positive (TP), true negative (TN), false positive (FP) and false negative (FN) alarms in equation (2). The TPs and TNs are correct classifications. A false positive happens when the result is classified incorrectly as a detected change while it is actually not a change. A false negative occurs when an actual change in the system is not detected [25]. 𝐴𝑐𝑐𝑢𝑟𝑎𝑐𝑦 = 𝑇𝑃 + 𝑇𝑁
𝑇𝑃 + 𝑇𝑁 + 𝐹𝑃 + 𝐹𝑁 (2)
RESULTS
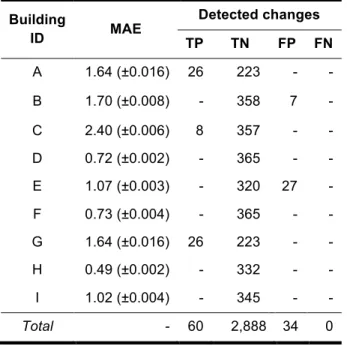
The performance of the proposed DS system is evaluated by using the test data (April 2015 – March 2016) and 10-fold cross validation for each building. Furthermore, the identified changes at each building is validated with NODA’s experts. Table 2 summarizes the performance of the SVR together with the number of manual detected changes at each building. The results show that the DS system detected, in total 60 changes correctly in 3 out of 9 buildings buildings. These changes either related to manual changes or hardware failures. This value represents the number of TP alarms. The majority of the results belonged to the TN category with the value of 2,888. The false positive alarms occurred in 2 buildings and in total contain 34 changes. The main reason for these detected changes are related to a sudden drop in the outdoor temperature, and the fact that the system was not trained for such a situation. No false negative is detected during the experiment. By considering these values and using the equation (2) the
Figure 2. Daily average secondary supply temperature of
building D with respect to the daily average outdoor temperature for the year 2015 (365 instances).
accuracy of the system can be computed as follow: (60+2,888)/(60+2,888+34) = 0.98.
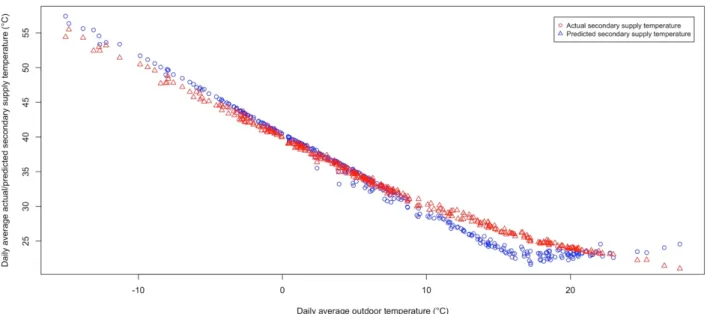
Figures 3 and 4 depict the outcome of the system for two different buildings. Figure 3 shows the detected manual changes occurred during 14th until 23rd of January 2016 at the C building. These manual changes are related to the modification of the temperature of the heating system. Figure 4 is related to the D building. This building has no changes, which can be seen since the actual and predicted secondary supply temperature are closely following each other’s.
DISCUSSION
The experimental results show that the proposed DS system with a two-step classifier is able to detect manual
changes within three days after their occurrence. The accuracy of the system is evaluated by the experts from NODA. The results of the evaluation show that the system has a solid detection ability with an accuracy of 98%. In general, the important aspect of such system is its ability to detect changes correctly and does not miss any changes. To decrease the false alarms (both FP and FN) in the detection task, the main solution is to train the system with the data that represents the normal behavior of the heating system. Moreover, only those deviations that last at least three days are classified as manual changes. In addition, considering an adjustable threshold instead of a fix one can decrease the number of false alarms. Though the false positive alarms can be quickly determined and dismissed by experts, considerable number of false alarms can be disturbing.
Figure 3. Identified manual changes during January 2016 at the C building. The actual secondary supply temperature is
showed in blue against the predicted secondary supply temperature in red. The green crosses identify the detected manual changes by the DS system.
Figure 4. The actual and predicted secondary supply temperature related to building D. This building has no changes during
The proposed DS system is generalizable to similar applications such as detection of change in energy demand or detection of faulty equipment based on abnormal behavior of the heating system.
Table 2. Mean absolute error and standard deviation for
SVR and detected changes for each individual buildings
Building ID MAE Detected changes TP TN FP FN A 1.64 (±0.016) 26 223 - - B 1.70 (±0.008) - 358 7 - C 2.40 (±0.006) 8 357 - - D 0.72 (±0.002) - 365 - - E 1.07 (±0.003) - 320 27 - F 0.73 (±0.004) - 365 - - G 1.64 (±0.016) 26 223 - - H 0.49 (±0.002) - 332 - - I 1.02 (±0.004) - 345 - - Total - 60 2,888 34 0
Note. MAE = mean absolute error, Standard deviation appears within the parentheses.
CONCLUSION
We propose a decision support system for operators in the district heating domain. Currently, the proposed system is applied to detect manual changes in the heating system at the building level. The decision support system uses a two-step classifier, k-means and support vector regression, to identify manual changes within three days after their occurrence and by considering daily average measurements. The performance of the system is evaluated with the real data related to 9 buildings in Sweden. The validity of the results was investigated by the experts at the NODA Intelligent Systems AB. The validation of the results showed that the majority detected changes by the system were true alarms.
Since each building has special characteristics, e.g. its geographical location, used construction materials, and the social behavior of its tenants, having a fixed threshold for all buildings is impractical. Hence, in the future, it is important to investigate how to automatically set the threshold value for each building. Moreover, it is more convenient that operators can have interaction with the DS system by providing feedbacks. Thus, the performance of the system can improve through time.
ACKNOWLEDGEMENT
This work is part of the research project "Scalable resource-efficient systems for big data analytics" funded
by the Knowledge Foundation (grant: 20140032) in Sweden.
REFERENCES
[1] D. Power, Decision Support Systems: Concepts and Resources for Managers. Greenwood Publishing Group, 2002.
[2] P. Flach, Machine Learning: The Art and Science of Algorithms that Make Sense of Data. Cambridge University Press, 2012. [3] N. Eriksson, “Predicting demand in district
heating systems A neural network approach,” Uppsala University, 2012. .
[4] E. Dotzauer, “Simple model for prediction of loads in district-heating systems,” Appl. Energy, vol. 73, no. 3–4, pp. 277–284, Nov. 2002.
[5] N. Fumo, “A review on the basics of building energy estimation,” Renew. Sustain. Energy Rev., vol. 31, pp. 53–60, Mar. 2014.
[6] H. Wiklund, “Short term forecasting on the heat load in a DH-system,” Dist. Heat. Int., vol. 20, no. 5–6, pp. 286–294, 1991.
[7] L. Wu, G. Kaiser, D. Solomon, R. Winter, A. Boulanger, and R. Anderson, “Improving efficiency and reliability of building systems using machine learning and automated online evaluation,” in IEEE Long Island on Systems, Applications and Technology Conference (LISAT), 2012, pp. 1–6.
[8] S. Idowu, S. Saguna, C. Ahlund, and O. Schelen, “Forecasting heat load for smart district heating systems: A machine learning approach,” in IEEE International Conference on Smart Grid Communications (SmartGridComm), 2014, pp. 554–559. [9] T. Catalina, V. Iordache, and B. Caracaleanu,
“Multiple regression model for fast prediction of the heating energy demand,” Energy Build., vol. 57, pp. 302–312, Feb. 2013.
[10] K. Kato, M. Sakawa, and S. Ushiro, “Heat load prediction through recurrent neural network in district heating and cooling systems,” in IEEE International Conference on Systems, Man, and Cybernetics (SMC), 2008, pp. 1401– 1406.
[11] M. Sakawa, S. Ushiro, K. Kato, and K. Ohtsuka, “Cooling load prediction in a district heating and cooling system through simplified robust filter and multi-layered neural network,” in IEEE International Conference on Systems, Man, and Cybernetics (SMC), 1999, vol. 3, pp. 995–1000.
[12] S. Provatas, N. Lavesson, and C. Johansson, “An online machine learning algorithm for heat load forecasting in district heating systems,” in The 14th International Symposium on District Heating and Cooling, 2014.
V. Arya, “A context vector regression based approach for demand forecasting in district heating networks,” in IEEE Innovative on Smart Grid Technologies - Asia (ISGT ASIA), 2015, pp. 1–6.
[14] K. Marik, Z. Schindler, and P. Stluka, “Decision support tools for advanced energy management,” Energy, vol. 33, no. 6, pp. 858– 873, Jun. 2008.
[15] D. Chinese and A. Meneghetti, “Optimisation models for decision support in the development of biomass-based industrial district-heating networks in Italy,” Appl. Energy, vol. 82, no. 3, pp. 228–254, Nov. 2005.
[16] P. Bardouille and J. Koubsky, “Incorporating sustainable development considerations into energy sector decision-making: Malmö Flintränen district heating facility case study,” Energy Policy, vol. 28, no. 10, pp. 689–711, Aug. 2000.
[17] S. N. Petrovic and K. B. Karlsson, “Danish heat atlas as a support tool for energy system models,” Energy Convers. Manag., vol. 87, pp. 1063–1076, Nov. 2014.
[18] A. Meneghetti and G. Nardin, “Enabling industrial symbiosis by a facilities management optimization approach,” J. Clean. Prod., vol. 35, pp. 263–273, Nov. 2012. [19] E. Brembilla and A. Sciomachen, “Design and verification of a large size district heating network by a DSS,” Methods of Operations Research, vol. v 64. .
[20] C. Bordin, A. Gordini, and D. Vigo, “An optimization approach for district heating strategic network design,” Eur. J. Oper. Res., vol. 252, no. 1, pp. 296–307, Jan. 2016.
[21] A. Sciomachen and R. Sozzi, “The algorithmic structure of a decision support system for a design of a district heating network,” Comput. Oper. Res., vol. 17, no. 2, pp. 221–230, Jan. 1990.
[22] B.-J. Chen, M.-W. Chang, and C.-J. Lin, “Load Forecasting Using Support Vector Machines: A Study on EUNITE Competition 2001,” IEEE Trans. Power Syst., vol. 19, no. 4, pp. 1821– 1830, Nov. 2004.
[23] A. K. Jain, “Data clustering: 50 years beyond K-means,” Pattern Recognit. Lett., vol. 31, no. 8, pp. 651–666, Jun. 2010.
[24] V. N. Vapnik, Statistical Learning Theory. Wiley, 1998.
[25] I. H. Witten, E. Frank, and M. A. Hall, Data Mining: Practical Machine Learning Tools and Techniques: Practical Machine Learning Tools and Techniques. Elsevier, 2011. [26] R. Development Core Team, “R: A language
and environment for statistical computing,” Vienna, Austria R Found. Stat. Comput., 2008.
[27] K. Hornik, C. Buchta, and A. Zeileis, “Open-source machine learning: R meets Weka,” Comput. Stat., vol. 24, no. 2, pp. 225–232, May 2008.
[28] M. Hall, E. Frank, G. Holmes, B. Pfahringer, P. Reutemann, and I. H. Witten, “The WEKA data mining software: an update,” ACM SIGKDD Explor. Newsl., vol. 11, no. 1, p. 10, Nov. 2009.
[29] R. Kohavi, “A study of cross-validation and bootstrap for accuracy estimation and model selection,” Int. Jt. Conf. Artif. Intell., 1995.