1
Faculty of Landscape Architecture, Horticulture and Crop Production Science
Green outdoor places, stress and productivity: an
exploratory study at Kista ICT Hub, Stockholm,
Sweden
Tetiana Kasaba
Master Project • 30 credits
Outdoor Environments for Health and Well-Being Master Programme
2
Green outdoor places, stress and productivity: an exploratory study at
Kista ICT Hub, Stockholm, Sweden
Tetiana Kasaba
Supervisor: Elizabeth Marcheschi, Swedish University of Agricultural Sciences, Department of Work Science, Business Economics and Environmental Psychology
Examiner: Elisabeth von Essen, Swedish University of Agricultural Sciences, Department of Work Science, Business Economics and Environmental Psychology
Examiner: Mats Gyllin, Swedish University of Agricultural Sciences, Department of Work
Science, Business Economics and Environmental Psychology
Credits: 30 credits
Level: Second cycle, A2E
Course title: Independent project
Course code: EX0858
Programme/education: Outdoor Environments for Health and Well-Being
Course coordinating department: Department of Work Science, Business Economics and Environmental Psychology
Place of publication: Alnarp
Year of publication: 2019
Online publication: https://stud.epsilon.slu.se
Keywords: workplace, tech hub, ICT, green outdoor environments, stress, productivity
Swedish University of Agricultural Sciences
Faculty of Landscape Architecture, Horticulture and Crop Production Science Department of Work Science, Business Economics and Environmental Psychology
3 ACKNOVLEDGMENTS:
I would like to express my gratitude,
To my family for all their support and for being there with me throughout the entire master program.
To my supervisor for her great support, professionalism, patience and guidance during the research process.
To participants who were kind enough not to reject my invitation to participate in the questionnaire and interviews.
To Swedish University of Agricultural Sciences and course leaders who gave me this chance to participate in this inspiring master program.
4
Table of contents
Abstract ... 5
1. Introduction ... 6
2. Background ... 7
2.1. Tech Hub concept ... 8
2.2. Employee of Tech Hub ... 9
3. Research aim and objectives ... 10
4. Theoretical framework... 10
4.1. Restoration and recovery ... 11
5. Methods ... 12
5.1. Setting and sampling ... 13
5.2. The structure of the questionnaire... 14
5.3. Data collection and data analysis ... 17
5.4. Ethical considerations ... 20
6. Results ... 21
6.1. Perceived stress results and users’ responses to the questionnaire ... 21
6.2. Productivity loss results and users’ responses to the questionnaire ... 23
6.3. Results of qualitative interviews ... 26
6.4. Four zones of contact with outdoors at Kista ICT Hub: results of the observation ... 28
6.5. Perceived vs actual access to greenery in Kista ICT Hub: new findings ... 32
7. Conclusions ... 33
8. Discussions ... 34
8.1. Limitations of the study ... 35
References ... 37
Summary: Poster ... 41
Appendix 1 ... 42
Appendix 2 ... 44
5
Abstract
In modern world a workplace can be defined as a location where someone works for his or her employer, a place of employment. In technology industry such locations got a name - tech hub. A tech hub is a specific area or a part of a city with a specific building or set of buildings where companies can rent space alongside each other to share facilities and ideas. Kista ICT Hub is one of the most important places for jobs in Stockholm and in the region. ICT related professionals are at a constant pressure to deliver services efficiently and have to be cost effective. Hence, stress is high in ICT professions because of their nature of work. The aim of this study is to explore how physical and/or visual access to green outdoor environments at a tech hub, might relate to employees’ stress level and productivity loss. Data about the perceived physical and/or visual access to greenery, perceived stress level and loss of productivity of employees were collected by means of questionnaire, qualitative interviews and observation. The principle of triangulation has been the main approach. Obtained quantitative data indicate that reported perceived level of stress might increase with the presence of green outdoor environments. Whereas productivity loss (fewer missing days due to personal illnesses) seems to improve when physical access/or view of greenery is perceived in the environment. Qualitative data and observation suggest that the lack of greenery at workplace and location of green outdoor places might be compensated by efficient office planning, comfortable interior design, presence of indoor plants and dedicated place for rest and relaxation. Lastly, a discrepancy has been identified between the perception of physical access to greenery and reality.
6
1. Introduction
In modern life, rapid growing process of urbanization has been a new cause for stress and stress-related illnesses. Because of the urbanization, urban dwellers are leading to have, also intensive, busy and unhealthy lives. Although people’s access to restorative nature is decreasing with urbanisation, it is difficult and not necessarily desirable to prevent people from moving to cities. Planners and designers have thus sought to create urban green places that provide opportunities for restoration as part of everyday life (Nordh et al., 2009).
However, in today’s city planning, the importance of green outdoor places in workplaces is less known. It is mostly neglected and within whatever small parts they can take place on the maps, there are no values presented referring to people’s preferences, needs or health. For most employees, the office workplace is where they spend at least one-third of their time; ≥ 8h of the 24-h day and the office workplace is often a stressful, tension-filled, and fatiguing environment with few elements of nature other than the presence of indoor plants and some window view (Chang, & Chen, 2005).
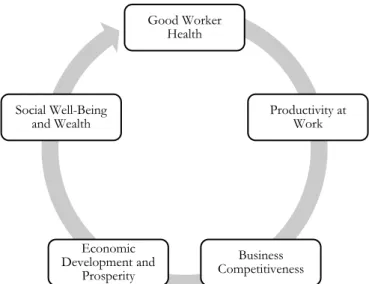
For industrialized societies, the workplace is one of the most important social spaces other than the home, constituting a central concept for several entities: the worker and his/her family, the employing organization, the customers of the organization, and the society as a whole. That is why importance of good worker health contributes to high loss of productivity and success of the enterprise, which leads to economic prosperity in the country, and individual social well-being. Recent WHO-led study estimates that depression and anxiety disorders cost the global economy one trillion USD each year in lost productivity (Burton, WHO, 2010). A negative working environment may lead to physical and mental health problems, absenteeism and lost productivity. Workplaces that promote mental health and relieve work-related stress are more likely to reduce absenteeism, increase productivity loss and benefit from associated economic gains (Figure 1.1), (ibid). The model below reinforces the business case for healthy workplaces. Creating a healthy workplace is not just a matter of caring for the well-being of employees. As indicated below, the health and well-being of workers impacts on the ability of the enterprise to perform its functions, and to meet its vision and mission (ibid).
Figure 1.1. Relationship between health and wealth.
Source: WHO, 2010. Good Worker Health Productivity at Work Business Competitiveness Economic Development and Prosperity Social Well-Being and Wealth
7
2. Background
Stress at work is associated with significant economic and human costs to individuals, businesses, communities and, arguably, society at large: including, increased absenteeism, increased worker turnover, decreased job satisfaction and associated decreases in worker’s health (Leka & Jain, 2010). Work-related stress is commonly defined as a perceived imbalance between the demands made on people and their resources or ability to cope with those demands (WHO, 2005).
“As health is not merely the absence of disease or infirmity but a positive state of complete physical, mental and social well-being, a healthy working environment is one in which there is not only an absence of harmful conditions
but an abundance of health promoting ones”, (WHO, 1986).
From an environmental psychology perspective, “Stress” can be defined as the condition that results when person-environment transactions lead the individual to perceive a discrepancy (whether real or not) between the demands of a situation and the biological, psychological or social resources of the individual (Evans & Cohen, 1987).
Moreover, as suggested by the human environment interaction model, stress can be caused by the need of the individual to develop adaptive strategies in order to balance the environment demand (i.e. different environmental factors/stressors) with the tasks of engagement and their personal characteristics (Küller, 1991). At the workplace, the environmental factors include both; physical and social aspects (i.e. built and natural environment and social support and interaction with people) (Bjornstad, Patil, & Raanaas, 2016).
The vast majority of studies examining work-related stress have tended to focus, almost exclusively, on psychosocial factors of work organisation and the social context of the work environment (for instance, job demand, work motivation, organization culture and climate, control at work etc.) (Cooper & Cartwright, 1997) with, in comparison, limited attention examining the association between characteristics of the physical work environment and work-related stress (Vicher, 2005).
There is, however, a growing body of research suggests that natural settings in the physical working environment and physical and/or visual access to the green outdoor environments at workplace are significantly related to employees’ stress level, wellbeing, job satisfaction and performance (Lottrup, Grahn & Stigsdotter, 2010; Stigsdotter et al., 2010; Nielsen & Hansen, 2007; Kaplan, 1993; Kaplan et al., 1996; Pati, Harvey, & Barach, 2008).
Previous studies indicate that different types of nature contact, either physical or visual, at work are related to less stress and fewer health complains, even more it shows an increased positive attitude towards workplace (Lottrup et al., 2010). Outdoor nature contact, for example taking breaks from work and go to green outdoor environments has significant impact on employees’ stress level and well-being (ibid). For instance, Hernandez (2007) concluded that a garden provided freedom for the employees and became a ‘coping mechanism’ to seek diversion during the working day. This relationship also is in line with other existing studies which have addressed the connection between job satisfaction and workplace outdoor environments and general improvements employees’ overall well-being (Kaplan et al., 1996; Kaplan, 1993; Leather et al., 1998; Shin, 2007).
Findings from a study by Kaplan (1993) indicates that employees with an office window providing views of natural elements such as vegetation (trees, flowers), water, felt less frustrated and reported better overall health. Moreover, Leather et al. (1998) in his study found that a view of a green outdoor environment from the workplace window was related to the employees’ feeling less
8 uptight than if they had a view of an urban scene such as buildings and roads, even with no obstruction of natural light.
In some studies, presence of indoor plants was also found to have positive impact on employees’ psychological and physiological health and well-being (Chen-Yen Chang & Ping-Kun Chen, 2005). Raanaas et al., (2011) studied benefits of plants in a windowed environment and found that participants who had plants present at the workstation showed an improvement in their performance of a directed attention task over time, while participants who sat in a lean control environment did not.
Despite all these known positive impacts of greenery at workplace, the physical environment of office buildings appears to be less important than features of the psychosocial work environment (Marmot et al., 2006). The trend in European city planning is densification (Beatley, 1999). This means that access to green spaces is under threat within urban areas, due to demand for space to construct housing, office buildings, roadways, and other structures. Therefore, small green alternatives such as pocket parks, roof gardens, and tree-lined streets are likely to become more important as settings for restoration (Nordh et al., 2009). Moreover, even if there is presence of greenery nearby, studies show that the majority of office workers do not go outdoors during the working day, mainly due to a perception of being too busy and a working culture that does not include outdoor behaviour (Hitchings, 2010; Lottrup, Stigsdotter, Meilby, & Corazon, 2012).
2.1. Tech Hub concept
In modern world a workplace can be defined as a location where someone works for his or her employer, a place of employment. Such a place can range from a home office to a large office building or factory. In technology industry such locations got a name - tech hub. A tech hub is a specific area or a part of a city with a specific building or set of buildings where companies can rent space alongside each other to share facilities and ideas. It is a place where ideas germinate and companies prosper, meeting investors is easier. A tech hub is a general name and there are derivatives of it such as Information Technology (IT) hub, Information and Communications Technology (ICT) hub, Health hub etc.
The best-known tech hub is probably Silicon Valley, US, California with estimate amount of tech start-up companies 14,000 to 19,000 with 1,7-2,2 million of employees. Silicon Valley is home to the world’s biggest technology companies, including Facebook, Apple, Alphabet (Google’s parent company), Netflix, Tesla, and Intel.
So, what it takes in this day for a city to make it as a tech hub. There are features which identify a tech hub:
a. Immenseness. To be able for tech companies to prosper in the right environment both culturally and geographically and to be constantly innovating and creating it need an immense territory (Tritsch, 2016).
b. STEM. A city needs a reputation for innovation, which is fed by a ready supply of suitably skilled graduates holding degrees in STEM subjects – these are science, technology, engineering and mathematics. Cities with universities that are particularly strong in these areas are more inclined to be home to a tech hub. As well as being able to attract these kinds of graduates to relocate there, cities need to encourage its own residents to study these kinds of subjects. Without the right kind of labour skills, a tech hub will struggle to get off the ground (Svetlik, 2018).
9 c. Prosperity. A tech hub needs to promote opportunities for like-minded techies to meet-up and discuss issues and opportunities in the industry, to share ideas and knowledge on a particular subject. Real, live interaction promotes a healthy ecosystem by encouraging collaboration, coordination and cross-pollination of ideas. This ecosystem is essential to sustain a healthy pipeline of talent and to promote skills-development as part of the job (Tritsch, 2016).
d. Connectivity. Any tech hub worth its salt will need cutting-edge digital connectivity. Fast broadband speeds, city-wide wi-fi, and widespread 4G coverage, as well as early uptake of 5G, when that launches.
e. Infrastructure. Location and transport infrastructure are also key. While technology has rendered a lot of travel unnecessary, it’s still useful to be able to travel into and out of the city quickly and easily for client meetings (Svetlik, 2018).
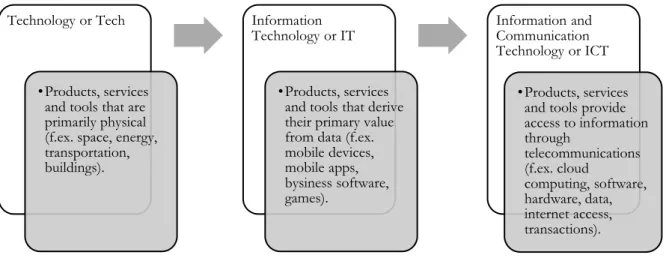
For the purpose of further study, here it is needed to be defined and explained the differences between Tech, IT and ICT. Technology is tool that is designed based on scientific knowledge. Information Technology, or IT, is a product, service or tool that derives its value from data. ICT is sometimes used synonymously with IT; however, ICT is generally used to represent a broader, more comprehensive list of all components related to computer and digital technologies than IT (Figure 1.1.1).
Figure 1.1.1. Definition of Tech, ICT and IT concepts.
To summarise, three of these concepts have one same root which is technology. The definitions are presented for better understanding of the setting in this paper.
2.2. Employee of Tech Hub
After defining what a tech hub is and what it takes today to make a tech hub. It was also clarified the differences and similarities between Tech, IT and ICT concepts with the purpose to define our user group of this study. One of the hub features is STEM subject (sciences, technology, engeneering and mathematics). Thus, education on these subjects are requared to work in tech inductry with computers all the time.
Defining an IT worker is complicated, not only because information technology itself is not clearly defined. A wide range of occupations might be considered IT work. They vary enormously in the technical and other skills required to do the job. These jobs are not located solely in the IT industry (the industry whose primary business is to make and sell IT devices, software, services, and systems), and they do not always involve the design and creation of information technology
Technology or Tech
•Products, services and tools that are primarily physical (f.ex. space, energy, transportation, buildings).
Information Technology or IT
•Products, services and tools that derive their primary value from data (f.ex. mobile devices, mobile apps, bysiness software, games). Information and Communication Technology or ICT •Products, services and tools provide access to information through telecommunications (f.ex. cloud computing, software, hardware, data, internet access, transactions).
10 artifacts. Instead, they are distributed throughout virtually every sector of society, including government, all sectors of industry, and most nonprofit organizations; and they may involve many people who propose, implement, enhance, and maintain systems that rely upon information technology. Not every job in an IT company is necessarily IT work. For instance, the janitors at IBM IT cannot be considered as an IT worker (CRA, 2012).
ICT refers to technologies that provide access to information through telecommunications. It is like IT but focuses primarily on communication technologies. This includes the Internet, data, wireless networks, cell phones, and other communication mediums. Based on the previous description of sectors, we can surely assume that ICT includes IT as a sub group because the set of skills and education background to work in each industry is the same. Therefore, in this paper ICT and IT will be used as synonymes from here onwards.
ICT related professionals are at a constant pressure to deliver services efficiently and have to be cost effective, it requires huge focus on the work task and any mistake can lead to inevitable consequences and material losses for the companies. The results of a detailed questionnaire of around 1000 Employees in ICT sector in India, Chennai shows that around 56% of participants had musculoskeletal symptoms, 22% had newly diagnosed hypertension, 10% - diabetes, 36% - dyslipidaemia, 54% - depression, anxiety and insomnia, 40% - obesity. The stress score was higher in employees who developed diabetes, hypertension and depression (Padma, Anand, Gurukul, Javid, Prasad and Arun, 2015). Hence, stress is high in ICT professions because of their nature of work, target, achievements, night shift, over workload, troubleshooting, optimizing network performance, ensure network security etc.
3. Research aim and objectives
The aim of this study is to explore how physical and/or visual access to green outdoor environments at a tech hub, might relate to employees’ stress level and productivity loss.
The objectives of this study are:
• To explore how physical and/or visual access to green outdoor environments at workplace might relate to stress levels of employees in tech hub;
• To explore how physical and/or visual access to green outdoor environments at workplace might relate to productivity loss of employees in tech hub.
The main motivation for this paper is to capture the contribution of physical and/or visual access to green outdoor environments at workplace for potential reduction of stress level and improvements in productivity loss of employees in tech hub.
The reminder of this paper is organized as follows. Section 3 describes the relevant theories to the topic of this paper. Section 4 focuses on the research approaches adopted in this study: site study, sampling, method of data collection, analysis and interpretation, ethics and limitations. Section 5 describes the results and conclusions. This paper ends, in Section 6, with the discussion of findings and possible improvements, and some final thoughts about future study.
4. Theoretical framework
Daily tool of IT employees is his/her computer and working on a computer can be mentally fatiguing and leave employees with a need for psychological restoration (Evensen et al, 2013). The quantity of empirical evidence supports the benefits of natural environment on psychological and
11 physiological states of health and well-being (Nielsen & Hansen, 2007; Kaplan, 1993; Pati, Harvey, & Barach, 2008).
Based on research and theories on relationships between people and the natural and built environments (Kaplan & Kaplan, 1989; Ulrich, 1984), a restorative environmental design aims to create psychologically supportive environments for people (Kellert, 2008). Ensuring access to window views of nature and keeping potted plants indoors are two common ways of bringing elements of nature into the office environment (Pearson-Mims & Lohr, 2000).
Restoration is a process of renewing psychological resources that have been depleted and the experience of restoration can help the person to perform more effectively, feel better, get along better with others (Hartig, 2004; Hartig, van den Berg et al, 2014). It has been suggested that the natural environment has inherent restorative qualities and this seems to be due to those fractals pattern that are present in nature, which are easier to perceive for the human eye and receptor system (i.e. Perceptual fluency account theory) (von den Bosch, 2018).
The Theoretical framework of this paper focuses on two theories - Attention Restoration Theory (ART) and Stress Recovery Theory (SRT) – which are relevant to the topic and research problem because these theories discuss both, emotional and cognitive aspects (i.e. stress and productivity).
4.1. Restoration and recovery
There are two predominant theories explaining restorative responses to nature which are the Attention Restoration Theory (ART) (Kaplan and Kaplan, 1989) and The Stress Recovery Theory (Ulrich, 1983; Ulrich et al., 1991; Ulrich et al., 1999). They are both build on the notion that people have an inherent ability to attend to vegetation, water and other physical features of the environment that have been beneficial to survival and well-being during human evolution. The Attention Restoration Theory (Kaplan, 1995; Kaplan & Kaplan, 1989) uses a cognitive approach to explain the benefits of viewing nature i.e. people-environment interaction. Direct attention to a work task depends on inhibition that is our ability to keep out other competing stimuli. Such attention can be resource-demanding and can lead to ‘mental fatigue’ or the depletion of cognitive resources after intensive periods of directing attention to a work task (Kaplan & Kaplan, 1989). According to ART, restorative environments have four components: being away, extent, compatibility, and fascination. The last of these is essential for cognitive recovery; a setting having fascinating qualities attracts involuntary attention, which demands less mental effort. Nature attracts one’s attention because of its “soft fascination,” providing the opportunity for recovery from mental fatigue (Kaplan, 1995).
Ulrich (1983; 1991) suggests The Stress Recovery to explain emotional and physiological reactions
to natural environments. Being in a safe natural environment or viewing natural elements (such as vegetation or water) activates a positive affective response in people. According to the theory, positive emotions can block negative affect, and hence have a restorative effect in stressful situations. Adding nature elements to office workplaces can thus have a positive impact on the stress level, health and well-being of the employees (Grinde et al., 2009).
According to Ulrich et al. (1999), views of nature can produce substantial restoration from psychological and physiological stress within a few minutes. The restorative benefits are manifested as a constellation of emotional, psychological and physiological improvements. The negative effects of psycho-physiological stress can also manifest with significant decreases of cognitive performance. However, people can recover cognitive efficiency simply taking advantage of the
12 beneficial effect deriving from exposure to nature (Berto, 2014). At workplace, a view of natural elements was found to buffer the negative impact of job stress, intention to quit and it had a positive effect on general wellbeing and cognitive functioning (Leather et al., 1998).
5. Methods
The purpose of this exploratory study is to understand how physical or visual access to green outdoor environments in tech hub might relate to employees’ stress level and productivity loss. To address the research questions and the theoretical perspective at different levels of the study a mixed method approach was applied in this paper.
For this study, physical and visual access to green outdoor environments, stress level and productivity loss were operationalized in terms of:
• perceived physical and visual access to greenery; perceived visual access means having window view on greenery.
• perceived stress level;
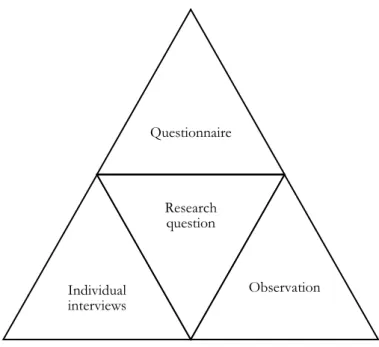
• productivity loss indicated by missing days due to personal illnesses and vacation days. The principle of triangulation has been the main approach in this paper. It implies that to gain reliable knowledge about a problem, one must illuminate that problem from different angels (Grahn, Stigsdotter & Berggren-Bärring, 2005). To achieve this goal, quantitative and qualitative research methods have been applied. Thus, data about the perceived physical and/or visual access to greenery, perceived stress level and productivity loss of employees were collected by means of questionnaire, qualitative interviews and observation.
Figure 4.1. Triangulation approach in collecting data.
The method section of this study is designed in such way. First subsection describes settings and sampling. Second subsection presents the structure of the questionnaire, where the content of the three variables object of investigation is presented. Third and fourth, sections about the qualitative interviews and the observations. The fifth section focuses on data collection and data analysis
Questionnaire Individual interviews Research question Observation
13 approaches. The end of the method section provides information about the study ethical considerations.
5.1. Setting and sampling
Setting
This study took place at Kista ICT Hub, Stockholm during February – March months of 2019. Kista ICT Hub is the largest Information and Communication Technology cluster in Europe and the third largest ICT cluster in the world. As a significant cluster, Kista ICT Hub is one of the most important places for jobs in Sweden and in the region (Kista Science City, 2011).
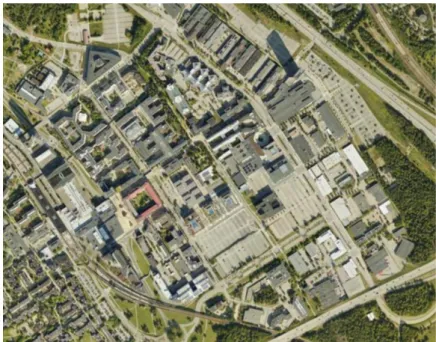
Kista ICT Hub is located just north of Stockholm (Figure 5.1.1). It is home to about 1,400 companies with 31,000 employees, two-thirds of whom work in one of the cluster's 520 ICT companies including well-known names such as Ericsson (with its head office and much of its R&D facilities located at Kista), Microsoft, Nokia, Tele2 and IBM. Kista is clearly specialized in ICT, with shares of about 10% of the firms and more than 30% of employment in this sector. Kista hosts a total of 7000 students attending classes at three institutions: the famous KTH Royal Institute of Technology, the smaller but growing Stockholm University and the recently created European Institute for Technology (EIT-ICT) (Kista Science City, 2011).
Figure 5.1.1. The bird view map of Kista ICT Hub, Stockholm, Sweden.
Source: kartor.eniro.se
Sampling
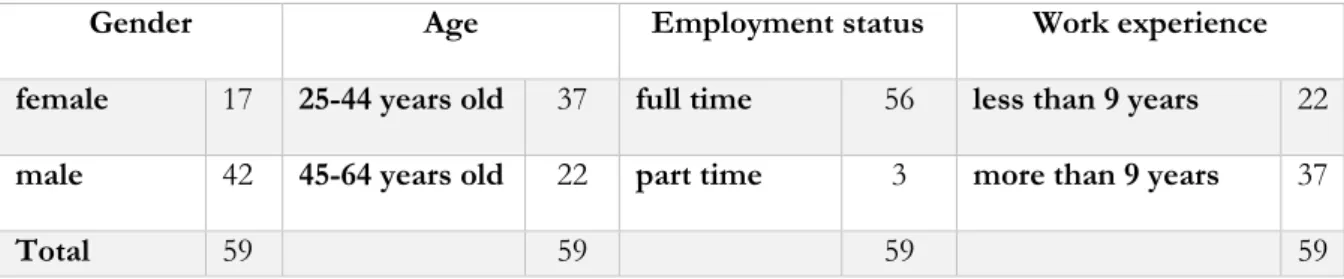
In this exploratory study, 59 employees at Kista ICT Hub, Stockholm, Sweden responded to the questionnaire. 24% of participants responded by means of online self-administrated questionnaire. 76% of participants responded to the same questionnaire by means of performing the survey on site. Table 5.1.1. shows that there were significantly more male respondents than female. Respondents’ ages were varying between 25 and 64 which represents working-age population. The employment status of most of the participants were full time employment i.e. 40 or more hours per week. More than a half of participants reported of having more than nine years of work experience. The other remaining reported work experience less than nine years.
14
Gender Age Employment status Work experience
female 17 25-44 years old 37 full time 56 less than 9 years 22 male 42 45-64 years old 22 part time 3 more than 9 years 37
Total 59 59 59 59
Table 5.1.1. Descriptive statistics of sample size in Kista ICT Hub, Stockholm, n=59.
In addition, Table 5.1.2 shows that more than a half of the participants responded as having physical access to green outdoor places at Kista ICT Hub. Same number of participants reported having visual access to greenery and presence of indoor plants within the area of work desk.
Physical access to
greenery at workplace Visual access to greenery at work desk Presence of indoor plants within the area of vision at work desk
yes 35 yes 38 yes 38
no 24 no 21 no 21
Total 59 59 59
Table 5.1.2. Descriptive statistics of perceived physical and visual access to green outdoor environments with presence of indoor plants, Kista ICT Hub, Stockholm, n=59.
5.2. The structure of the questionnaire
In order to obtain a representative picture of the perception of employees’ physical and visual access to green outdoor places, perceived level of stress and productivity loss in Kista ICT Hub, a questionnaire was conducted in form of pre-coded questions often with categorical multiple-choice options and with close-ended questions. The questionnaire consisted of three parts which addressed the respondent’s:
1. Perceived physical and/or visual access to greenery at workplace and habit of visiting green places (Kirtland et al., 2003).
2. Questions which are directly related to productivity loss indicators (missing days due to personal illnesses and vacation days).
3. Self-perceived stress scale (Lottrup et al., 2012).
Perceived physical and visual access to greenery
Perceive physical and visual access were operationalized respectively in terms of, viewing and actual access to greenery, as reported by the participants. In order to grasp the perception of physical and visual access to greenery the questions were designed based upon the scale proposed by Lottrup, Grahn and Stigsdotter in article “Workplace greenery and perceived level of stress: Benefits of access to green outdoor environments at the workplace” (2012).
According to the study above, to use access to workplace greenery as one single variable, the respondents’ answers to the questions about physical and visual (window view) access to greenery at workplace were classified into a Workplace Greenery Index which were applied in much more complicated calculations by using ANOVA SAS GLM Type III analyses.
15 This exploratory study had an intent to discover possible impact of different combination of physical and/or visual access to greenery at ICT Hub on stress level and productivity loss of ICT employees. That is why, similar approach was used as it has been done in Lottrup, Grahn and Stigsdotter study (2012) to create single variables according participants responses to the questionnaire.
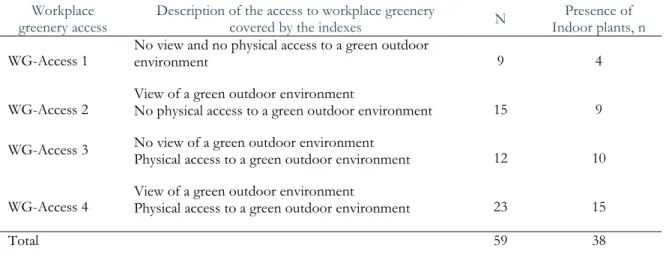
The combinations with different access to Workplace greenery in this study are consisting of four levels: no view and no physical access to a green outdoor environment; view of a green outdoor environment but no physical access; no view of a green outdoor environment but physical access; view and physical access to a green outdoor environment. Each level was named as Workplace Greenery Access with numeric identification accordingly where each number represents the respective group only and not used in any further calculation. The variables were used only to describe a possible impact of different combinations of physical and/or visual access to green outdoor places on stress level and loss of productivity and will be presented in the results part of this paper. For a more detailed description of the Workplace Greenery Accesses, see Table 5.2.1. There is also a mediator variable which is the presence of indoor plants in the workplace. As we see, among 59 responses there are 9 participants who do not have physical access to greenery at workplace as well as no window view on greenery. 15 participants reported as no physical access to workplace greenery but having window view on greenery. 12 participants responded as having no window view on greenery but have physical access to green outdoor environments and last index shows that 23 participants have both physical access and window view to greenery at workplace. These indexes will be used to see how perceived level of stress and productivity loss might varies depending on the perception of physical and/or visual access to green outdoor places.
Table 5.2.1. Description of the construction of “Workplace Greenery Access”, n=59, n miss =0. Workplace
greenery access Description of the access to workplace greenery covered by the indexes N Indoor plants, n Presence of WG-Access 1 No view and no physical access to a green outdoor environment 9 4 WG-Access 2 View of a green outdoor environment No physical access to a green outdoor environment 15 9 WG-Access 3 No view of a green outdoor environment Physical access to a green outdoor environment 12 10
WG-Access 4 View of a green outdoor environment Physical access to a green outdoor environment 23 15
Total 59 38
In our definition of the concept of green outdoor environments, all types of open green spaces in the town or city were included. In these environments, there are varying amounts of vegetation; they may have been designed by landscape architects or by others. The environment may also appear in the form of relatively wild nature.
Perceived Level of Stress
In the present work the most prominent and clearest questions from the stress and crisis inventory scale - SCI-93 (Nyström & Nyström, 1995), were chosen to achieve a simplified, but relevant, subset of questions to examine perceived stress (the questions were chosen based on Grahn and Stigsdotter (2003; 2011) own interpretation). They chose seven prominent symptoms such as
16 fatigue, headache, pain in the nape of the neck, backache, irritation, stress and common cold (Grahn & Stigsdotter, 2003).
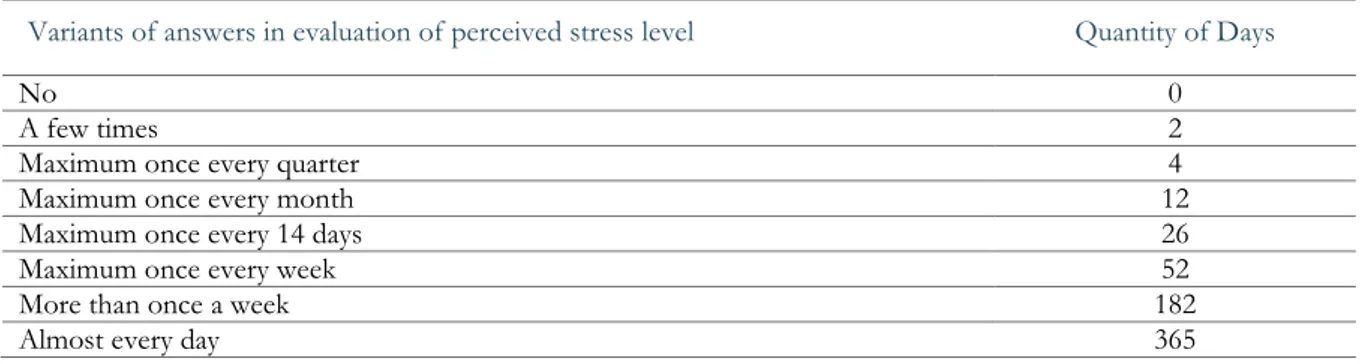
It was observed that nearly all participants reported Irritation, Stress and Fatigue. However, headache, pain in the nape, backache and common cold had nearly no answers. Even if several respondents reported such symptoms, the grading of responses were among bottom of the measurement scale. Therefore, Irritation, Stress and Fatigue has been chosen as dominant symptoms to represent Level of Stress in this paper. In this study, responses of perceived level of stress were pre coded (Table 5.2.2). Quantity of days refers to the yearly occurrence numbers of each answer. For instance, once every month corresponds to 12 occurrences per year. Therefore, corresponding quantity of days is 12.
Table 5.2.2. Description of pre coded answers of Level of Stress evaluation.
Variants of answers in evaluation of perceived stress level Quantity of Days
No 0
A few times 2
Maximum once every quarter 4
Maximum once every month 12
Maximum once every 14 days 26
Maximum once every week 52
More than once a week 182
Almost every day 365
Measure of productivity loss
Stress at work has direct impact on physiological and psychological health and well-being of employees (Evans & Cohen, 1987). That is why, in this study, the primary interest was to estimate the productivity loss due to personal illness. An ideal measure of absenteeism would reflect illness-related absences only (Zhang et al., 2017). To measure the productivity loss illness-related to absenteeism in the questionnaire the question: “In the past 12 months, how many days of work have you missed due to personal illness?” was used. The responses were grouped into six categories: “0 days”, “1-7 days”, “8-14 days”, “15-30 days”, “31-90 days” and “91-365 days”.
Another focus was the days of vacations which might have positive impact on boosting the productivity loss. Recent studies show that employees who take regular and long vacations are more efficient and productive (Schulze, 2017). The Project: Time Off survey which took place in USA in 2018 indicated that participants who reported a year or more without a vacation, might have missed an opportunity to relax and reduce stress. To measure the days of vacation in the questionnaire the question: “In the past 12 months, how many vacation days have you used?” was used. The responses were grouped into six categories: “0 days”, “1-7 days”, “8-14 days”, “15-30 days”, “31-45 days” and “46 and more days”.
These two variables were chosen to measure the loss of productivity because they are well defined, easily observed and easily measured. Also, since they were used in the questionnaire, the main target was to have questions short and clear. Needless to say, the results of these questions do not have any documental evidences, that is why it has been completely relied on participants’ responses.
17
5.3. Data collection and data analysis
Data collection procedure
For the quantitative data, two approaches were used. First, participants received an e-mail with the self-administrated questionnaire link. The questionnaire was conducted by utilizing Google Form platform in Google Drive. The purpose of the questionnaire was clearly described, and participants were informed of their voluntary participation, anonymity and confidentiality. One reminder was sent after two weeks. Recruiting participants relied on companies being willing to distribute the questionnaire via their employees’ e-mail list and to allow their employees to complete the survey in their free time.
The companies were chosen based on their access and no access to green outdoor environments with intend to find out if it has impact on stress level and productivity loss of employees in Kista ICT Hub, Stockholm. The results of this approach brought 14 responses, which was not satisfying for the study.
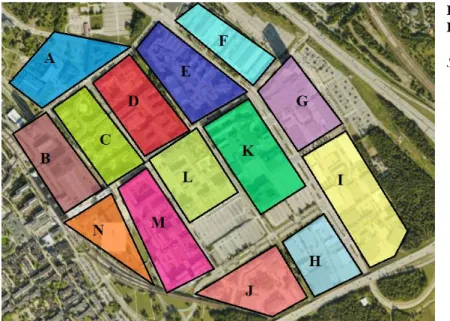
That is why second approach to collect quantitative data was performed by the researcher visiting the site study. The survey in place brought additional 45 responses. The survey to perform around pedestrian places and common areas where employees spend their free time. This approach allowed to reach larger population base. Before responding, the participants were asked if they were currently working in the Kista ICT Hub. Then they were informed about the purpose of the research, anonymity and confidentiality. Before proceeding to the questions, a participant had to mark the location of their workplace on the map. Recruiting participants during street survey were based on participants’ willingness to participate in the survey.
As it is mentioned above, the location of participants who responded to self-administrated questionnaire were identified in advance. However, for street survey a different approach was needed where participants could easy identify their location in Kista ICT Hub without revealing the name of their companies. The approach which will allow to keep participants’ confidentiality and anonymity. That is why it was decided to divide Kista ICT Hub on sections which have or do not have physical accesses to green outdoor environments. By following the hub’s grid architecture 14 sections were defined (Figure 5.3.1).
Figure 5.3.1. Defined 14 sections for Kista ICT Hub.
18 For the qualitative data, four employees in Kista ICT Hub were contacted where two of them agreed to participate in the study. The participants were interviewed separately and before proceeding the interview, they were informed about voluntary participation, anonymity and confidentiality. After this step, a consent form from each participant were obtained (Appendix 1). The first interview was recorded on a mobile device (iPhone 6) and the second interview was recorded by note-taking due to the participant’s preferences.
The basic ambition in the interviews was for the interviewer to understand the participants’ perception of physical environments at their workplace, work-related stress and loss of productivity. Another ambition was to create a comfortable situation for the interviewees to be able to talk freely (Brinkman & Kvale, 2015). Semi-structured interviews were conducted to obtain qualitative data through open-ended questions. This technique was used to collect data about employees’ perception of Kista ICT Hub as a workplace and also, to have better understanding of their physical environment and perception of work-related stress, and how it might have impact on loss of productivity.
Investigation of the study site was performed by the author of this work with the purpose of observation and the four zones of contact with the outdoors proposed by Bengtsson (2015) was employed to spot the possible contacts with green outdoor environments in Kista ICT Hub. This approach allowed to have visual description of how outdoor environments are in contact with workplaces in the ICT hub. The results of observation were supported by photographs taken during site visits. Observation of physical access to green outdoor environments in Kista ICT Hub, bird views in Eniro Maps, Google Maps were used. Also, site visits were conducted to investigate the zones of contact with outdoors.
Data analysis
Quantitative data were analysed by using Statistical Package for the Social Sciences (SPSS) and descriptive statistics. Such descriptive statistic is used to describe the frequencies the respondents perceived physical and/or visual access to green outdoor environments, perceived level of stress and productivity loss (missing days due to personal illnesses, days of vacation).
The obtained qualitative data of this explorative study was analysed by applying Thematic analysis with the purpose to find out possible patterns across the data sets that are important to the description of participants’ perception of their physical environment at workplace, work-related stress and productivity loss with association to the research questions.
To analyse the obtained qualitative data six steps were followed (Bryman, 2016):
• Familiarization with the data. The audio recordings and the taken written notes were verbatim transcribed. The transcribed interviews were read and re-read multiple times, to become immersed and familiar with its content. During this step the notes were taken to start defining the preliminary ideas for codes that can describe the content of the data (Bryman, 2016).
• Generating initial codes. This step involved generation of initial codes that identify important features of the data that might be relevant for answering the research question. After that, all the codes were gathered together for next step of analysis (Bryman, 2016). • Searching for themes and subthemes. At this stage of the analysis the main target was
19 could be raised to the subthemes or main themes (in this stage they are potential themes and subthemes) (Bryman, 2016). Also, the codes which formed a theme, or a subtheme had a written short summary. This allows to have better understanding why the codes were formed under a defined theme or subtheme.
• Reviewing the themes and the subthemes. This phase involved reviewing the preliminary defined subthemes and themes, to determine that they were in line with the obtained data and also answered the research question. Moreover, the preliminary names were defined to capture large portions of the data and provide genuine insights into the data (Bryman, 2016).
• Defining and naming the themes. At this stage, the identified themes in the previous step were named and described. Theme names were developed to describe the findings and also, to identify the relation between the themes as well as to overall research question (Bryman, 2016).
• Writing up. This was the final stage of the thematic analysis. The prepared basis in previous steps allowed to present the findings.
Four zones of contact with outdoors were applied to investigate Kista ICT Hub regarding possible interactions with green outdoor environments. Site visits were performed to spot and observe green outdoor places on premises and their access. Four zones of contact model was utilized to asses if workplaces in Kista ICT Hub actually have access to greenery. The purpose to utilize a scientific model for such judgement was to avoid subjective decisions by the observer whether a workplace has access or not. Moreover, it was also intended to have a holistic approach which can be applied to the entire area in focus. It was considered that a workplace has access to greenery if Zone 2 or Zone 3 are present. Utilizing four zones of contact is not having direct impact on the results of the quantitative data. However, it was used to support the obtained results and explorative view of entire area.
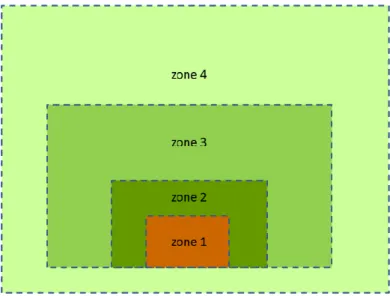
The principle model of the four zones of contact with the outdoors proposed by Bengtsson (2015) could be used as a mean to elucidate in what way differences in site planning and content in relation to the different zones would result in different experiences of contact with the outdoors (Figure 5.3.2).
Figure 5.3.2. A principle model of four zones of contact with the outdoors: zone 1, form inside a building; zone 2, transition zone; zone 3, immediate surroundings; and zone 4, the wider neighbourhood.
Zone one corresponds to the possibility of having contact with the outdoors from inside a building (viewing through a window). Zone two corresponds to transition zones between indoors and outdoors, for instance, balconies, patios, conservatories and entrance areas. Zone three
20 corresponds to the immediate surroundings, that is, ideally an associated garden or park. Zone four corresponds to the wider neighbourhood and whatever opportunities for outdoor experience and use it might encompass (Bengtsson, 2015).
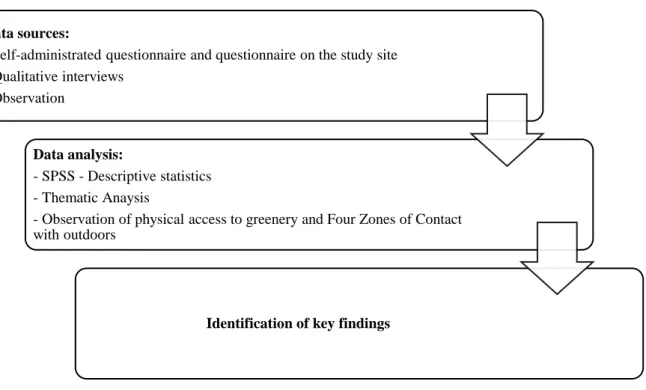
A summary of the methodological progression is reported in Figure 5.3.3.
Figure 5.3.3. Design of the methodological approach.
After collecting and analysing each type of data, triangulation method was utilized to have holistic view of employees’ perception of physical access to green outdoor environments, perception of stress level and loss of productivity.
5.4. Ethical considerations
In this study, three basic ethical considerations for involving persons in research were applied during the entire research process which are full disclosure, confidentiality and voluntary participation. To achieve these basic principles a consent cover letter was used to provide participants with full information about the aim of the study, the procedure of the study, their confidentiality, their right of voluntary participation and contact information about investigator (Appendix 1).
The first principle is full disclosure. This principle allows any person who participates in a study to have full disclosure of the purpose and procedures of the study (DePoy & Gitlin, 2016). The second principle is confidentiality. It considers that all information shaped by a respondent in the study is kept confidential. Only specified members of the research team can have access to the respondent’s information (DePoy & Gitlin, 2016). The paper confidentiality was ensured in several ways. Firstly, the names of the respondents were changed in qualitative interviews. This procedure ensures that the identity of the respondents in this study is protected and that the information they provided will not be linked to their names in the future (DePoy & Gitlin, 2016). The questionnaire was designed in a way that respondents did not need to answer their personal information such as own name, address, name of a workplace etc.
Data sources:
- Self-administrated questionnaire and questionnaire on the study site - Qualitative interviews
- Observation
Data analysis:
- SPSS - Descriptive statistics - Thematic Anaysis
- Observation of physical access to greenery and Four Zones of Contact with outdoors
21 The third and the last principle is voluntary participation. Individuals have the right to choose to participate or not. Also, during the participation in the study, participants had right to refuse to answer any questions in the interviews and the questionnaire (DePoy & Gitlin, 2016). For qualitative part of the study Informal Consent Form was conducted. The conversation about participation in the interview was done by emails.
6. Results
6.1. Perceived stress results and users’ responses to the questionnaire
The results of the quantitative data suggest that perceived access to green outdoor environments seems to have less of an impact on level of stress (LS) of employees in Kista ICT Hub. On the contrary, the results might indicate that the perceived LS might be increasing among those who have reported physical and/or visual access to green outdoor environments (Table 6.1.1).Table 6.1.1. Descriptive statistics of perceived Level of Stress per WG-Access*, n=59.
no a few times max once every quarter max once every month max once every 14 days max once every week more than once a week almost every day WG-Access1 N=9 irritation 6 - 1 - - 2 - - stress 4 2 - 2 - - 1 - fatigue 7 2 - - - - WG-Access2 N=15 irritation 6 4 3 - - - 2 - stress 1 7 2 - 1 2 2 - fatigue 10 4 - - - - WG-Access3 N=12 irritation 5 2 1 - - 1 1 2 stress 4 3 1 1 2 1 - - fatigue 5 3 - - - 2 - 2 WG-Access4 N=23 irritation 13 3 - - - 2 2 3 stress 6 8 1 2 2 2 2 - fatigue 13 5 - - - 3 - 2
* WG-Access1 stands for no visual and physical access to a green outdoor place. WG-Access2 indicates having view but no physical access to a green outdoor place. WG-Access3 represents no view but physical access to a green outdoor place. WG-Access4 stands for having both physical and visual access to a green outdoor place.
Figure 5.1.1 below visualizes the received responses. Vertical lines represent the highest quantity responses. Horizontal lines are used for responses with lesser quantity for the sake of better understanding. WG-Access1 represents the responses of participants which reported having no access and no view of green outdoor environments. On the other end of the scale, WG-Access4 represents the participants which reported having both physical access and view of green outdoor environments. From left to right, there is a visible tendency of having more “no” responses. This can be understood as the LS is increasing when there is access and/or view of outdoor green spaces.
The presence of indoor plants within the area of participants’ work desk (Table 5.2.1) shows that particularly those who are in category of WG-Access1 might compensate the absence of physical
22 access and window view on greenery at workplace with presence of indoor plants – 4 out of 9. In total, 38 participants reported of having indoor plants within the area of their work desk.
If respondents in WG-Access3 reported higher quantity of “no” responses, results might have indicated a linear increase in “no” responses. Out of 12 respondents in WG-Access3 reported having indoor plants around their working spots (Table 5.2.1). This can further support that greenery around working places might increase perceived LS. Thus, it might as well be a probable cause in the increased LS among WG-Access3 among the scale of responses compared to the general tendency from WG-Access1 to WG-Access4.
The participants who responded in the questionnaire of having physical access to green outdoor places in their workplace (n=35) were asked an additional question; “How often do they visit green outdoor places during office hours?” (Table 6.1.2).
The results might indicate that the respondents who visit outdoor spaces frequently have already high levels of stress and would like to relieve it by taking refuge in green environments and the respondents who reported the least quantity of visits might have highest stress levels due to lack of stress relieving properties of green spaces in their daily work life.
Table 6.1.2. Descriptive statistics of visiting green outdoor places during office hours and LS, n=35.
no a few times max once every quarter max once every month max once every 14 days max once every week more than once a week almost every day Everyday n=7 irritation 5 1 - - - 1 stress 3 2 - - 2 - - - fatigue 3 1 - - - 1 - 2 A few times a week n=7 irritation 4 - 1 - - - 1 1 stress 1 3 - - 1 1 1 - fatigue 5 - - - - 1 - 1 0 2 4 6 8 10 12 14
irritation stress fatigue irritation stress fatigue irritation stress fatigue irritation stress fatigue
WG-Index1 WG-Index2 WG-Index3 WG-Index4
Figure 6.1.1. Frequency responses of LS per WG-Index, n=59.
no a few times max once every quarter max once every month max once every 14 days max once every week more than once a week almost every day
23 About once a week n=3 irritation - 2 - - - 1 - - stress - 1 1 1 - - - - fatigue - 3 - - - - A few times a month n=3 irritation 2 - - - 1 stress 1 2 - - - - fatigue 2 - - - - 1 - - Once a month n=0 irritation - - - - stress - - - - fatigue - - - - Less than once a
month n=15
irritation 7 2 - - - 2 2 2
stress 5 2 2 2 1 2 1 -
fatigue 8 4 - - - 2 - 1
Figure 6.1.2 is visualising the results of LS and frequency of visiting greenery in Kista ICT Hub. Horizontal lines are used for responses with lesser quantity and vertical lines represents the highest quantity of responses for the sake of better understanding. The graph is divided into sections
which represent frequency of visiting where each sector also includes LS. There is a visible tendency of “no” and “a few times” responses for LS which increases in the beginning of the graph, decreases in the middle and again increases in the end. LS response “max once every week” is increasing when frequency of visiting greenery is “less than once a month”.
6.2. Productivity loss results and users’ responses to the questionnaire
As per the obtained results, productivity loss of employees seems to improve (missing days due to personal illness seems to decrease) when window view, perceived physical access or both are introduced in a workplace in Kista ICT hub. However, another criterion of productivity loss,0 1 2 3 4 5 6 7 8 9 ir ritatio n st re ss fa tig ue irr itatio n st re ss fa tig ue ir ritatio n st re ss fa tig ue ir ritatio n st re ss fa tig ue ir ritatio n st re ss fa tig ue ir ritatio n st re ss fa tig ue
Every day n=7 A few times a
week n=7 About once aweek n=3 A few times amonth n=3 Once a monthn=0 Less than once amonth n=15
Figure 6.1.2. Frequency responses of LS and visiting greenry in Kista ICT Hub, n=35.
no a few times max once every quarter
max once every month max once every 14 days max once every week
24 vacation days, has not shown clear indications. Because there is a tendency to have longer vacations in certain periods in Sweden due to established culture which might be the main reason to use vacation days rather than feeling of exhaustion.
Table 6.2.1 shows reported missing days per Workplace Greenery Access. In WG-Access2 -where participants reported having no physical access to outdoor green environments but having window view – there is a single participant who reported days of absence between 91-365. If we can consider this as an anomaly in the collected data due to limited amount of participants, remaining values show a tendency of no missing days or 1-7 missing days while moving from WG-Access1 where participants reported no physical access or view towards WG-Access4 where participants reported both physical access or view.
Table 6.2.1. Descriptive statistics of missing days due to personal illnesses per WG-Access, n=59. Workplace
Greenery Access
n 0 days 1-7 days 8-14 days 15-30 days 31-90
days 91-365 days WG-Access1 9 4 3 1 1 - - WG-Access2 15 5 7 1 1 - 1 WG-Access3 12 4 5 3 - - - WG-Access4 23 9 13 1 - - - Total 59 22 28 6 2 - 1
Figure 6.2.1 visualizes the received responses regarding missing days due to personal illnesses. WG-Access4 – where respondents reported both access and view to green outdoor environments – includes the most responses within 0 days or 1-7 days range. WG-Access3 – where participants reported having access to green environments but no view- received the most amount of responses within 8-14 days range. This shows a clear increase compared to WG-Access4 which might indicate that having both view and access to green outdoor environments decreasing the number of missing days due to illnesses.
WG-Access2 – where participants reported having view but no access to green outdoor environments- reported missing days in all ranges but 31-90. This is also a clear increase compared to WG-Access3 and WG-Access4. WG-Access1 – where participants have no view and no access to green outdoor environments- also received responses in 8-14 days and 15-30 days ranges. Overall, a tendency of increasing missing days ranges have been observed from the scale of
0 2 4 6 8 10 12 14
0 days 1-7 days 8-14 days 15-30 days 31-90 days 91-365 days
6.2.1. Frequency response of missing days due to personal illnesses per WG-Access, n=59, n miss=0
25 responses where both access and view to green outdoor spaces is present towards the responses where none is present. This might indicate that presence of access and view to green outdoor spaces decreases the missing days due to personal illnesses. Thus, it might be an indication of increase in loss of productivity.
Table 6.2.2 shows the vacation days used by participants. It is observed that majority of reported vacation days in all WG-Accesses are either in 15-30 days or 31-45 days range. In Sweden -where Kista ICT hub is located – there is a historical culture to use vacation days in December, July or August. It is enforced on employers by law to provide minimum 20 vacation days per year and employees are supported to use their vacation days. Use of vacation days are even incentivised by additional payment per used vacation days. Therefore, it is very common to have vacations spanning between 25 to 40 days per year which are usually used during Christmas or Summer months.
Table 6.2.2. Descriptive statistics of vacation days per WG-Access, n=59. Workplace
Greenery Access
n 0 days 1-7 days 8-14 days 15-30 days 31-45
days 46 – more days
WG-Access1 9 - - - 6 3 -
WG-Access2 12 2 1 - 8 2 2
WG-Access3 15 - 1 2 6 2 1
WG-Access4 23 1 - - 14 8 -
Total 59 3 2 2 34 15 3
Looking at the detailed data in Figure 6.2.2, it is hard to draw conclusions or observe a tendency for the reported days within 15-30 and 31-45 ranges due to Sweden’s vacation culture among employees. The only observation which stands out is that WG-Access1 – where participants reported no access and no greenery – didn’t report any vacation days in lesser ranges.
This might indicate that there might be a relationship between exhaustion and access and/or view of green outdoor environments in workplace. When there is no access or no view, exhaustion of employees might increase, resulting in using more or entire vacation allowances.
In conclusion, quantitative data might indicate that reported perceived level of stress might increase with the presence of green outdoor environments. Whereas loss of productivity (fewer
0 2 4 6 8 10 12 14 16
0 days 1-7 days 8-14 days 15-30 days 31-90 days 91-365 days
6.2.2. Frequency response of vacation days per WG-Access, n=59, n miss=0
26 missing days due to personal illnesses) seems to improve when physical access/or view of greenery is perceived in the environment. It is harder to observe a tendency in vacation days due to explained vacation culture in Sweden. However, more vacation allowances seem to be used when access and/or view greenery is not present. It might also be important to note that using more vacation days might indicate a positive impact on productivity loss.
6.3. Results of qualitative interviews
This study investigated the view of employees on how they perceived Kista ICT hub as a workplace via qualitative interviews. A semi-structured interview technique (Kvale & Brinkmann, 2015) was used to investigate individual experience and perception of physical environment and work-related stress in Kista ICT Hub. Therefore, questions were asked to motivate participants to describe their own experiences and their descriptions are mainly originated from each individual’s perception. In quantitative data, participants responded with the perception of physical and or visual access to greenery at Kista ICT Hub, perceived level of stress and productivity. To support findings, in this part of the paper, participants described their own experience and perception of physical environment in Kista ICT Hub and work-related stress. In this way, the interviews complement the data gathered through responses of the questionnaire.
Three main themes and eleven subthemes were identified. The main themes are perception of physical
environment at Kista ICT Hub, cooperative and individual perception of work-related stress and access and use of green places in Kista ICT Hub (Figure 6.3.1). One theme Workplace Attachment was identified but will
not be considered in this paper and it might have future possible opportunity for deeper investigation (Appendix 2).
The defined main themes of qualitative interviews complement and expend the understanding of how employees in Kista ICT Hub perceive their workplace in term of as entire environment of the hub and as an environment of office workplace.
The first main theme is perception of physical environment at Kista ICT Hub. It described how physical environmental parameters such as architecture (modern buildings), urban planning (dense environment), landscape design (concrete environment), interior design and planning of the offices have impact on employees’ daily work life. The design of physical environment at Kista ICT Hub has direct impact on perceived physical and visual access to green outdoor places. Lastly, concrete environments show the lack of greenery at the hub.
The second main theme is access and use of green outdoor places in Kista ICT Hub. The theme was defined with two subthemes: design and location of green places and weather conditions. Design and location support the results of observation of access to green outdoor places at Kista ICT Hub (further in the paper). In the hub only one park is present, and its design and location have impact on visiting the green outdoor places. The subtheme -weather conditions- describe that the use of greenery depends on time of the seasons and weather.
The third main theme is cooperation and individual perception of work-related stress. It shows that organization of work and personal relationships have impact on stress at work. The subtheme - balancing R&R time - might show that it has impact on visiting workplace greenery at Kista ICT Hub and as a result impact on reducing stress level and improve employees’ productivity.
27
Figure 6.3.1. Description of the defined main themes and subthemes of the qualitative interviews.
An example of how a workplace of an ICT company at Kista ICT Hb looks like is presented on the Figure 6.3.2. The photos were provided by a participant of the qualitative interview.
Figure 6.3.2. Interior design, office planning and window views of one company in Kista ICT Hub.
Source: Tetiana Kasaba
Among the photos, one of the window views is facing parking lot and far standing buildings. Another picture of window view with massage chairs has partly view of next standing buildings and far view of the forest. The idea of having massage chairs with such a view might have restorative purposes for employees in this company.
Perception of physical
environment at Kista ICT Hub
•dense environment •concrete environment •modern buildings •office interior design •smart office planning Cooperative and individual perception of work-related stress •team work •individual qualities •balancing R&R time
Access and use of green places in Kista ICT Hub
•design of green outdoor places •location of green
outdoor places •weather contidions
28 Another positive attribute of this workplace is the glass roof. Such roof allows to get more day light which is very important for health of employees. Glass roofs were observed also in other building at Kista ICT Hub.
In conclusion, the lack of greenery at workplace and location of green outdoor places might be compensated by efficient office planning, comfortable interior design, presence of indoor plants and dedicated place for rest and relaxation. Moreover, perception of work-related stress focuses mostly on performance in the teamwork, individual qualities and lastly balancing time between work and rest. However, the improvement of environmental qualities might have positive impact on visiting green outdoor places (further in discussions).
6.4. Four zones of contact with outdoors at Kista ICT Hub: results of
the observation
To have a holistic view of possible contacts with outdoors in Kista ICT Hub, Four Zones of contact was applied. The overview of each Zone in Kista ICT Hub is presented in the Figure 6.4.1 below. Supporting pictures are attached in the following text.
Kista ICT Hub has clear grid architecture with main urban corridors such as Hanstavägen, Torshamnsgatan, Kistagången and Kistavägen. According to Stockholm City Plan (2009), access to parks in central Kista - which is Kista ICT Hub - needs to be improved, e.g. by developing Grönalandsgången into a green corridor and creating parks within the block structure. Grönlandsparken is the only park present in Kista ICT Hub and located at the corner between Kistagången and Grönalandsgången.
Figure 6.4.1. Overview map of Kista ICT Hub with four zones of contact with outdoors.
29 Detailed description of each zones of contact with the outdoors at Kista ICT Hub is presented in Figure 6.4.2.
Figure 6.4.2. Description of Four Zones of Contact with outdoors in Kista ICT Hub.
Photo collage below shows the transition zones in Kista ICT Hub which were identified during observation (Figure 6.4.3).
Figure 6.4.3. Transition zones in Kista ICT Hub, Stockholm.
Source: Tetiana Kasaba.
Zone 2 is represented by balconies which are attached along the buildings. They are designed like solid concrete structures with opportunity to plant trees, bushes and other green plants. Such
Zone 1 •Zone 1 is from
inside a building (window view). In this paper we do not evaluate the window views of the buildings in Kista ICT Hub due to lack of access to the buildings and also lack of time to eveluate buildings in each sector. Zone 2 •Zone 2 or transition zone is represented by patios, balconies, coservatory or any transitional places between Zone 1 and 3. In Kista ICT Hub two places which have visible Zone 2 were identified. (Photo collage 5.1.1). Zone 3 •Grönlandsparken, Grönalandsgången-the green corridor and some inner court yards are representing Zone 3 (Photo collage 5.1.2).
Zone 4 •Kista ICT Hub is a
very dense area and Zone 4 here is represented by companies
buildings, shooping center, parking lots, resedential area, tower blocks and forest on south east side of the hub.