J
Ö N K Ö P I N GI
N T E R N A T I O N A LB
U S I N E S SS
C H O O LJÖNKÖPI NG UNIVER SITY
I n i t i a l P u b l i c O f f e r i n g s
An investigation of IPO’s on the Swedish market
Paper within Business Administration Author: Emelie Alm
Elin Berglund Andreas Falk Tutor: Urban Österlund
Acknowledgements
We would like to express our thanks to our tutor Urban Österlund, for the guidance and encouragement when developing this thesis. His inspiration and knowledge has attributed to this final work. We would also like to thank Marcus Rylander at Handelsbanken for let-ting us perform an interview and giving his insight and expertise within the subject. We are also very grateful to all the companies involved in this thesis. Finally, we would like to thank our seminar group for the feedback and discussions during this fall.
_______________ _______________ _______________
Kandidatuppsats inom Finans
Titel:
Börsnoteringar
Författare:
Emelie Alm, Elin Berglund, Andreas Falk
Handledare:
Urban Österlund
Jönköping
December 2009
Ämnesord:
Underprisning, underprestation, börsnotering
Sammanfattning
När företag genomför en börsnotering kan aktien ha en tendens att vara underprisad och därför prestera sämre i långa loppet. Med underprisning menas att den nyintroducerade ak-tien stänger första dagen av handel på ett högre pris än den introducerades till. Det akak-tien ökar i pris är det marknadsvärde som den potentiellt kunde ha introducerats till, och de pengar som gått förlorade brukas kallas ”money left on the table”. Att aktien visar negativ utveckling under en längre tid (3-5 år) jämfört med konkurrenter i samma industri, är sagt att vara ett resultat av underprissättningen vid introduktionen.
Dessa två beteenden av aktien kan vara ett problem för företaget, dock kan investerare göra en stor vinst om man säljer första dagen innan aktien börjar gå dåligt. Detta området är undersökt av många och det finna otroligt mycket fakta, dock är det mesta gjort utav amerikanska författare. Just därför är syftet med denna uppsats att undersöka om dessa fe-nomen existerar på den svenska marknaden.
För att kunna svara på vår frågeställning, har vi undersökt företag som börsnoterats mellan 1998-2007. Aktiens utveckling under första dagen har analyserats, och vi kom fram till att 51% utav vårt urval var underprisade vid första dagens handel. Den genomsnittliga under-prissättningen var 23%, och det så kallade ”money left on the table” var 3,9 MSEK per fö-retag i genomsnitt. Aktiens utveckling efter ett och fem år har undersökts för att se hur den utvecklats på lång sikt, vi har också jämfört med övriga inom industrin samt industri index för att få ett så sanningsenligt resultat som möjligt. Vi kom fram till att företag som under-prisat sin aktie också underpresterat på lång sikt. Vi kan inte svara på exakt när det vänder från negativ till positiv utveckling, dock ser vi trender i respektive industri. IT-sektorn hade negativ utveckling efter fem år och Industri-sektorn hade efter fem år en positiv utveckling.
Bachelor thesis in Business Administration
Title:
Initial public offerings
Authors:
Emelie Alm, Elin Berglund, Andreas Falk
Tutor:
Urban Österlund
Jönköping
December 2009
Keywords:
Underpricing, Under performance, IPO
Summary
When a firm decides to go public, two abnormalities often occur. The first is called under-pricing and can be defined as a capital loss made by the company the first day of trade due to that the offer price is lower than the closing price after the first day of trade. The in-crease in stock value is equal to capital the issuing firm could have gained initially; this capi-tal loss is referred to as the “money left on the table”. The second abnormality, underper-formance, is a result from underpricing. It means that the stocks that were underpriced the first day also tend to underperform 3-5 years after the initial public offering (IPO) com-pared to competitors within the same industry.
These two abnormalities together constitutes a problem for the firm because they loose money. However it also enables investors to make a quick profit. There are many studies covering this area, however mostly made by Americans, therefore the aim of this report is to investigate whether the two abnormalities exist on the Swedish market.
In order to fulfill the purpose, companies that were listed 1998-2007 were investigated. Their stock performance is analyzed both on the day of IPO, where we found that 51% of the companies listed were underpriced, with an average of 23%. Further, the average “money left on the table” per company was 3.9 MSEK. The stock prices have also been analyzed on a one- as well as a five year period after the IPO in order to analyze the long-run performance and later compare it to the rest of the industry as well as industry index. We found that most of the companies that where underpriced also tend to follow under-performance. However, how long they underperform depends in which industry they oper-ate. The IT industry, for example had a negative performance after 5 years whereas the In-dustrials industry has the turning-point from negative performance before 5 years.
Table of Contents
1
Introduction ... 1
1.1 Background ... 1 1.2 Problem discussion ... 2 1.3 Research questions ... 4 1.4 Purpose ... 5 1.5 Delimitations ... 5 1.6 Methodology ... 6 1.6.1 Data collection ... 61.6.2 Qualitative- and quantitative data ... 7
1.6.3 Approach: inductive / deductive ... 7
2
Theoretical framework ... 8
2.1 The process ... 8
2.2 Reasons for underpricing ... 10
2.2.1 The winners curse hypothesis ... 10
2.2.2 The market feedback hypothesis ... 11
2.2.3 The bandwagon hypothesis ... 11
2.2.4 The investment banker’s monopsony power hypothesis ... 12
2.2.5 The lawsuit avoidance hypothesis ... 12
2.2.6 The signaling hypothesis ... 12
2.2.7 The ownership dispersion hypothesis ... 12
2.3 Money left on the table ... 12
2.4 Best effort vs. firm commitment ... 13
2.5 Explanations for underperformance... 13
2.5.1 “Hot issue” market phenomena ... 14
2.5.2 Windows of opportunity ... 14
2.6 Ownership structure ... 15
2.7 Jenkinson’s trading rule ... 15
2.8 Previous studies ... 15
2.8.1 Empirical evidence of IPO underpricing ... 16
2.8.2 Empirical evidence of IPO long-run underperformance ... 16
3
Method ... 17
3.1 Qualitative interview with M. Rylander ... 17
3.2 Data analysis ... 18
3.2.1 Interview analysis ... 18
3.2.2 Index ... 19
3.2.3 Formula for underpricing ... 19
3.2.4 Formulas for under performance ... 19
3.3 Reliability and validity ... 20
4
Empirical findings ... 21
4.1 Sample ... 21
4.2 Distribution of sample ... 21
4.3 Index ... 22
4.4 Underpricing ... 23
4.4.2 Underpricing per year ... 24
4.5 Money left on the table ... 26
4.6 Performance in general ... 26
4.7 Performance per industry ... 27
4.7.1 Consumer discretionary ... 27 4.7.2 IT ... 28 4.7.3 Industrials ... 28 4.7.4 Telecommunication ... 29 4.7.5 Finance ... 29 4.7.6 Healthcare ... 30
4.8 Hot issue market phenomena ... 30
4.9 Ownership structure ... 31
4.10 Presentation of qualitative interview ... 32
5
Analysis ... 39
5.1 The process ... 39
5.1.1 Preparation phase ... 39
5.1.2 Trading-phase ... 40
5.2 Reasons for underpricing ... 41
5.3 General underpricing ... 43
5.3.1 Underpricing per industry ... 43
5.4 Underpricing per year ... 44
5.5 Best effort vs. Firm commitment ... 44
5.6 Reasons for underperformance ... 45
5.6.1 “Hot Issue” market ... 45
5.6.2 ”Windows of Opportunity” ... 46
5.7 General underperformance ... 46
5.7.1 Underperformance per industry ... 47
5.8 Ownership structure ... 48
5.9 Jenkinson’s trading rule ... 48
5.10 Cooperation between the investment bank and the issuing firm ... 49
5.11 Analysis evaluation and critique ... 49
6
Conclusion ... 51
7
Further studies ... 53
8
References ... 54
9
Appendix ... 56
9.1 Average initial returns ... 56
9.2 Sample; company and date of IPO ... 58
9.3 Industry distribution of underpriced stocks ... 61
9.4 Average underpricing per industry ... 61
9.5 Money left on the table ... 62
9.6 Average underpricing per year ... 64
9.7 Proportion underpriced per year ... 64
9.8 Consumer discretionary ... 65
9.9 IT ... 66
9.12 Finance ... 69
9.13 Healthcare ... 70
9.14 Hot issue market phenomena ... 71
9.15 Ownership structure 1 ... 72
9.16 Ownership structure 2 ... 72
9.17 The Swedish and U.S General Index during 1997-2009 ... 73
9.18 BNP growth in Sweden, the U.S and the 15 larger economies in the EU. ... 73
9.19 Underperformance per industry ... 74
List of figures
Figure 1. Number of IPO’s in Sweden 1997-2008 (p. 2) Figure 2. Evidence for underpricing (p. 4)
Figure 3. Illustration of theory (p. 8) Figure 4. The IPO process (p. 10)
Figure 5. Empirical evidence for underperformance (p. 16) Figure 6. Industry distribution of sample (p. 21)
Figure 7. Industry indexes in comparison to general index (p. 22) Figure 8 Underpricing per industry (p.24)
Figure 9. Average percentage underpricing per year (p. 24) Figure 10. Underpricing per year (pp. 25-26)
Figure 11. Underperformance in consumer discretionary industry (p. 28) Figure 12. Underperformance in IT industry (p. 28)
Figure 13. Underperformance in industrials industry (p. 29)
Figure 14. Underperformance in telecommunication industry (p. 29) Figure 15. Underperformance in finance industry (p. 30)
Figure 16 Underperformance in healthcare industry (p. 30)
Figure 17. Complex equity capital markets transaction with many parties in-volved (p. 32)
1
Introduction
This section will introduce the characteristics of IPO’s as well as define the area of investigation. This will be followed by our purpose and how we will obtain data in order to answer our purpose.
1.1 Background
A firms’ decision to go public is a truly entrepreneurial activity. The process of taking the firm public enable firms to sell some of their shares to receive a reward from previous ef-fort. According to research, going public is also a cheap way of collecting funds and pursue growth opportunities (Rock, 1986).
An Initial Public Offering, IPO, occurs when a firm chose to go public. The initial public offering is the issuing firm’s first offer to sell stock to the public (Jenkinson & Ljungqvist, 2001). Firms have interest of going public out of many reasons, and some of the most common are that they want to increase the liquidity of the firm, and therefore they want to raise more equity capital, which is referred to as the primary market. To increase capital in the firm is beneficial, of course for the firm itself, but also for the founders and other stakeholders. Since, in the future, they might convert their contribution for their own win-ning as profit or return on stock. Another reason is tied to the secondary market, which is referred to the ability of further stock trading (Jenkinson and Ljungqvist, 2001). Of course, these are not the only reasons why a firm chose to go public. The decision is individual and depends on in which situation the company is. However, Ellingsen and Rydqvist (1997) states the four most common reasons to be; raise capital, boost the company image, in-crease publicity, and also use it to motivate the employees.
The IPO process involves three actors that each has different roles and responsibilities within the IPO. The three actors are; the issuing firm, the underwriter(s), and the investors. Naturally, the interests might be contradictious, because the issuing firm wants to raise as much capital as possible from the floatation, while the investors’ aim is to buy the newly is-sues at a bargain price and the underwriters work as an intermediate that works in the in-terest of both the issuing firm as well as the investors (Jenkinson and Ljungqvist, 2001). From the table below (figure 1) there is an illustration of all IPO activity during 1997 until 2008, as well as the total changes to the list during the same period. With changes to the
list, it means that all the IPO are included but also when a company switch in-between dif-ferent lists it appears as a change, however they are not newly listed.
Figure 1. Number of IPO’s in Sweden 1997-2008
The number of IPO’s varies a lot depending on the market, evidence shows that firms are more willing to go public during times when the market is performing well, also called a hot market, instead of cold market, which is the situation when the market has poor per-formance (Ritter et. al, 2002). This theory can be applied both worldwide and in Sweden. The numbers of IPO’s were a lot higher during the late 1990’s, the IT-era and 2006-2007 than today. On the Swedish stock market (OMX) there has been no IPO’s at all so far this year and this is not very surprising with respect to the financial crises last summer (www.e24.se). There has never been this low IPO activity in Europe since 1940. For exam-ple, the value of IPO’s in Europe during the three first months 2009 was 9 million €, while the same period the previous year was equal to 2 billion € (www.dn.se).
1.2 Problem discussion
Since there are three actors taking part in an IPO, there are of course pitfalls coming up. The most common and thoroughly described in various literature are two situations that is said to occurs in all IPO’s; the first situation is that the stocks are underpriced at the offer price, and the second situation is defined as long run underperformance of the stocks. These two are hereafter referred to as “the two abnormalities”
The concept of underpricing is referred to the abnormal initial returns that exists due to the closing price of the first day of trading is significantly higher than the offer price (Ritter et.
0 10 20 30 40 50 60 70 80 1 9 9 7 1 9 9 8 1 9 9 9 2 0 0 0 2 0 0 1 2 0 0 2 2 0 0 3 2 0 0 4 2 0 0 5 2 0 0 6 2 0 0 7 2 0 0 8
Changes to the list IPO
al, 1984). Due to this gap in prices the concept “money left on the table” is born. In other words, the company could have been able to raise the same amount of new capital, but to a lower amount of shares, or they could have been able to raise more capital. However, the investment bank ultimately determines the offer price. They are the ones that have to bal-ance the issuing firm’s wish of a high initial return and the buyers, the investors, craving to buy as cheap as possible (Jenkinson and Ljungqvist, 2001).
The long-run underperformance phenomena show that, on average, IPO’s tend to under-perform their competitors within the same industry and size three- to six years after the ac-tual IPO. The impact of the second abnormality is mostly that investors that bought shares from a newly issued firm tend to lose money if they do not sell the share within the first days. Furthermore, the money the investors probably made because of the underpricing on the first day tend to be followed by the long run underperformance and even out (Jenkin-son and Ljungqvist, 2001).
These two phenomenon’s discussed above does not only exist in literature and research re-ports, as can be seen in the table below, there are both international and domestic evidence for that (extended table, see appendix 9.1), which shows a summary of 6 countries, where research proves a positive average initial return. Furthermore, a very famous example on the Swedish market is the IPO of Telia AB. It was listed year 2000 when there was a hot market and the IT industry was flourishing. There was a big hype for this IPO because Te-lia was owned by the Swedish government. The offer price was 85 SEK and the launch was very successful, especially during the first hours of trading when the highest price was 94 SEK. However, the closing price was only 88,50 SEK and since then the price began to de-cline. Though, even if this IPO is commonly known and the circumstances with a non-private company may have an impact, however, the phenomena per see is not surprising. And as discussed already; it is not unusual at all. In most of the IPOs, there is a under price and those who wants o take advantage of this has to make sure to sell the stock, preferably the same day. According to DagensNyheter, research shows that five years after the IPO the average firm has a stock price 20-30% lower than the offer price (www.dn.se).
Country Source Sample size
Time period Average initial return China Datar and Mao; Gu and Qin (A shares) 432 1990-2000 256,90%
Gremany Ljungqvist 407 1978-1999 27,70%
India Skrishnamurti and Kumar 98 1992-1993 35,30%
Norway Emilsen, Pedersen adn Saettern 68 1984-1996 12,50%
Sweden Rydqvist 251 1980-1994 34,10%
USA Ibbotson, Sindelar and Ritter 14840 1960-2001 18,40%
Figure 2. Evidence for underpricing (Leleux & Muzyka, 1997)
1.3 Research questions
We have seen theories as well as research surrounding this field, and also evidence of un-derpricing and underperformance on the Swedish market, for example Telia. We find it in-teresting and worth analyzing if these two abnormalities exist on the Swedish market be-tween the years 1998-2007. We will also look into the process of an IPO, the price setting and the cooperation between the underwriter and the issuing firm.
Additionally, some of the questions we will try to answer are;
• To what extent did underpricing and “money left on the table” exist on the Swedish market be-tween 1998-2007? What trends can be seen within each industry?
The relation between the investment bank and the company will be investigated to be able to see if the company can affect the offerprice, and than to what extent, since it is con-nected to how much money the company might “leave on the table”. Therefore the next question is:
• During the IPO process, is it possible for the issuing firm to affect the offer price?
We want to investigate the stock market between the chosen years to follow individual stocks and see if there are any connections with underpricing and underperformance. Therefore the next question must be:
• Of all the Swedish firms that went public during 1998-2007, how did they perform in the long run in terms of stock-performance compared to industry and index? After one year? -Five years?
When going public one of the major things changing is the ownership of the company. Theory has several views on whether how this will reflect the overall performance. There-fore the next question is:
• Does the ownership structure influence the performance of the company in the long run?
1.4 Purpose
We will examine if the companies that performed an IPO on the Swedish stock exchange year 1998-2007 follow the two abnormalities; underpricing and long run underperfor-mance.
1.5 Delimitations
The research is limited to the years 1998-2007 and to the Swedish stock market (OMX) which means that other lists such as “Aktietorget” and other alternative lists will not be in our focus. These 10 years are chosen, first because we want to diminish the impact from the IT-era, which took place 1998-2000, as well as include situations of both hot and cold markets. During the IT-era there were a lot of IPO’s, however in the aftermath (2-3 years) of this period it was a exceptional low IPO activity. Therefore, we have chosen a period that goes beyond these two extreme situations. Second, we want the IPOs to be relatively recent in order to be more accurate. We will further limit out research to the companies that are still listed on the Swedish stock exchange; therefore, companies that have been through a merger or acquisition will not be included, as well as other reasons for being de-listed. An example can be Framtidsfabriken, listed in 1999. They are not included in our re-search since they had a merger with two other companies and developed Framfab. Today they have been developed into Bredbandsbolaget. Another example is Telelogica which were listen in 1999 and delisted in 2008.
Out of the three actors that are involved in an IPO, the reflections will come from the un-derwriter’s point of view and a little from the issuing firms perspective, however we will not put much concerns about the investors.
While writing this report many parameters are excluded that, of course, have a significant impact on the IPO and the performance thereafter. Instead, the report focuses on analyz-ing stock performance; consequently, other parameters such as growth etc will not be cov-ered.
1.6 Methodology
Since we want to analyze the IPO process and the performance afterwards, we mostly col-lect data from the stock market i.e. stock prices, in order to see if there is underpricing or not. The abnormality of under performance in the long run will be analyzed with similar data but on two occasions (one and five years) as well as compared with a industry index. Further, the process of the IPO will be briefly analyzed through the prospectus and an in-terview with Marcus Rylander at Equity Capital Market, Handelsbanken. Later our findings will be analyzed and compared with already existing theories from different experts that will enable us to find answer to our research questions. The method used to achieve our purpose is combined with several different techniques in data collection as well as analysis. In order to fulfill the purpose of this report, the following steps will be taken;
• Explain the two abnormalities from theory
• Collect qualitative data from an investment banker who operates as IPO advisor
• Analyze stock prices and industry index
• Calculate underpricing and performance
• Draw conclusions whether the two abnormalities exist on the Swedish market.
1.6.1 Data collection
This field of study is widely explored and a popular research topic, therefore there is no problem in finding appropriate data. There are many different ways of searching for data, however the issue is to select data that is relevant and suits the research topic. Therefore keywords are of great importance when searching through databases to find scientific ar-ticles and journals. The database that we have used is called JULIA and is provided by Jönköping International Business School. Previous reports have been a great source but al-so the belonging reference lists. Other al-sources are of course online al-sources and books. In order to get a clear structure in the report the purpose will be divided into two sub-purposes with respect to the abnormalities; underpricing and underperformance. Addition-ally, a study of the process will be described.
Authors divide data into two different sources; primary- and secondary data. Within re-search studies, primary data is defined as the original analysis of data. Whereas secondary data can be recognized as re-analysis of data in order to answer a research question or
pur-pose. In other words, the researcher wants to answer a new question with old data (Glass, 1976). Both underpricing and long run underperformance will be answered by secondary data, mostly by stock prices, industry indexes, and the prospectus. However, primary data will be collected with an interview to analyze the different decisions within the process.
1.6.2 Qualitative- and quantitative data
There are mainly two different ways to classify information; qualitative- and quantitative data. Qualitative data is described as “soft” while the quantitative data in giving a lot of in-formation often statistics and numbers; one can see the data as “hard”. It is easy to put the quantitative data into diagrams and charts and analyze it, while the qualitative data puts more emphasis on the understanding (Saunders, Lewis & Thornhill, 2007).
Within this paper quantitative and qualitative data are combined. The discussions about qu-alitative data will originate from an interview with an expert within IPO’s. The ququ-alitative data will give information that is expressed by words and will give us a deeper and clearer understanding of the problem. Therefore, this information is highly important while ana-lyzing the data and, according to Saunders et al (2007), gives more opportunities to answer the research questions. The secondary data will be used to investigate and to strengthen our theories; this type of data is categorized as quantitative data.
1.6.3 Approach: inductive / deductive
There are two different ways of performing research. First, deductive approach is when testing the theory towards the empirical facts, proving the theory in a structured way. One chooses a theory and create hypothesis and through this make a strategy of how to test the hypothesis and in the end have a generalized conclusion. Second, inductive approach is more flexible compared to the deductive approach and develops a theory from the results on the observation. This approach is more specific than the deductive observation (Saund-ers et al, 2007).
This report will be based on deductive approach, since the theories of underpricing and long run underperformance will be proved against our quantitative data collection. Further, the theories describing the IPO process will be compared to qualitative data from the Swe-dish process.
2
Theoretical framework
This section will initially introduce the reader with the process behind a IPO. This will be followed by the retical explanations for underpricing as well as the
be empirical evidence that prove the two abnormalities.
Figure 3. Illustration of theory
2.1 The process
According to Jenkinson and Ljungqvist (2001) the process behind the IPO
into five general stages. To start, the company needs to decide upon which market to all cate the shares. Today, it is not given that the company will select the domestic list, as it was a few years ago.
Second, the issuing firm needs to c
underwriter. The issuing firm and its underwriter will set up the most appropriate arrang ment regarding the commitment of each actor. There are two arrangements that are fr quently used; Firm Commitme
Theory
Theoretical framework
This section will initially introduce the reader with the process behind a IPO. This will be followed by the rpricing as well as the long-run underperformance. Towards the end there will be empirical evidence that prove the two abnormalities.
Figure 3. Illustration of theory
The process
According to Jenkinson and Ljungqvist (2001) the process behind the IPO
into five general stages. To start, the company needs to decide upon which market to all cate the shares. Today, it is not given that the company will select the domestic list, as it
Second, the issuing firm needs to choose an investment bank that will be used as the lead underwriter. The issuing firm and its underwriter will set up the most appropriate arrang ment regarding the commitment of each actor. There are two arrangements that are fr quently used; Firm Commitment and Best Efforts. Using a Firm Commitment arrangement
The process Underpricing
Reasons for underpricing
Money left on the table
Best effort vs Firm committment Underperformance Explanations of underperformance Ownership structure Jenkinson's Trading rule
This section will initially introduce the reader with the process behind a IPO. This will be followed by theo-nderperformance. Towards the end there will
According to Jenkinson and Ljungqvist (2001) the process behind the IPO can be divided into five general stages. To start, the company needs to decide upon which market to allo-cate the shares. Today, it is not given that the company will select the domestic list, as it
hoose an investment bank that will be used as the lead underwriter. The issuing firm and its underwriter will set up the most appropriate arrange-ment regarding the commitarrange-ment of each actor. There are two arrangearrange-ments that are fre-nt and Best Efforts. Using a Firm Commitmefre-nt arrangemefre-nt
"Hot issue" market phenomena
Windows of opportunity
the investment bank will purchase all the new issued shares from the issuing firm and then be responsible to re-sell it to the public. The investment bank gets compensated by the spread between their purchase price and public offering price. Using firm commitment, the investment bank assumes the full risk of not being able to sell all the shares at the deter-mined price. When using a best effort arrangement, the investment bank agrees to help the issuing firm to sell their shares. The investment bank acts as an intermediary between the potential investors and the issuing firm. Using this arrangement, the investment bank does not bear the risk of non-sold shares.
The next phase is to construct a prospectus which content is produced in order to satisfy the regulatory authorities. The prospectus is the document where the company is intro-duced to the equity market and potential investors. According to Gometz et.al (1997) it is the most important decision basis and everything that can have an impact weather to invest or not need to be included in this document. The following bullets are examples of infor-mation that should be included in a prospectus:
• Terms and conditions – describes the offer in general, such as price • Background and motive – why the issuing firm chooses to go public • Presentation of the company
• Financial development – such as key ratios • Financial targets – as well as future investments • Ownership structure
• Previous annual reports
Jenkinson and Ljungqvist (2001) continuously describes the process with the fourth phase, where the underwriter will also start pre-marketing the issue in order to get some informa-tion from the market (the potential investors). The underwriter wants to get some feedback that can be used when determining the offer price range. The initial price range will typical-ly change during the process and ontypical-ly when the final prospectus is launched the price in-terval is set. The marketing can be done in various ways. The most common activity is Road shows. During a road show, the investment banker’s aim is to publicize and promote the new offer.
The next phase is to set the offer price and determine the allocation of issued shares. There are in general three ways, which the issue will be allocated and priced. During a fixed-price offering the offer price is set before the requests of shares have been submitted. If there is
fixed-price allocation, the requests for larger numbers of issues will be cut back more often than requests for reasonable numbers. The second way, book building, where the inves ment banks seek to find potential investors. They usually aim for large institutional inve tors and, simply speaking, asking them how many issues they want to buy at what price. The Book building mechanism is used to receive information from potential investors about the future offer price. This method is very useful since it reduces the information asymmetric that are present in IPO decisions. Accordingly, this will lead to that the firm will go public at a fair price. However, a key feature is that the underwriter, with the help of the issuing firm, has the complete discretion in allocating the shares
final allocation of shares will most often be according the preference of the initial pre issuing shareholders. The third and final way of setting the price is called auctions. Here, a tendency is that the price will be set slightly
bids are submitted (Jenkinson and Ljungqvist, 2001).
Figure 4. The IPO process
2.2 Reasons for underpricing
When performing an IPO, the theory of
initial returns as they buy newly issued shares and sell them after one day. It is hard to put the finger exactly on why the issues are underpriced, and what are the factors underlying the phenomena. The explanations are most of the time about the relations between t three actors within an IPO; the investors, the investment bank and the issuing firm, and the flow of information.
According to Ritter (1998) there are seven reasons why shares might be underpriced:
2.2.1 The winners curse hypothesis
Explained as one of the most significant foundations why
rem is about “informed” investors, those who have access to more information about the n, the requests for larger numbers of issues will be cut back more often than requests for reasonable numbers. The second way, book building, where the inves ment banks seek to find potential investors. They usually aim for large institutional inve
d, simply speaking, asking them how many issues they want to buy at what price. The Book building mechanism is used to receive information from potential investors about the future offer price. This method is very useful since it reduces the information ymmetric that are present in IPO decisions. Accordingly, this will lead to that the firm will go public at a fair price. However, a key feature is that the underwriter, with the help of the issuing firm, has the complete discretion in allocating the shares. Based upon this, the final allocation of shares will most often be according the preference of the initial pre issuing shareholders. The third and final way of setting the price is called auctions. Here, a tendency is that the price will be set slightly below the market clearing price a
(Jenkinson and Ljungqvist, 2001).
Figure 4. The IPO process
Reasons for underpricing
When performing an IPO, the theory of underpricing arises, and states that investors make urns as they buy newly issued shares and sell them after one day. It is hard to put the finger exactly on why the issues are underpriced, and what are the factors underlying the phenomena. The explanations are most of the time about the relations between t three actors within an IPO; the investors, the investment bank and the issuing firm, and the
According to Ritter (1998) there are seven reasons why shares might be underpriced:
The winners curse hypothesis
most significant foundations why underpricing
rem is about “informed” investors, those who have access to more information about the n, the requests for larger numbers of issues will be cut back more often than requests for reasonable numbers. The second way, book building, where the invest-ment banks seek to find potential investors. They usually aim for large institutional inves-d, simply speaking, asking them how many issues they want to buy at what price. The Book building mechanism is used to receive information from potential investors about the future offer price. This method is very useful since it reduces the information ymmetric that are present in IPO decisions. Accordingly, this will lead to that the firm will go public at a fair price. However, a key feature is that the underwriter, with the help of . Based upon this, the final allocation of shares will most often be according the preference of the initial pre-issuing shareholders. The third and final way of setting the price is called auctions. Here, a
below the market clearing price after all the
arises, and states that investors make urns as they buy newly issued shares and sell them after one day. It is hard to put the finger exactly on why the issues are underpriced, and what are the factors underlying the phenomena. The explanations are most of the time about the relations between the three actors within an IPO; the investors, the investment bank and the issuing firm, and the
According to Ritter (1998) there are seven reasons why shares might be underpriced:
underpricing appears. The theo-rem is about “informed” investors, those who have access to more information about the
IPO than other investors (Rock, 1986). Furthermore, it is when an investor gets all the shares that he wants, but it is only under the circumstance that the more informed inves-tors do not want those shares. When a share is offered to a fixed price, invesinves-tors need to think rational. However, it is not the rationale itself that leads to underpricing. If the in-formation is asymmetric, meaning that some investors have an inin-formation advantage compared to others, some investors will suffer from that. Then, some will get more of the underpriced and desirable shares and some will get less, and these might receive more of the non-desirable shares, which lead to the winners curse. Furthermore, the investors that suffer from the winners curse, also called the least informed, will only ask for shares if they are sufficiently underpriced so that it covers the loss of compensation from the “unfair” al-location of shares (Ritter, 1998).
The informed investors are more likely to buy when the stocks are underpriced since they have more knowledge (not buying when overpriced etc). If people start notice that in-formed investors are buying, the uninin-formed investors will buy as well, and there will be excess demand(Rock, 1998).
2.2.2 The market feedback hypothesis
The market feedback hypothesis results from the pricing stage of the IPO-process. Often, the investment bank consult with different investors about their valuation of the issuing firm and also about their willingness to invest, this is referred to as book building. Accord-ing to the market feedback hypothesis; in order for the investors to reveal truthful informa-tion they will be compensated with underpriced shares. It also states that the amount of underpricing is dependent on the type of information that comes out of it. Therefore, the offer price is either pushed upwards or downwards by the demand. Furthermore, the shares that are increased in price are said to be even more underpriced compared to the shares with an offer price that is devalued (Ritter, 1998).
2.2.3 The bandwagon hypothesis
The bandwagon hypothesis is quite similar to herding. It is when investors not only take investment decisions grounded on their own information. If there is a trend showing that a lot of people buy a particular share, an investor might also buy it even though it would never happen out of his own analysis. And the other way around, an investor might skip buying a share if he sees that no one else does. Because of this tendency, the investment
banks use underpricing to get attention and to attract the first couple of investors, who lat-er on, preflat-erably, boost the demand furthlat-er by the bandwagon effect (Rittlat-er, 1998).
2.2.4 The investment banker’s monopsony power hypothesis
This hypothesis talks more about the strategy from the investment bank itself. It states that they use their competitive advantage in terms of superior knowledge about market condi-tions compared to other players and therefore the shares are underpriced (Ritter, 1998).
2.2.5 The lawsuit avoidance hypothesis
This hypothesis can easily be seen as very general reason for underpricing. It states that in-vestment banker’s simply under price shares in order to avoid potential lawsuits in the fu-ture. It became more relevant after the Securities Act of 1933, where it is written that “all participants in the offer who sign the prospectus are liable for any material omissions” (Rit-ter, 1998 p. 9).
2.2.6 The signaling hypothesis
Is often used to maintain a good relation with other players. Ritter express it as “underpric-ing leaves a good taste” because it enables investors to make profit because of the potential initial returns (Ritter, 1998).
2.2.7 The ownership dispersion hypothesis
Might be more of consideration for the issuing firm itself. It is because they want to under price in order to attract as many small shareholders as possible, simply because the man-agement wants to keep control of the firm, another reason is that the underpricing increas-es the liquidity of the market for the share. The risk is high that only large but few invincreas-es- inves-tors’ wants and even have the capacity of buying shares if they would not be underpriced (Ritter, 1998).
2.3 Money left on the table
Money left on the table is explained as the amount of money that is being “left”, the differ-ence between the offer price of the stock and the closing price the first day, multiplied by the amount of stocks that were sold, assuming the stock is being underpriced (Ritter, 1998). Every year enormous sums of money are “left on the table”, money the company could have earned during is first day of trade but due to the underpricing, it is money the compa-ny never sees (Dimbrowski & Brooks, 2003).
To calculate money left on the table we use the formula from Aggarwall et al. (2001), where (Q)- Quantity, (Po)- Offer price, (P1) – Closing price, ( P1-Po) - The velocity of the first day of trade (under price);
Money left on the table = Q * (P1 – Po)
There are mainly two objectives why leaving money on the table, first of all it makes the flotation easier, to a lower price there will be a higher attraction for the buyers and there-fore it will be easier to sell. Secondly, the underwriter makes up for the lost commission by selling to a lower price and therefore the underwriter favors the issuing firm in other finan-cial ways. Though there is almost never discussed negatively about the money left on the table by the issuing firm towards the underwriter (Dimbrowski & Brooks, 2003).
2.4 Best effort vs. firm commitment
Once the issuing firm decides upon which investment bank to operate with they need to agree on each actor’s contribution as well as how the risks are shared between the involved parties. The issuing firm needs to choose between two contracts; Best Effort and Firm Commitment. Using a Best Effort arrangement, the investment bank will only act as an in-termediate and does not bear the full risk of not selling the newly issued stock. With a Firm Commitment arrangement, on the other hand, the investment bank will purchase all the is-sued shares and then be responsible to resell it to investors. It is also argued that when a Firm Commitment contract is being used and both the issuing firm and investment bank has equal symmetric information, there would be no underpricing. This, since the invest-ment bank has the incentive to maximize its earnings and would therefore sell the issue at the highest possible price. However, when using a Best Effort arrangement the investment bank will only act in its own self interest. Therefore, it is likely that the investment bank will not work hard enough and therefore the issue will be underpriced (Baron, 1982).
2.5 Explanations for underperformance
Long run underperformance is the second abnormality. During a test that Ritter performed in 1991, he showed that IPO’s after 3 years underperforms significantly, compared to companies in the same size and industry. The firms underperforming more are most often relatively young companies that made the flotation during high-volume years. Buying the share after a few hours of trade, will diminish the absence of underpricing. If an investor
ultimately would hold this share for three years, the investor would get 83% of each dollar (Ritter, 1991).
There are evidence of underperformance. The return of the IPO are correlated in calendar time if the firm goes public in different years. Furthermore, the investor’s sentiment can be a possible explanation of underperformance, how he feels about a certain stock etc. Indi-viduals are more likely to be influenced by norms or lack of complete information (Brav & Gompers, 1997).
2.5.1 “Hot issue” market phenomena
There are evidence showing that companies within the same industry has a cyclical ten-dency to go public, which is followed by significant underpricing and long run underper-formance (Lowry, 2003). Also, evidence shows that the investment in, and the volume of, IPO’s is larger when the market peaks rather when the market is cold (Ritter, 1991).
One of the more accepted theories surrounding the low long-run performance was devel-oped by Miller (1977) and Morris (1996). They believed that the ones that were the most optimistic about an IPO would be the buyers and, hence, the ones that would determine the market price. When more information about the issuing firm becomes available, the difference of opinions will narrow, and the initial buyer will not be as optimistic anymore. They will then sell their shares. Consequently, if the firm will issue more stock the initial buyers will not be as optimistic as in the hot market and, thus, the stock price will decrease.
2.5.2 Windows of opportunity
The ”Windows of opportunity” theory believe that IPOs become more overvalued during ”hot” markets than during ”cold”, and issuing firms should therefore try to take advantage of the opportunity, since it is limited by time. Investors are more optimistic during market peaks and hence overvalue the issues.
As with the “Hot Issue” market phenomena, issuing firms wants to take advantage of the investors over-optimism. The issuing firm’s captures a “Window of opportunity” by float-ing their share when the market is hot and therefore receive more per share. Both the “Hot Issue” and the “Window of opportunity” theory also states that those issues that were in-troduced during market peaks are those that will perform worst in the long run (Ritter, 1998).
2.6 Ownership structure
By going public, the issuing firm agrees to change its company ownership structure and, thus, the initial control of the firm. The ownership and the control of the firm will both matter in the firms, everyday, operational- and investment related decisions. Usually, when there is a separation between the ownership and the control, there will be an issue of agen-cy costs. Agenagen-cy costs are referred to the implications that arise when the managing, pre-issue, share holders have different objectives than the post-issue holders (Jenkinson & Ljungqvist, 2001).
It can be argued that the more shares a manager sell to outside investors, the less he will care about the performance of the company and, thus, the larger the agency cost problem will be. The more shares kept within the company the better is the long-run performance. Conversely, firms that sold out a larger fraction of their firm would perform worse. This, simply because managers that owned more shares had an incentive to maximize the firm value, rather than their private benefits, than those that owned less (Jenkinson & Ljungqv-ist, 2001).
2.7 Jenkinson’s trading rule
Putting it all together with the underpricing and underperformance, the trading rule may seem simple: investors should sell the shares almost immediately they start trading, known as flipping. By doing so, investor’s fortunate enough to be allocated shares at the IPO, would benefit from the initial underpricing and would not suffer the long-term underper-formance because they would sell off the shares after the first day. However, if people would follow this rule, the phenomenon of long-run underperformance would tend to dis-appear (Jenkinson and Ljungqvist, 2001).
2.8 Previous studies
Research within IPO’s can be dated back as long as to the beginning of the 1960’s. One crucial aspect, which needs to be considered, is that most, but not all, of the existing litera-ture have been written and conducted by American authors. This fact might bias some of the aspects when investigating the Swedish market.
The two abnormalities are heavily explored and investigated from several angles. The ma-jority of evidence regarding the under-pricing phenomena is quantitative. However, the
qualitative data mostly tries to develop theories and come up with reasons of the phenom-ena.
When it comes to underperformance, the collected data follow the same structure as the underpricing phenomena. One can, as in the underpricing aspect, conclude that the data that can be used as evidence comes from quantitative methods. There are several theories that strive to explain why, but to differentiate between them, and determine those that are more accurate, are difficult.
2.8.1 Empirical evidence of IPO underpricing
The international evidence that IPO’s are underpriced is significant. This can be seen from Appendix 9.2 which summarizes the initial average returns from 38 countries. One interest-ing aspect is that the IPO’s in developinterest-ing countries come with a higher initial return. As can be seen from the table; during 1990-2000 had the IPO’s in China a initial average re-turn of 256,90%. In Malaysia, during 1980-1990, the average initial rere-turn was 104.10%. Meanwhile, countries such as Germany and France had an average initial return of 27.70% and 11,60%, respectively.
2.8.2 Empirical evidence of IPO long-run underperformance
Underneath, one can see some collected data from various economies.
Figure 5. Empirical evidence for under-performance
Most of the researchers have found that IPO’s will underperform their industry peers with the same market capitalization during the first three-year interval. They also argue that one of the underlying factors of underperformance comes from the initial offering price and during what kind of macro-conditions the IPO is launched. When there is a large fraction of IPOs, investors tend to overvalue the issues, and the long-run performance will be af-fected negatively. There are also some evidence that the larger the gap between the offer price and first-day closing price, the worse the IPO will perform.
3
Method
This section will, in depth, state how we will go about to answer our purpose and chosen research questions. It will be explained how the data was collected, how the data will be analyzed as well as the reliability and validity of our data.
The study started off by doing qualitative studies, find theory, read prospectus, and having an interview. This was followed by performing quantitative studies to find stock prices at different time sets. The different datahas been both primary- and secondary, such as inter-view, stock prices and prospectus. To develop validity of our results, especially when com-paring the long run performance, Ritter talks about comcom-paring to its peers, we decided to find out the different industries and then compare the stocks to each other within the same industry.
Further on, calculations were made to see whether companies in our sample followed the abnormalities or not. The first formula of underpricing is relatively simple and we per-formed the calculations in Microsoft Excel which made it easier. Once having the amount of underpricing of each stock, we could calculate the money left on the table, by multiply it with the amount of stocks sold, which we found from the prospectus. Unfortunately, there were some numbers missing in the calculations due to that there were errors when search-ing for stock prices at a specific date as well as prospectus. The lack of data also affected our ability of calculating the underperformance, i.e. since some stocks in our sample were introduced lately and therefore lacked data from five years of trade.
During our studies we have found many influencing parts that affect the behavior of a stock when its being introduced and how it perform in long run. We have selected the theories we believe could be the most relevant to answer purpose and our research ques-tions.
Through the paper there are also theories presenting how an IPO is performed as well as some theories describing how the stock perform in long run as well as some underlying factors.
3.1 Qualitative interview with M. Rylander
Handelsbanken is covering the whole IPO process by them self, starting from the valuation of the firm and writing the prospectus to the marketing actions and the actual IPO. During
2008, there was only one IPO, DGC One AB with Handelsbanken as underwriter, taking place on the Swedish stock market.
Therefore, an interview with Marcus Rylander, working at Equity Capital Market, Handels-banken, will supply us with unbiased qualitative information about the process and the rela-tion between the issuing firm and the underwriter, but also his general point of view of un-derpricing and under performance. His knowledge and experiences from the IPO process will be asked upon and later compared to theory. The themes of the questions will mostly cover the pricing methods and the relationship between the investment bank and the is-suing firm, if there is any way the isis-suing firm can affect the pricing or the performance af-ter the IPO. Furthermore, if there are any actions taking place trying to avoid underpricing and long run underperformance.
According to Hollway and Jefferson (2000) an interview should be based on themes as top-ic-guidelines instead of fixed questions that are designed as a questionnaire. This way of performing an interview generates a good flow and will generate an informative result (Hollway & Jefferson, 2000). Equally important is the degree the interviewer gets involved and follows up questions how he interpret, verify and reports after the interview is also im-portant criteria for the quality (Kvale & Brinkmann).
3.2 Data analysis
3.2.1 Interview analysis
The purpose of the interview is to get additional qualitative information from an expert within the field on the Swedish market, in order to compare the theory to reality. We re-gard Marcus Rylander to be an expert since he has 12 years of experience at Handelsban-ken both in terms of performing and leading IPO’s as well as M&A’s, and therefore the in-formation from the interview is regarded as valid and truthfully. Since the process of per-forming IPO’s is highly regulated in many ways and also a very complex and time consum-ing process, we believe the process beconsum-ing similar to most of the investment banks and un-derwriters, also because they often cooperates, there must be similarities in the processes. Because of this, we believe that only interviewing one expert is sufficient.
When it comes to analyzing the answers, Marcus’ experience and general comments are be-lieved to be a general assumption within the industry, however we are aware that his thoughts might be different from others. On the other hand, we do not see this as a
weak-ness for the conclusions. Furthermore, our findings from underpricing and underperfor-mance will be complemented with the qualitative data from the interview.
3.2.2 Index
We will investigate the stocks performance in different time periods, 1 day, 1 year, and 5 years compared to index. First, the general index will be set into comparison to the differ-ent industry indexes, and later, the industry indexes will be compared to the sample. The indexes and different industries are taken from Affärsvärlden.
OMX Affärsvarlden’s general index, AFGX, is one of Sweden´s oldest indexes and it started 1937, the index is wide and measures the average stock market in Sweden. It is a simple and clear measurement to see how the whole market changed on average.
The comparison of a stock to a general index can be deceptive, though it can be interesting to see how it perform compared to the AFGX in general to look for trends or extreme cas-es . It can also be unfair since there can be a big difference how different industricas-es per-form in different time periods. There are 9 industry indexes and the base measurement was set to 100 and it started 1995. The industries are Materials, Industrials, Consumer staples, Consumer discretionary, Health care, Financials, Information technology, Telecommunica-tion services and Energy.
3.2.3 Formula for underpricing
Underpricing = Closing price day 1 – offer price Offer price
To find out the amount of underpricing, the closing price of the first day of trade was sub-tracted from the offer price. This sum should be divided with the offer price to get the cor-rect answer shown in percent.
3.2.4 Formulas for under performance
Long run performance = closing price after x – closing price day 1 Closing price day 1
The closing price after X days subtracted by the closing price the first day, this sum divided by the closing price first day. The shown result is the performance of the stock in percent.
Long run performance adjusted to index =
100 * (1+(long run performance/ (1+(index after x – index day 1) -100 index day 1
This formula gives a measure of the difference between the stock performance and the in-dex performance.
3.3 Reliability and validity
Research on this area is performed on variety of markets and different time periods and there are many ways of performing it. However, one weakness with this thesis is the time period. The year 1999 to 2000 was an exceptional period for IPO’s due to the IT bubble, where there were a lot of IPO’s and most of the companies operated in the IT industry. However, many of these companies are today either merged with another or acquired, some might also have declared bankruptcy, one huge implication for this is the burst of the IT bubble year 2001. The post period (2-3 years) of the IT bubble did, on the other hand, not provide good conditions for going public, only a handful of IPO’s were performed during this time.
The research on long run underperformance is limited to stock performance; this might of course also constitute a problem with this thesis. Here, there are many factors playing an important role. In order to get a fair conclusion, factors such as ownership structure and key ratios are also relevant; therefore only looking at stock performance is counted as a li-mitation of this research.
4
Empirical findings
This section will introduce the reader with the data collected from our interview as well as from other sources. Accordingly, data that investigates the two phenomena’s will be summarized and explained.
4.1 Sample
The total population from which we selected our sample is the total amount of companies that were introduced on the Swedish stock market, OMX, in 1998-2007. Later, in order to get as valid and truthfully data as possible we chose to investigate companies that are still listed since we want to be able to compare historical data as well as the development. Dur-ing the 10 years of focus, the study will be performed on 58 companies (Appendix 9.2 )
4.2 Distribution of sample
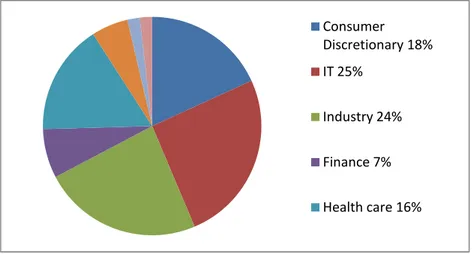
Our sample constitutes of all the companies that performed an IPO during 1998-2007 in Sweden, and that are still listed today. It turned out to be a total amount of 224 companies and the ones that are still listed are only 58 companies, which constitutes 24,6% out of the total. For example, during the first four years there were a lot of IPO’s, but there were also a lot of delisting. The two following years, 02-03, there were less IPO’s and the majority of the companies from 2002 are listed and all of the 6 companies from 2003 are also de-listed. Then something happens, in 2004 there is a turn because half of the companies are still left on the stock exchange, and 2005-2007 all of the companies are still listed. Below there is a pie chart of the industry-distribution of our sample. It is clear that the IT industry and the Industrials-industry are the two major industries within IPO’s.
Figure 6. Industry distribution of sample
Consumer Discretionary 18% IT 25% Industry 24% Finance 7% Health care 16%
Having seen the sample-distribution in total, another interesting aspect is the distribution for the shares that were underpriced themselves. Appendix 9.3 includes only the part of the sample with companies that had a offer price lower than the closing price the first day of trade. As seen, the adjusted sample looks almost the same as the whole sample, there are some difference within the finance industry where there were a few less underpriced. Again the IT- and industry-industry are the major players, but also the healthcare industry is tak-ing a bigger part compares to the whole sample.
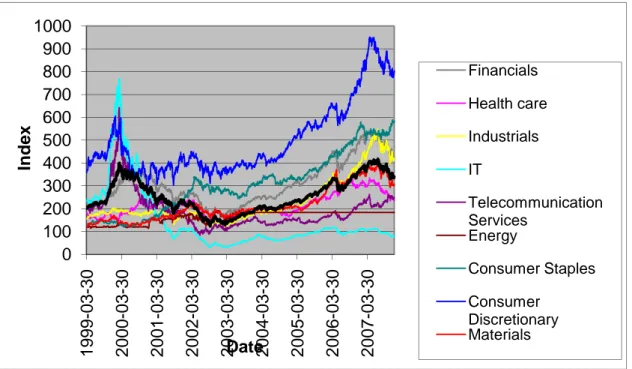
4.3 Index
The table below comes from Affärsvärlden.se and shows the development of general index and different industry indexes, and their development at the Swedish exchange during 1999-2008.
Figure 7. Industry indexes in comparison to general index
Some sectors have performed above the OMX General Index. One of the better perform-ing sectors is the consumer staples. The IT sector had a peak durperform-ing 2000 but has de-creased and is now the worst performing sector. All sectors, with some minor exceptions, follow the slope of the OMX General Index.
0 100 200 300 400 500 600 700 800 900 1000 1 9 9 9 -0 3 -3 0 2 0 0 0 -0 3 -3 0 2 0 0 1 -0 3 -3 0 2 0 0 2 -0 3 -3 0 2 0 0 3 -0 3 -3 0 2 0 0 4 -0 3 -3 0 2 0 0 5 -0 3 -3 0 2 0 0 6 -0 3 -3 0 2 0 0 7 -0 3 -3 0 In d e x Date Financials Health care Industrials IT Telecommunication Services Energy Consumer Staples Consumer Discretionary Materials
One can see that between the years 1999-2000 there was a steady increase of the general index. The following years experienced both increases and decreases, however between 2000-2004 there was a clear decrease followed by a few years of increase. From 2007, to present day, there has been a significant decrease due to large uncertainties.
4.4 Underpricing
4.4.1 Underpricing per industry
Out of the 58 companies we have investigated there were 28 companies who had set a low-er offlow-er price than the closing price first day of trade, and wlow-ere thlow-erefore undlow-erpriced. Fur-ther, there are also differences in underpricing between industries. During year 1998-2007, the total underpricing was 23%, compared to the finance industry alone, that was only 2% underpriced. Equally distinct is the IT industry that was underpriced 59%.
Average underpricing per industry (%) Consumer discretionary 19 IT 59 Industry 10 Finance 2 Telecommunication 4 Consumer staples 10 Health care 9
When looking at the different industries, Eniro underpriced the most within the consumer discretionary; almost 70%, while Rezidor Hotel group did only underprice 1%. At the IT section Cybercom underpriced with almost 200%, and Axis only with 1%. Within the In-dustrials industry section the companies did not under price that much, Proffice under-priced by 32% and underunder-priced the most, the rest of the companies were in between 3-13%. In the finance section only Eastern Capital explorer underpriced and only by 2%. Within health care, Sectra had a under price of 20% which was the highest in that industry. Within the Telecom and Consumer staples, only one company in each industry, Telia and Oriflame were underpriced. Telia were under priced by 4% and Oriflame by 10%.
Mekonomen AB 2000-05-29 Consumer d 3% Rezidor Hotel group AB 2006-11-28 Consumer d 1% Clas Ohlsson AB 1999-10-05 Consumer d 21%
Novotek AB 1999-06-30 IT 21%
ORC Software AB 2000-10-19 IT 21%
ReadSoft AB 1999-06-22 IT 24%
Micronic Laser Systems
AB 2000-03-09 IT 96%
Axis AB 2000-06-27 IT 1%
Cybercom Group
Eu-ropé AB 1999-12-01 IT 193%
BE-group AB 2006-11-24 Industrials 5%
Lindab International AB 2006-12-01 Industrials 3%
Poolia AB 1999-06-23 Industrials 13%
Intrum Justitia AB 2002-06-07 Industrials 6% Nederman Holding AB 2007-05-16 Industrials 9%
Indutrade AB 2005-10-05 Industrials 12%
Proffice AB 1999-10-11 Industrials 32%
East Capital Explorer AB 2007-11-09 Finance 2%
Q-med AB 1999-12-06 Health care 2%
Orexo AB 2005-11-09 Health care 1%
Biovitrum AB 2006-09-15 Health care 12%
Sectra AB 1999-03-03 Health care 20%
Telia AB 2000-06-13 Telecom 4%
Oriflame Cosmetics SA 2004-03-24 Consumer s 10%
Figure 8. Underpricing per industry
4.4.2 Underpricing per year
Below is an illustration of the average percentage of underpricing per year. A comparison in percentage can be found in appendix 9.4.
1998 1999 2000 2001 2002 2003 2004 2005 2006 2007
55 41 32 4 10 - 10 5 5 8
When it comes to the different years, one can tell that there where only Prevas who was underpriced in 1998 compared to 7 companies introduced. In 1999, 8 stocks were under-priced, and 14 were introduced on the stock market. In 2000, 6 companies underpriced and 7 companies were introduced. During 2001, 4 companies were introduced and one of them where underpriced. 3 companies were introduced in 2002 and one of them where under-priced. 2003 was a bad year for the stock market and none of the companies introduced are still on the stock exchange today. In 2004 one out of four firms were underpriced and dur-ing 2005 four companies were introduced and three of them were underpriced the first day of trade. In 2006, 4 out of 8 companies were underpriced and in 2007, 3 out of 6 under-priced. In appendix 9.7 one can see the amount of stocks introduced and how many of those that where underpriced. Below one can see those companies that were underpriced per year. Prevas AB 1998-05-29 IT 55% Sectra AB 1999-03-03 Healthcare 20% Novotek AB 1999-06-30 IT 21% ReadSoft AB 1999-06-22 IT 24% Poolia AB 1999-06-23 industrials 13%
Clas Ohlsson AB 1999-10-05 Consumer d 21%
Proffice AB 1999-10-11 industrials 32%
Cybercom Group
Eu-ropé AB 1999-12-01 IT 193%
Q-med AB 1999-12-06 Healthcare 2%
Micronic Laser Systems
AB 2000-03-09 IT 96% Mekonomen AB 2000-05-29 Consumer d 3% Telia AB 2000-06-13 Telecom 4% Axis AB 2000-06-27 IT 1% ORC Software AB 2000-10-19 IT 21% Eniro AB 2000-10-10 Consumer d 70% BTS Group AB 2001-06-06 Industrials 4%
Intrum Justitia AB 2002-06-07 Industrials 6% Oriflame Cosmetics SA 2004-03-24 Consumer s 10%
Indutrade AB 2005-10-05 Industrials 12%
Biovitrum AB 2006-09-15 Healthcare 12%
BE-group AB 2006-11-24 Industrials 5%
Rezidor Hotel group AB 2006-11-28 Consumer d 1% Lindab International AB 2006-12-01 Industrials 3% Nederman Holding AB 2007-05-16 Industrials 9%
Aerocrine AB 2007-06-15 Healthcare 12%
East Capital Explorer AB 2007-11-09 finance 2% Figure 10. Underpricing per year
4.5 Money left on the table
In our sample we have calculated 23 companies that left money on the table. Micronic La-ser systems AB left the highest amount in our sample, their stock were underpriced with almost 100%, it was offered at 105 and closed at 205 the first day of trade. Micronic left almost 2,5 billion SEK. Telia’s stock also underpriced but only with a few percent (4%) but due to the huge amount of stocks sold out the money on the table was close to 560 million SEK. There except from telia 6 other companies that left over 100 million SEK, ORC software left 149 MSEK, Cybercom almost 325 MSEK, Lindab 108 MSEK, Intrum Justitia left 122 MSEK, Indutrade almost 200 MSEK and Proffice 410MSEK. The rest of the companies are in an interval of 4 MSEK (Orexo) - 88 MSEK (BioVitrum). As can be seen in appendix 9.5 there is a list of the offer price and the price interval , the amount of stock the company gave out in comparison to the money left on the table.
4.6 Performance in general
Performance can be measured in many ways. An indicator of how the stock market per-forms is the general index which shows the average performance of the whole stock mar-ket, there are also industry indexes showing a weighted average of the different industries. These give a more unbiased and trustworthy index for a specific group.
The IPO’s that are included in our sample are those that still exist, and operate under the same name today. We have excluded those that have been de-listed as well as those that have merged with other companies. The companies within our samples were listed during 1998 till 2008. The fact that many of those companies, issued in the late 90s, does not op-erate today, indicates how hard it is for IPOs to survive.