N0. 65 ' 1981
65
Statens väg och trafikinstitut (VTI) - 581 01 linköping
National Road & Traffic Research Institute - S-581 01 Linköping - Sweden
The Generation of Infrasound in Buses
by Ulf Sandberg
Reprint from the 1981 International Conference on Noise Control.
Engineering (INTER-NOISE 81) in Amsterdam, the Netherlands, 6 8 October 1981.
No. 65 ' 1981
65
Statens väg- och trafikinstitut (Vl'l) - 581 01 linköping
National Road & Traffic Research Institute - S 581 01 Linköping - Sweden
The Generation of Infrasound in Buses
by Ulf Sandberg
Reprint from the 1981 International Conference on Noise Control.
Engineering (INTER NOISE 81) in Amsterdam, the Netherlands, 6 8 October 1981. Proceedings, Volume 2, pages 727-732.
**
practice of noise control engineering
inter-mire
&!
THE GENERATION OF INFRASOUND IN BUSES
Ulf Sandberg
National Swedish Road and Traffic Research Institute
S 581 01 LINKÖPING Sweden
INTRODUCTION
Infrasound* emitted in road vehicles has been recognized as a po tential environmental problem for drivers and passengers. In the lack of sufficient evidences of its health, performance or comfort impact, there are different opinions whether existing infrasound levels in the
vehicles are acceptable or not. In Sweden, however, there is neverthe
less already a limit for allowed infrasound exposure during working time, being 110 dB SPL (2 20 Hz) for 8 h daily exposure. It may be exceeded for max. 1 h/day.
Leaving the question of whether the 110 dB limit is relevant or not,
it must be concluded that the existing limit must be observed also in buses. The Swedish Road and Traffic Research Institute is currently
in-vestigating different aspects of the bus drivers' working environment
including, for example, the audible sound as well as the infrasound. INFRASOUND PRESSURE LEVELS INSIDE BUSES IN TRAFFIC
While audible noise has been reduced significantly in buses through
the last two decades, infrasound appears to have been unaffected or even aggravated. Infrasound fluctuations in the latest buses are now
audible", as the normal audible sound has been reduced such that it
can no longer mask the infrasound effectivel .
Using a special "infrasound dose meter" the equivalent "infra
soundweighted" levels, Leq have been measured for a number of buses in real traffic. The measurements were made at the driver's place and
cover exposure times of 0.5 8 h. See fig 1. To correct the dB(I) levels in fig 1 to dB(IL), which is the SPL between 2 and 20 Hz, 1 dB should
be added. Two of the measurements exceed 110 dB(IL) and some of those
with Le between 105 and 109 dB(I) will exceed 110 dB(IL) for more than
1 h. So, it can be concluded that several combinations of buses, roads and types of driving do not comply with the official standard.
By infrasound is meant the "sound" in the range 2-20 Hz. However, also the audible low frequency range is covered to some extent in this paper. The SPL 2-20 Hz is given the unit dB(IL).
Ulf Sandberg NO. OF HEHSUREHENTS
f ' ' ' ' ' ' ' ' ' ' ' ' Fig 1. Equivalent infrasound
* * levels" at the driver's place
10- in buses in real traffic. Ex
S- posure times 0,5 8 h. Each
a- - measurement concerns a dif
7. _ ferent bus and/or driver.
s_ _ Add 1 dB to obtain the values
5_ _ in dB(IL). q.. . 3 _ 2- _ 1 1
0..m ...
, | | 1 1 1 90 92 94 96 981001021041061 08110112114116118 DB(1) LEGHYPOTHETICAL SOURCES OF INFRASOUND IN ROAD VEHICLES
Originally, the following were considered as potential sources of infrasound:
o Vibrations in the engine or the transmission
Vibrations caused by road roughness
Vibrations in the body caused by turbulent air flow around thelnn; Air turbulences in open windows amplified by a Helmholtz resonator
Vibrations caused by tire run out or unbalance (non uniformity)
0
0
0
0
As the main test object a modern city-bus was chosen. By systematic
measurements of infrasound levels and spectra in 13 buses it was con
cluded that all buses exhibited essentially the same frequency spectra
although the levels differed up to 10 dB between the buses (see ref 1).
Therefore it is reasonable to believe that the generation mechanisms are basically the same.
TEST OF ENGINE AND/OR TRANSMISSION INFLUENCE
The engine rotation frequency is around 9 12 Hz at idling,lnn:norm ally 25 35 Hz at driving. Firing frequency components are higher mul tiples of this. Other engine components are not very likely to influ ence the infrasound region when driving.
The bus was driven in two ways:
1. Rolling downhill on a road with the gear box disengaged. Engine firing frequency (idling) = 25 Hz. Downwind 2.4 m/s.
2. Driving uphill on the same road (= the engine heavily loaded). Engine rotation frequency = 29 Hz (90 km/h, 4th gear) or 32 Hz
(70 km/h, 3rd gear), firing freq. 3 times higher. Upwind 2.41n/s.
Speeds were 70 and 90 km/h. Measuring time was 32 s. The only sys
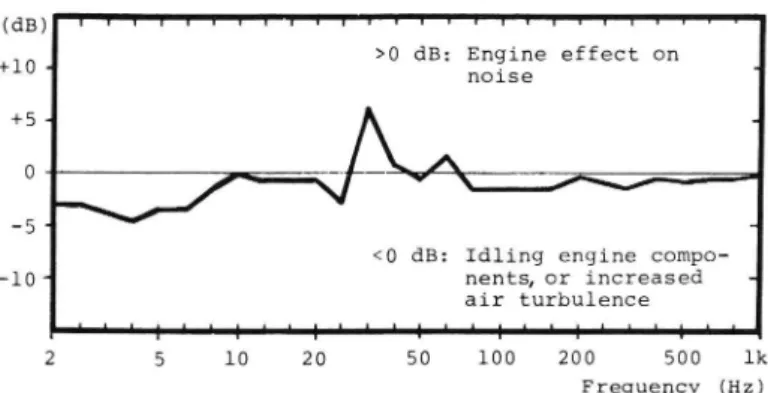
tematic differences between the measurements were the engine loading and frequencies as well as the slightly different winds. Fig 2 shows
the spectral differences between the tests (averaged for 70 and 90anh).
Generation of infrasound in buses
Fig 2. Difference between
(dB) | I 1 r r l I | I 1 | lllll r 1 | I l 1 1 v r
+lO . >0 dB: Engine effect on 1/3 O(Et' Sp?Ctra when bus
mnse ' lS driven With heav1ly
+5. _ loaded engine and rolling
with engine idling. (There
0 _~\\ _//7 -\J' " \____¢/ -f = -_IN is also a slight Wind. . .
_5+ _ speed difference: 2.4/+2.4
<0 dB: Idling engine compo- m/s) . Average of 70 and
~lO< nents or increased - 9() k. /h.
air turbulence m measurements.
2 5 10 20 50 100 200 500 lk
Frequency (Hz)
The levels are somewhat lower for the engine loaded case between 2 and 6 Hz and from 80 Hz upwards,whichn ght be explained by influence
of different wind speed (4.8 m/s) as will be shown later. The level at 25 Hz is lower in the second test which can be explained by a pronoun ced peak at the firing frequency (first test). The only significant increases for the loaded engine case are in the 31.5 and 63 Hz bands.
Conclusion: For this bus, the only significant influences of the loaded engine and transmission are at the engine rotation frequency and its first harmonic when speeds are 70 90 km/h. They fall outside the infrasound region. There are also effects tentatively indicating an air
turbulence effect at 2 6 Hz and above 80 Hz. TEST OF AIR TURBULENCE EFFECT
For this test was chosen a long straight road with low roughness, situated on an open field. On a day when the wind speed was stable at 5 7 m/s in the road direction,1ju3bus was driven in both directions. The only difference between the two test conditions was thus the air speed relative to the bus, and perhaps the engine loading.
In fig 3 is shown the spectral differences between the sound for the two test conditions (upwind downwind). The air speeds rel. to bus were 20/7 m/s at 50 km/h, 25/13 m/s at 70 km/h and 32/18 m/s at 90 km/h.
It can be seen that the level is higher upwind than downwind in the range below 6 Hz and above 50 Hz. As no significant engine compo nents were noticed or measured in these ranges, it must be attributed
to the air turbulence effect. The small effects 12 25 Hz can partly be blamed on a pronounced engine component at 50 km/h, partly a possible
air turbulence effect at 90 km/h.
Conclusion: Air turbulence caused vibrations in the body are im
portant below 6 Hz and above 50 Hz at air speeds rel. to the bus of > 20 m/s (probably also at lower speeds) and non neglectable also in
the intermediate range at an air speed of 32 m/s. Below 6 Hz the air turbulence effect is clearly dominating.
Ulf Sandberg
(dB) ll ' Ir f II ' || | ur r ll II | [1 r || Fig 3. Difference
>0 dB: Air turbulence between 1/3 oct.
+loJ effect increases _ .
mnse spectra when bus 15
+54 _ driven upwind and
,,/ ~___ -~a - downwind. Average
0 v' of 50, 70 and 90 km/h measurements. Analysis time 64 or 128 s. 111.111111411141114111L1LL I 2 5 10 20 50 100 200 500 lk Frequency (Hz)
TEST OF TIRE NON UNIFORMITY EFFECT
. . * .
The t1res might have some unbalance or run out Wthh causes axle
vibrations with the secondary effect of infrasound generation in the cab. The frequencies generated should equal the tire rotation frequen cy or its harmonics. Fig 4 shows both the vibrations on the axle at
the left front wheel and the sound recording in the bus. The peak at
14.8 Hz in the infrasound is originating from one of the rear wheels which had a run out of 5.4 mm unloaded. The theoretical tire rota-tion frequency would be 7.8 Hz, with its first harmonic at 15.6 Hz.
c _ AXLE VIBRATIONS .
.3 ärmwvmde'at Fig 4. Comparison of
u * left wheel) .
&. sound and axle Vibra
a) I
3 tion narrowband spectra
§~ (horiz. scale: 5 Hz/div.,
vert. scale: Linear).
I I j l ' T I I l
0 10 20 HZ 30 40 50 Note: Sound spectrum
peak at 14.8 Hz 15
NO. OF AVERAGES: 100 RESOLUTION: 0.2 HZ .
& caused by t1re run out
?. smmo via the rear axle.
$ (at driver s place)
' +
H Q4 © -C. :! O _ U) _L I l T T I F l ' l o 10 20 H2 30 40 50The first cabin air resonance mode is at 14.2 Hz*i which undoubted ly can amplify the tire run out frequency.
Conclusions: Tire run out (and probably also unbalance) causes pro nounced infrasound generation at the tire rotation frequencies and its
The latter is describing that the tire is not completely round.
**
Generation of infrasound in buses
harmonics, especially when these are coinciding with axle resonances
(see later) or cabin air resonance modes.
TEST OF THE ROAD ROUGHNESS EFFECT
When tire roughness has a clear effect on infrasound, it is natural
that also road roughness has a corresponding effect. This is very easy
to detect when studying the sound level meter response in a bus in traffic. When the tires cross a pot hole or a rail, a peak is always noticed in the meter response (dB(Lin)).
Actually, it is probable that all the sound not explained by engine, air turbulence or tire non uniformity in the foregoing, i e the range 8 50 Hz (fig 3), is originating from road roughness. See also the axle vibration spectra of fig 4. There is a prominent peak at 10 12 Hz which can be attributed to the axle resonance, mainly determined by the tire spring constant in combination with the unsprung mass. A corresponding peak is seen in the infrasound spectra.
Fig 5 shows the coherence between axle vibration and infrasound. As the measured leftside front axle vibration is expected to be only 25 502 of the total vibration input (one out of four inputs) a coherence
of max. 0.25 0.5 could be expected* . On the smooth road, coherence is maximum (30.6) at about 8 13 Hz which is the range where axle vibration
is maximum. On a rough road, coherence is "high" in a wider range, which is natural as the roughness excitation then is higher and may mask
other sources.
COHERENCE RESOLUTION: 0-5 Hz Fig 6. Coherence between
LOO 4ozwnmmzs the sound and left side
front axle vibrations.
Note: The coherence function value at each frequency, represents the fraction of the
sound power directly
related to the axle vibration. l l l l l l l l l
TESTS WHEN WINDOWS ARE OPEN
The air mass in an open window might resonate with the cab air volume (acting as a spring) to give a Helmholtz resonator. In a tested
bus the calculated resonances were:
Side window fO = 5 Hz ** Q = 126 **
Roof window f0 = 5 10 Hz Q = 131 16
Measured results indicated no signs of sharp resonances as expected
for st of 16-131 although the levels were increased 0 20 dB at 2-13 Hz.
A complication is the possible unlinear characteristics of the suspension system. Depends on the estimated air spring length.
/1/
Ulf Sandberg
RADIATION OF INFRASOUND FROM CABIN SURFACES
With the exception of turbulence caused by open windows, all infra sound must be radiated from cabin surfaces. The surfaces with the app-arently best potential to do this are the windows. It is easily seen and felt with the fingers that they vibrate considerably.
In a stationary bus with large plane windows the natural frequencies
were excited and the resulting sound spectra recorded. Highest levels
were found in the range 12 20 Hz. Calculation of the natural frequencies of the windows yielded about SOZ higher frequencies than measured.
Typically, the bus with lowest infrasound was one with all windows curved which of course reduced their sensitivity to vibrations.
Two buses essentially similar except for the body material were compared. One had a steel and the other an aluminium body. No consist ent differences traceable to different body vibrations were found.
CONCLUSIONS
All the sources listed on p. 2 were traceable. See summary in fig
6. Those with most influence on overall infrasound levels are axle vib rations caused by road or tire roughness. When windows are open, air tur bulences are also important. One can argue that the responsibility for improvements is common to the bus and tire manufacturers and the road authority. Two efficient ways to reduce infrasound levels are judged to be increased natural frequencies and damping of the windows and to check tires for uniformity. The results have impact on the measurement standards for buses. These should be designed to standardize,or limit, road roughness, tire uniformity and wind speed to enable reproduceabiliqh
r i
(1)
>m '--'road roughness effect - - - _
'_' - air turbulence effect Flg 6° Relative 1m
5 --- d:o,wimkmscnmn portance of n01se
m I | | tire non uniformity and infrasound
: EE: amine sources for the bus
l .
___...- _! : at different fre
FIT _ quencies. Vert. 11nes=
: :*sh tonal components. & I I __ | ! x T I | ! T I 2 5 10 20 50 100 200 500
The help with measurement facilities at Linköping University
Frequency (HZ)
ACKNOWLEDGEMENTS
The reported work was sponsored mainly by the Swedish Vocational Training and Working Environment Council of the Transport Trades (TYA).
(Inst. for Measurement Technology and Physics) is acknowledged as well as va
luable discussions with the bus manufacturers Volvo and Scania.
REFERENCE
U. Sandberg, S O Lundkvist, "Buller och infraljud i bussar Redovisning av kartläggande mätningar", Report from the Swedish Road and Traffic Research Institute, Linköping (in preparation).