Master of Engineering Thesis in Computer Science and Engineering
Supervisor: Patrik Arlos, BTH
Improving Quality of
Experience through
Performance Optimization
of Server-Client
Communication
Mattias Albinsson | Linus Andersson
iii
In software engineering it is important to consider how a potential user experiences the system during usage. No software user will have a satisfying experience if they perceive the system as slow, unresponsive, unstable or hiding information. Additionally, if the system restricts the users to only having a limited set of actions, their experience will further degrade. In order to evaluate the effect these issues have on a user‟s perceived experience, a measure called Quality of Experience is applied.
In this work the foremost objective was to improve how a user experienced a system suffering from the previously mentioned issues, when searching for large amounts of data. To achieve this objective the system was evaluated to identify the issues present and which issues were affecting the user perceived Quality of Experience the most. The evaluated system was a warehouse management system developed and maintained by Aptean AB‟s office in
Hässleholm, Sweden. The system consisted of multiple clients and a server, sending data over a network. Evaluation of the system was in form of a case study analyzing its performance, together with a survey performed by Aptean staff to gain knowledge of how the system was experienced when searching for large amounts of data. From the results, three issues
impacting Quality of Experience the most were identified: (1) interaction; limited set of actions during a search, (2) transparency; limited representation of search progress and received data, (3) execution time; search completion taking long time.
After the system was analyzed, hypothesized technological solutions were implemented to resolve the identified issues. The first solution divided the data into multiple partitions, the second decreased data size sent over the network by applying compression and the third was a combination of the two technologies. Following the implementations, a final set of
measurements together with the same survey was performed to compare the solutions based on their performance and improvement gained in perceived Quality of Experience.
The most significant improvement in perceived Quality of Experience was achieved by the data partitioning solution. While the combination of solutions offered a slight further improvement, it was primarily thanks to data partitioning, making that technology a more suitable solution for the identified issues compared to compression which only slightly improved perceived Quality of Experience. When the data was partitioned, updates were sent more frequently and allowed the user not only a larger set of actions during a search but also improved the information available in the client regarding search progress and received data. While data partitioning did not improve the execution time it offered the user a first set of data quickly, not forcing the user to idly wait, making the user experience the system as fast. The results indicated that to increase the user‟s perceived Quality of Experience for systems with server-client communication, data partitioning offered several opportunities for improvement. KEYWORDS: QoE, Performance Optimization, Data Partitioning, Network
v
I programvaruteknik är det viktigt att överväga hur en potentiell användare upplever ett
system vid användning. Ingen användare kommer att ha en tillfredsställande upplevelse om de uppfattar systemet som långsamt, icke responsivt, ostabilt eller döljande av information. Dessutom, om systemet binder användarna till ett begränsat antal möjliga handlingar, kommer deras upplevelse vidare försämras. För att utvärdera vilken påverkan dessa problem har på en användares upplevda kvalitet, används mätenheten Upplevd Tjänstekvalitet.
I detta arbete var det huvudsakliga syftet att förbättra en användares upplevelse av ett system som led av de tidigare nämnda problemen vid sökning av större datamängder. För att uppnå detta syfte utvärderades systemet för att identifiera befintliga problem samt vilka som mest påverkade användares Upplevda Tjänstekvalitet. Systemet som utvärderades var en mjukvara för lagerhantering som utvecklades och underhölls av Aptean AB‟s kontor i Hässleholm, Sverige. Systemet bestod av flera klienter och en server som skickade data över ett nätverk. Systemet utvärderades med en fallstudie där prestandan anayserades tillsammans med en enkät utförd i samarbete med Apteans personal för att få insikt i hur systemet upplevdes vid sökningar av stora datamängder. Resultaten visade på tre problem som hade störst inverkan på den Upplevda Tjänstekvaliteten: (1) interaktion; begränsade antal möjliga handlingar under en sökning, (2) transparens; begränsad tillgång till information om sökningens progress samt den hämtade datan, (3) körningstid; slutförande av en sökning tog lång tid.
Efter att systemet hade analyserats, implementerades hypotetiska teknologiska lösningar för att lösa de identifierade problemen. Den första lösningen delade in datan i ett flertal
partitioner, den andra minskade datans storlek som skickades över nätverket genom att tillämpa komprimering och den tredje var en kombination av de två teknologierna. Efter implementationen utfördes en sista uppsättning mätningar tillsammans med enkäten för att jämföra lösningarna baserat på deras prestanda och förbättringar av Upplevd Tjänstekvalitet. Den mest signifikanta förbättringen av Upplevd Tjänstekvalitet kom från datapartitionerings-lösningen. Trots att kombinationen av lösningar uppnådde en mindre vidare förbättring, var det primärt tack vare datapartitioneringen, vilket innebar att den teknologin var den mest passande lösningen till de identifierade problemen jämfört med komprimering, vilken visade på endast en liten förbättring av Upplevd Tjänstekvalitet. När data partitionerades kunde flera uppdateringar skickas och användaren tilläts ett större antal möjliga handlingar under en sökning, men också en förbättrad tillgång till information i klienten angående sökningens progress samt den hämtade datan. Trots att datapartitionering inte förbättrade körningstiden, kunde den erbjuda användaren en första mängd data snabbt utan att tvinga användaren att sysslolöst vänta, vilket gjorde att systemet upplevdes som snabbt. För att förbättra den
Upplevda Tjänstekvaliteten för system med server-klient kommunikation visade resultaten att datapartitionering är en lösning som erbjöd flera möjligheter för förbättring.
NYCKELORD: Upplevd Tjänstekvalitet, Prestandaoptimering, Datapartitionering, Nätverkskommunikation
vii
This thesis was a collaboration between Mattias Albinsson and Linus Andersson, both of which have studied Computer Science and Engineering at Blekinge Institute of Technology and are completing their Masters of Engineering in Technical Computer Science.
The workload was evenly shared across most steps of the thesis. Mattias and Linus both, in a methodical and structured way, performed the various steps while showing a lot of
enthusiasm. They both contributed with skills and knowledge paramount for the success of this thesis. Tasks evenly shared were as follows (but not limited to):
● Planning and resource management
● Research of theories and relevant technologies ● Analysis of the system‟s performance
● Analysis of the user‟s perceived experience when working with the system ● Architecting the proposed solutions for the system
● Implementation of the proposed solutions
● Analysis of the implemented proposed solutions performance
● Analysis of the user‟s perceived experience when working with the proposed solutions ● Thesis report writing (where most sections of the report were a collaborated effort) ● Presentations
For Mattias the individual contribution was that he wrote most of the motivation behind the selected research strategies used during the thesis.
Linus was responsible for the statistical calculation of the performance measurements. Additionally his individual contribution was that he constructed the majority of tables presented in this thesis.
ix
The importance of perceived user experience when using software is something we have worked with in multiple courses and find interesting from a development standpoint, but also
from a user perspective. No software user appreciates when the software is slow, unresponsive, unstable or hides information. Therefore, we decided to work with Aptean AB on a specific problem which lowered the user experience when working with their warehouse
management system. This allowed us to research solutions both from a user experience and performance perspective.
We like to thank Pär Wetterlöf, who is responsible for the product development department at Aptean AB, and gave us the opportunity to carry out this thesis work in collaboration with Aptean. We also like to extend thanks to the senior developers at Aptean, Anna-Sofia Jönsson and Anders Rongby, for all the support and trust given to us during this thesis work. All their help and collaboration was critical for the execution of this thesis. We also like to thank all
employees at Aptean for their warm and heartfelt reception.
A final special thanks is dealt to our thesis supervisor Patrik Arlos from the Department of Communication Systems at Blekinge Institute of Technology for all his enthusiasm and
supportive knowledge during our working process. Thank You!
xi BDCS Binary DataContractSerializer DCS DataContractSerializer
DCJS DataContractJsonSerializer DSMS Data Stream Management System GUI Graphical User Interface
IMISC-WMS IMI Supply Chain Warehouse Management System
ITU-T International Telecommunication Union Telecommunication Standardization Sector
JSON JavaScript Object Notation MIF MeDICi Integration Framework QoE Quality of Experience
QoS Quality of Service UDP User Datagram Protocol
VoD Video on Demand
WCF Windows Communication Foundation XML Extensible Markup Language
xiii 1 INTRODUCTION ... 1 1.1 Motivation ... 2 1.2 Background ... 2 1.3 Objectives ... 3 1.4 Delimitations ... 4 1.5 Thesis Questions ... 5 1.6 Outline ... 5 2 PROBLEM DISCUSSION ... 7
2.1 IMI Supply Chain Warehouse Management System ... 7
2.2 Opportunity ... 10
3 THEORETICAL FRAMEWORK ... 11
3.1 Quality of Experience ... 11
3.2 Performance Evaluation Metrics ... 13
3.2.1 System-oriented and User-oriented Measurements ... 13
3.2.2 Time as a Metric ... 14
3.2.3 Events, Intervals and Responses ... 14
3.2.4 Independence, Randomness and Workload... 15
3.2.5 Monitoring ... 15
3.3 Network Optimization ... 16
3.3.1 Serialization ... 16
3.3.2 Compression ... 16
3.3.2.1 LZ77 ... 18
3.4 Data Partitioning and Streaming ... 18
3.4.1 Video on Demand ... 19
4 METHOD ... 20
4.1 Empirical Research Strategies ... 20
4.1.1 Surveys ... 20
4.1.2 Case Studies ... 21
4.1.3 Experiments and Quasi-experiments ... 22
4.1.4 Action Research ... 22
4.2 Selected Research Strategies ... 23
xiv
4.3.1.1 Mean, Median, Max and Min ... 25
4.3.1.2 Range ... 26
4.3.1.3 Variance and Standard Deviation ... 26
4.3.1.4 Confidence Interval ... 27
4.3.2 Execution ... 27
4.3.2.1 Google Spreadsheet ... 28
4.3.3 Hardware and Underlying Platform ... 28
4.3.4 Defining Data Used for Measurements ... 29
4.4 QoE Analysis ... 30
4.4.1 Survey ... 31
5 RESULTS ... 33
5.1 Initial Case Study - Identification of Sub-Parts ... 33
5.2 QoE Analysis - IMISC-WMS ... 35
5.3 Proposed Solutions ... 37
5.3.1 Prototype 1 - Improved User Control and System Reliability ... 37
5.3.1.1 Implementation of Data Partitioning ... 38
5.3.1.2 Measurements - Optimal Partition Size ... 41
5.3.2 Prototype 2 - Performance Enhancement ... 44
5.3.2.1 Implementation of Serilization and Compression ... 44
5.3.2.1.1 XML ... 44
5.3.2.1.2 JSON ... 45
5.3.2.1.3 Binary ... 45
5.3.2.1.4 .NET Serializers ... 45
5.3.2.1.5 Choosing Compressor Implementation ... 45
5.3.2.2 Measurements - Serializer and Compressor Combinations ... 46
5.3.2.3 Measurements - XmlSerializer and Deflate Compressor ... 48
5.3.3 Prototype 3 - Improved User Control and Performance Enhancement ... 50
5.3.3.1 Measurements - Optimal (Compressed) Partition Size ... 51
5.4 QoE Analysis - Implemented Prototypes ... 53
5.4.1 Prototype 1 - QoE Analysis Results ... 53
5.4.2 Prototype 2 - QoE Analysis Results ... 54
xv
6.1 QoE Analysis - IMISC-WMS ... 56
6.2 Comparison of the Performance Measurements ... 58
6.3 Comparison of the QoE Analysis Results ... 59
6.3.1 System Transparency, Interactivity, Data Delivery, Stability and Reliability ... 60
6.3.2 Perceived Execution Time ... 62
6.3.2.1 Optimal Partition Size ... 64
6.4 Ethical, Social, Legal and Sustainable Aspects on Research and Development ... 65
6.4.1 Ethical, Social and Legal Aspects ... 65
6.4.2 Sustainable Aspects ... 66
7 CONCLUSIONS ... 68
8 RECOMMENDATIONS AND FUTURE WORK ... 71
9 REFERENCES ... 72 APPENDIX A:
QOE SELF-REPORT SURVEY TEMPLATE ... I APPENDIX B:
PROTOTYPE 1‟S AVERAGE TOTAL ELAPSED TIME FOR COMPLETION OF A
REQUEST WITH DIFFERENT PARTITION SIZES ... IV APPENDIX C:
PROTOTYPE 1‟S AVERAGE TOTAL ELAPSED TIME TO RECEIVE THE FIRST
PARTITION WITH DIFFERENT PARTITION SIZES ... VI APPENDIX D:
AVERAGE ELAPSED TIME FOR COMPLETION OF A REQUEST WITH DIFFERENT SERIALIZERS AND DEFLATE ... VIII APPENDIX E:
AVERAGE ELAPSED TIME AND PERCENTAGE SPENT IN EACH INDIVIDUAL SUB-PART AND IN EACH INDIVIDUAL STEP OF THE SUB-SUB-PART, COMMUNICATION TO CLIENT ... X APPENDIX F:
ACHIEVED COMPRESSION RATIOS FOR DIFFERENT SERIALIZERS COMBINED WITH DEFLATE ... XIV APPENDIX G:
PROTOTYPE 3‟S AVERAGE TOTAL ELAPSED TIME FOR COMPLETION OF A
REQUEST WITH DIFFERENT PARTITION SIZES ... XV APPENDIX H:
PROTOTYPE 3‟S AVERAGE TOTAL ELAPSED TIME TO RECEIVE THE FIRST
xvi
Figure 2.1: IMISC-WMS architecture...8 Figure 4.1: Basic format for a QoE self-reporting question ... 31 Figure 5.1: The IMISC-WMS‟s architecture divided into the five sub-parts ... 33 Figure 5.2: Producer thread 1 and consumer thread 2 interacting with a concurrent queue .... 39 Figure 5.3: Thread 1 and thread 2 interacting with the concurrent dictionary ... 39 Figure 5.4: Prototype 1 architecture including client and server threads ... 40
xvii
Table 4.1: Hardware and underlying platform information for PC in Hässleholm, Sweden ... 29
Table 4.2: Hardware and underlying platform information for server in United Kingdom ... 29
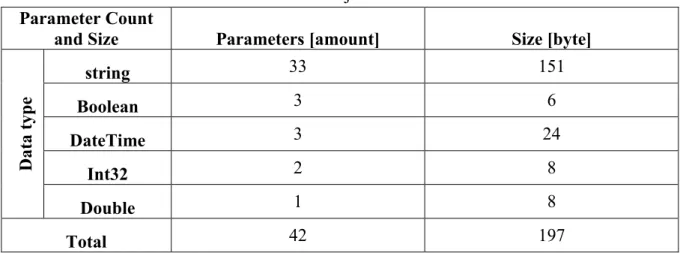
Table 4.3: Parameters identified in a Result-object ... 30
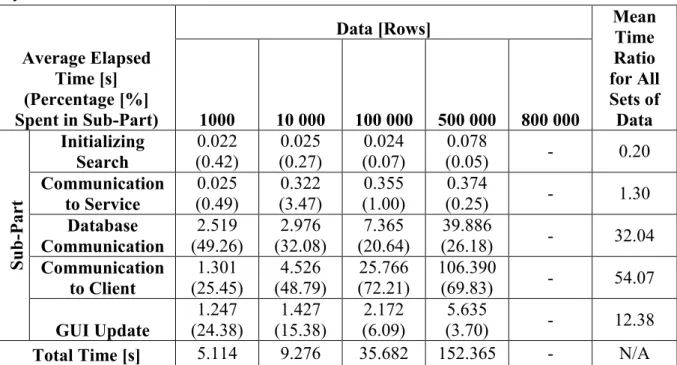
Table 5.1: Average elapsed time and percentage spent in each individual sub-part of the system‟s communication chain ... 34
Table 5.2: Average total elapsed time for completion of a request ... 35
Table 5.3: Results collected from the QoE survey for the original system ... 36
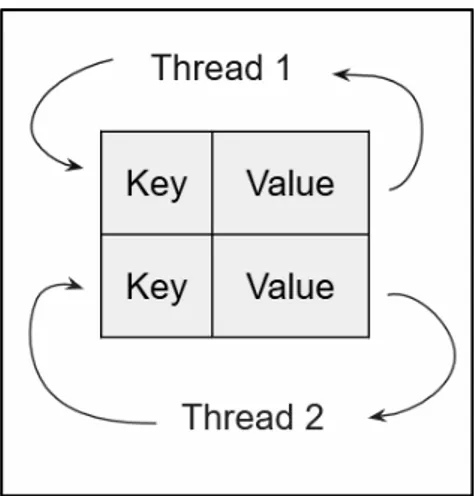
Table 5.4: Average total elapsed time for completion of a request with different partition sizes ... 42
Table 5.5: Average total elapsed time to receive the first partition with different partition sizes ... 43
Table 5.6: Size in bytes for each amount of data after serialization ... 47
Table 5.7: Average elapsed time for completion of a request with different serializers and Deflate ... 48
Table 5.8: Average elapsed time and percentage spent in each individual sub-part of the system‟s communication chain ... 49
Table 5.9: Average elapsed time and percentage spent in each individual step of the sub-part communication to client ... 49
Table 5.10: Achieved compression ratios for XS combined with Deflate ... 50
Table 5.11: Average total elapsed time for completion of a request with different partition sizes ... 51
Table 5.12: Average total elapsed time to receive the first partition with different partition sizes ... 52
Table 5.13: Results collected from the QoE survey for Prototype 1 ... 53
Table 5.14: Results collected from the QoE survey for Prototype 2 ... 54
Table 5.15: Results collected from the QoE survey for Prototype 3 ... 55
Table 6.1: Average total elapsed time for completion of a request for the original system and implemented prototypes ... 58
Table 6.2: Mean perceived QoE when working with the original system and prototypes 1-3 59 Table 6.3: Response times before the user could start working with any data ... 63
1
1 INTRODUCTION
In this chapter the reader is introduced to the measure Quality of Experience. This is followed by a short introduction of the company where the conducted work took place and their
warehouse management system. Finally the objectives, delimitations and thesis questions are presented.
For software that will be utilized by end-users, it is important to consider how those users will perceive the system. Crashes, freezes and slowdowns are all factors negatively affecting users [1]-[3]. In the fields of computer science and software development, Quality of Experience (QoE) is becoming a widespread measure [1], which is used to analyze how the user reacts while using a system [1], [2], [4]-[6]. From a more traditional perspective, Quality of Service (QoS) parameters have been in focus when improving software [1], which include metrics such as bit rates and delay properties. The QoS parameters are very technical and do not consider how the user actually perceives the system, but instead focuses on measuring how the system executes. A common conception is that improved QoS will also improve the QoE. However, the relation between QoS and QoE is complicated and nonlinear, as software which is technically good, may not satisfy the end-user. But overall, the QoS parameters are helpful when analyzing QoE [4].
To improve the perceived QoE when using a system, several factors have to be considered. Improving the overall system performance can lead to more satisfied users. For example when web surfing, if the system responds within 100 ms, the user may feel that the system is
reacting in real time. But if a system is slow, taking tens of seconds, the user may abandon the software altogether [6]. Focusing only on QoS parameters is not enough to guarantee a good QoE [5]; instead a focus has to be on other factors of importance. A concept seen in services such as Video on Demand (VoD), is data partitioning [7]. Data partitioning, when applied to e.g. network traffic, means that a part of the total data is packaged, creating a partition of the total amount of data, which then is sent. When one partition is received by the user‟s system, it is used directly, instead of waiting for the total amount of data. This lowers the user‟s idle wait time as the rest of the data is received in the background. The concept is applicable both e.g. for VoD where the user can start watching the video without having received the entire video file [7], or in a more technical sense where the partition size is set to fit the cache of a system, improving its performance [8].
During this work, a software system experiencing performance issues, when requesting large amounts of data, was analyzed. The architecture of the system and its communication chain offered room for improvement in both QoS and QoE aspects. To find the bottlenecks of the system‟s performance, several sub-parts were identified as possible candidates. The sub-parts were compared in order to find the largest bottleneck involved in data transfers throughout the system. As the communication chain included network communication, the technology of compression was implemented and tested as a possible solution, with the goal of minimizing the execution time for completion of a search, i.e. the time from that a user initiated a search to the time where data was displayed on the user interface. In addition, a data partitioning
2
solution with sequential transmission of partitions was prototyped, which had a focus on improving the QoE directly by looking at parameters such as improved transparency, feedback and control for the user. This partitioning solution applied the same principles as a VoD service, in which the data is sent as partitions [7]. This prototype allowed the user to receive a first partition quickly to start working with. The remaining data was then received in the background, decreasing idle wait time. Finally, the solutions were compared based on how much they individually increased the perceived QoE as well as whether the QoE could be increased further by combining the technologies.
1.1 Motivation
This work was conducted in collaboration with a company which had a system where end-users experienced problems when requesting large amounts of data. The system comprised of a database, server and client. When the system was tasked with transferring large amounts of data from server to client, it had a degrading effect on the system‟s performance, with long execution times and risks for data loss. As the system was not implemented in a way to support large data transfers, the perceived QoE in the service delivered to the user was in jeopardy.
An issue that made the system performance suffer, was its vulnerability to freezes and
timeouts during large data transfers. Moreover, the system did not present any information on whether the data received was all available data in the database. This lead the end-user into a fault when working with the data. In addition, the user did not know how much time or data was left before the transaction was completed. After a completed transaction, there was no information about how much data was received and how much was lost. There were very limited options for the users to control the retrieval of data; they could only search for all data and were forced to wait up until a set data limit amount was reached. These issues gave an opportunity to find solutions and technologies to increase the QoE by minimizing execution time, stabilizing the system during data transfers, guaranteed delivery of all data, increased end-user transparency offered by the system and a more dynamic end-user interface.
1.2 Background
Aptean AB is an international company that specializes on software for distribution,
construction techniques, financial and professional services, healthcare and metals. Aptean‟s headquarters are located in Atlanta, USA, but has offices around the globe. One of those offices is located in Hässleholm, Sweden. The product which the office in Hässleholm has responsibility for is a warehouse management system. This system has an architecture with a database server (Oracle with PL/SQL), application server (.NET) and desktop client
(WPF/.NET). Communication between desktop client and application server is done through a web service interface.
Using the application, the customers can easily overlook and control how their products are moving in and between warehouses. As the system is connected to both a desktop client and a thin client running on a handheld device, it is interactively used by the warehouse staff as they
3
can scan codes on the products, which directly transfers information about the product into the database. The system offers a broad set of functionalities where the customers can overview a large amount of logistics.
The problem arises when large amounts of data are requested from the desktop client through the server. The entire response for the request is sent as a large data object throughout the communication chain. When this object is created and then sent between parts of the communication chain, long execution times and risks of data loss are possible outcomes, lowering the overall system performance. Additionally, the system is vulnerable to freezes or time outs during large data transfers. All of these factors affect how the system is perceived by users. In the system, the large data problem is “solved” by using a hard limit on the server side of how much data is allowed to be sent in a response to a client. However, this limitation is bad practice as it does not solve the performance problem in the long run. This solution also lowers the QoE perceived by end-users as the system does not present any information if the data received was in fact all available data in the database or if the hard limit was reached. As no information is presented about whether the request received a full response, the end-users are misled into believing that they are working with all data.
The end-user transparency offered by the system is low, as the feedback towards the user is limited. Information about how much time is left before the transaction is completed, how much data was received and how much was left out is not presented to the user. These issues, combined with the fact that the user is not able to control an initiated search more than wait for it to finish, presented an opportunity to find solutions and technologies to increase the QoE by minimizing execution time, stabilizing the system during data transfers, guaranteed delivery of all data, improved end-user transparency and providing a more dynamic end-user interface.
1.3 Objectives
The foremost objective was to enhance the perceived end-user QoE as it was not sufficiently high when using the system and was not what Aptean desired to offer their customers. The objective was divided into several sub-objectives which were all responsible for solving a specific QoE related issue.
● Minimization of execution time to solve the data transfer latencies
● Guarantee data delivery to ensure that the end-user receives all requested data ● Stabilizing the system during data transfer to counteract system timeouts ● Increase the interactivity to let the end-user decide how data will be requested ● Increase the end-user transparency to inform users about their request‟s progress To achieve the sub-objectives, a set of studies were performed to gather information about the system‟s performance and how the system was perceived by the end-users. During the early phase of work, an initial case study of the system was performed, in order to identify the major performance bottlenecks present in the system. This study directed the performance
4
optimization work in specific directions based on the results. A QoE-analysis was also performed in order to identify how the users experienced the system. This analysis was conducted as a survey in which customer-representative staff from Aptean evaluated certain characteristics of the system based on the sub-objectives. Following the analyses, multiple prototypes were developed, where each prototype addressed one or more sub-objectives. To achieve an improved QoE, modifications of the system‟s communication chain had to be introduced. One prototype focused on decreasing the time for a search to be completed (i.e. execution time) by implementing compression and improved serialization. By introducing compression into the communication-chain, smaller data amounts were sent over the network making the system execution time decrease. Another prototype instead focused on the user interaction and interface design of the system. This prototype offered higher transparency towards the users, where the users had all information of what was happening. Such a prototype required fundamental changes of the data flow in the system, where the current communication chain was expanded by a partitioning scheme. With this prototype, new features became available where the end-user was given a higher degree of control over how the data will be requested and transferred, even if execution time in terms of request
completion (i.e. from initialization of a search to that all data was displayed) was not altered. In addition, when the data was split over multiple partitions, it improved the stability of the system as there was not a large set of data being transferred at once. When the system was able to handle larger data amounts, it also guaranteed that the end-users received all their requested data, as the hard limit previously used as a solution, was removed entirely.
Finally, the two prototypes were combined into a third prototype which addressed all the sub-objectives. These prototypes were then subject to a QoE analysis performed in collaboration with Aptean‟s employees, showing which solutions were desirable for maximized QoE enhancement.
1.4 Delimitations
The work and measurements were performed on a limited part of the warehouse management system, which requested and presented the data to the end-user. The client supported
functionalities to represent data in graphs and perform more advanced filters. During this work, the focus was on analyzing the data transfers in the system‟s communication chain. As all the data transfers of the system were utilizing the same base communication framework, this limitation did not affect the final outcome from the conducted measurements.
Another delimitation was that the data used in this work for conducting measurements and analyses, was only a specific record of data containing information about id, type, dates etc. Because of this, the performance measurements of this work are specific for this case and cannot point toward a general recommendation of which e.g. serializer and compression solution is the best in a general sense. But, as long as the implementation was optimized for this context, a solution which decreased execution time was compared toward a solution that implemented functionalities such as user interaction and transparency with a QoE analysis. The results from the QoE analysis were still comparable in terms of how the different
5
solutions affected the end-users‟ perceived QoE. Also, the results helped indicate which was the optimal solution or combination of solutions to achieve maximized QoE improvement. Aptean also wished to minimize any third-party licenses, which was a request taken into consideration when evaluating usage of third-party libraries during the development phase.
1.5 Thesis Questions
From the objective, the following thesis questions were constructed:
Q1: What affects the perceived end-user QoE of the system the most? Q11: Can the QoE problem be identified as an (issue),
Q111: execution time? Q112: data loss?
Q113: system instability?
Q114: lack of end-user interaction? Q115: lack of end-user transparency?
Q2: What is the improvement in QoE that can be obtained by implementing (technologies): Q21: compression?
Q22: partitioning? Q23: streaming?
Q3: By combining the technologies from Q2, can the perceived QoE be improved further?
Thesis questions Q111-Q115 are categories of problems which can affect the end-user‟s perceived QoE when using a system, these problems are performance related (Q111-Q113) or directly user experience related, i.e. not connected to performance (Q114, Q115). Q111 refers to execution time in terms of the elapsed time between the initialization of the search until all data is presented on the user interface. Q112 refers to data lost during a large data
transmission, such as data cut off by the hard limit. Q113 focuses on the system timeouts and freezes. Q114 refers to the lack of interaction in the system, where the end-user‟s options to control the system are limited. Q115 focuses on the information provided for the end-user when using the system, e.g. the progress of a search, number of rows received, etc.
In thesis questions Q21-Q23 technologies are brought up as hypotheses which could resolve the QoE related problems identified by Q1.
1.6 Outline
The outline of this thesis is as follows,
Chapter 1, Introduction, starts with a short explanation of QoE and its complex relation to QoS. The chapter brings up the motivation behind the work along with a short background of
6
the company and their warehouse management system followed by objectives, delimitations and thesis questions.
Chapter 2, Problem Discussion, gives a more detailed explanation about the problem Aptean faces with their IMI Supply Chain Warehouse Management System (IMISC-WMS) and goes into more detail about its architecture, used technologies and frameworks.
Chapter 3, Theoretical Framework, focuses on the concepts of QoE, performance evaluation metrics, network optimization, data partitioning and streaming.
Chapter 4, Method, looks into which empirical research strategies were suitable for this work and which were omitted. The chapter also explains how the time measurements were
conducted along with the calculation process of statistical values. Finally, the data used in this work is defined followed by a description of the QoE survey.
Chapter 5, Results, brings up three prototypes as proposed solutions and how they were implemented. The chapter also presents values collected from the initial case study, QoE analysis of the original system, and QoE analysis of the developed prototypes.
Chapter 6, Discussion, talks about the results collected during the previous chapter and what these results mean as well as how they relate back to the formulated thesis questions and theoretical frameworks.
Chapter 7, Conclusions, presents the final conclusions based on the thesis questions, by considering the implementations, research, measurements and discussion from earlier chapters.
Chapter 8, Recommendations and Future Work, presents interesting theories for further research and suggestions for improvements of the implementation are discussed. Finally a list of References is presented, followed by the appendixes.
7
2 PROBLEM DISCUSSION
In this chapter, the reader is given a better understanding of the problem through further discussion. This chapter also explains Aptean’s warehouse management system, IMISC-WMS, to give a technical foundation and understanding of its architecture.
The foremost objective of this work was to enhance the perceived end-user QoE provided by Aptean‟s system. The problem they faced was that their system became slow and
unresponsive during transfers of large data. Moreover, the system was in risk of timing out or freezing during these transfers. Finally, the system offered little to no feedback during data transfers. When accumulating all these issues, it was apparent that the system lacked in performance and also a Graphical User Interface (GUI) capable of providing progress
information to the user. Prior to architecting possible solutions to the problems presented, the original system had to be analyzed.
2.1 IMI Supply Chain Warehouse Management System
On Aptean‟s webpage the warehouse management system was described as “a supply chain management software solution whose architecture provides for extremely reliable and
scalable transaction handling for companies for whom dynamic supply chain management is a key competitive advantage” [9]. Furthermore, the system objectives were described as being able to provide “high-volume distribution for real-time control of enterprise, multi-channel, multi-language and multi-currency requirements” [9].
Aside from the definition, the architecture of the system was a client-server model [10]. In this model, there existed multiple clients using Aptean‟s desktop client (WPF/.NET), connected to a server running Aptean‟s application server (.NET). The desktop client sent tasks to the application server and the application server‟s job was to handle the concurrent job requests from multiple desktop clients. This required a server that was able to work with concurrent tasks, i.e. a server implementing several server threads [10]. Communication between desktop and application server was done through a web service interface. The application server was connected to a database server running Oracle with PL/SQL.
8
9
Figure 2.1 shows how a regular data request, e.g. a search, (1) from a desktop client located in Hässleholm, Sweden, was sent to the application server (2) in United Kingdom that handled the client‟s request. The server then queried the database (3) for the requested data, which was read using .NET‟s DataReader [11]. This datareader cached a specified amount of data on the application server. The data was then translated from database types to C# types and stored in a generic list provided by .NET [12]. The database reading process, including translation and allocation into the generic list, was iterated until all requested data was present in the generic list or until the implemented hard limit for maximum database rows had been reached. This maximum row limit was implemented as a countermeasure to the system‟s inability of
handling large data requests. When the application server transferred the requested data to the desktop client (4), all data was sent at once, because all data was stored in a single generic list. This data was then rendered in the GUI (5). The data transfers were handled by the Windows Communication Foundation (WCF) [13], [14] framework.
In the IMISC-WMS, both the desktop client and the application server were WCF
applications. WCF is a unified model developed by Microsoft for building Service Oriented Architecture. It is used when sending data between two endpoints and communication is based on three steps, called ABC: fusion of Address (to find where the service is), Binding (how to communicate with services) and Contract (information about what the service can do). From an architectural level, WCF is split into two layers, where one layer is dedicated to the communication and the other is an API which is easy to use [13]. This is visible in Figure 2.1 showing the abstract architecture behind the IMISC-WMS, where the system is divided into a client which requests data and a server which responds to these requests.
Communication between these two layers was performed by passing objects of the Message type, both for sending and receiving information [15], and the messages were passed using HTTP. The receiver, i.e. the application server, received the message, and forwarded the data to the correct action [16].
The action which was performed on incoming data was decided by using service contracts, which mapped services (methods). A service contract which had both input parameters and a return variable, when called from the client side, constructed a Message object that held the input parameters and then forwarded it to the service-side method. When the method then returned, the returning object was put into a new message and was sent back to the client [16]. In his instructional article, A. Skonnard describes how and where the default WCF behavior is extended [17]. When the client starts the process of sending a message, it passes through three main steps: Parameter Inspection, Message Formatting (serialization) and Message
Inspection. After passing these three, the object is packaged into a message and is forwarded onto the network. Each of these steps are customizable, e.g. implementing filtering in the parameter inspection step, adding custom serialization in the message formatting step or logging in the message inspection step, resulting in a possibly modified message object. When the service receives a message, it passes through five steps. First through the Message
Inspection and Operation Selector. These two steps define to which operation the data in the message will be forwarded. When the correct operation is identified, the message contents are
10
deserialized in another Message Formatting step and then further passed through Parameter Inspection and Operation Invoker steps. As with the client, each of these steps is modifiable and allows adding custom behavior [17].
The implementation of the IMISC-WMS had limitations when it came to reaching a high perceived level of QoE for the end-user. Not only did the system timeout because of large data requests, but the implemented solution applying a maximum limitation of database rows did not allow the system to guarantee full data delivery. Moreover, the system acted like a black box, meaning there was limited transparency. The end-user was not informed of how much of the available data he or she received from the request, neither did the end-user get information about how long a request would take or the progress of that request. These were factors heavily affecting the users‟ perceived QoE, from which the end-user was left feeling that he or she had no control over the system‟s functionalities. Additionally, for requests of large data amounts, the execution times for these requests were long, because of how the data was transmitted across the network.
2.2 Opportunity
The problem defined and discussed for Aptean‟s warehouse management system gave opportunity to look at how different QoE issues, defined in Chapter 1.5 Thesis Questions, affected the end-user‟s perceived QoE. It also gave opportunity to investigate how these different QoE problems affected the end-user‟s perceived QoE on different scales, meaning whether it was a performance issue or it was other factors like end-user interaction or transparency that was the most impactful issue affecting the end-user‟s perceived QoE. To answer these questions, it was necessary to investigate different technologies and theories that could be implemented as proposed solutions. These solutions were then focused on solving different QoE-related issues, meaning that one implemented solution focused solely on decreasing the execution time of the system while another implemented solution focused on affecting the end-user‟s perceived QoE through other means such as improved end-user transparency, interaction, data delivery and system stability.
11
3 THEORETICAL FRAMEWORK
In this chapter, explanation of theories, technologies and concepts relevant for the work are presented. The subjects studied in this chapter are QoE, performance evaluation techniques, network optimization, data partitioning and streaming.
From the objectives and thesis questions along with explanations of how the IMISC-WMS worked as well as what technologies it implemented, theoretical areas were identified as being of interest and further investigated. Thesis question Q1 brought up the area of QoE as a clear focus for this work. To reach a better understanding of the measure, relevant literature was studied. Thesis question Q1 asked about what kind of QoE issues were present in the system and which had the largest impact. To be able to answer this question, techniques on how to measure perceived QoE and system performance were investigated. Finally, thesis question
Q2 brought up some suggested technologies that were possible solutions to the identified
issues in Q1 that had negative effect on the end-user‟s perceived QoE. The technologies hypothesized in Q21-Q23 were compression, partitioning and streaming leading to that these areas also were studied.
3.1 Quality of Experience
The concept of measuring the quality an end-user perceives from usage of a system or technology has during the last few years been called QoE. The International
Telecommunication Union Telecommunication Standardization Sector (ITU-T) has defined QoE as “The overall acceptability of an application or service, as perceived subjectively by the end-user” [1], [4], but this definition is lacking as it only focuses on the subjective experiences of the users. QoE is intended to be a definition of human quality needs and expectations. Historically, approaches for improving end-user quality have been focusing on QoS parameters [1], not including the end-users‟ response to using the systems. While QoE focuses on the subjective end-user perception of quality, QoS focuses on the technical parameters. In [5] it is described that the QoS parameters of a network are bit rates, delay properties and packet loss. Although it is easy to assume that an improvement of QoS parameters in a network such as lesser delay times of packages lead to an improved service for the customers, there is no guarantee that the quality that customer perceives will improve at all [5]. Although adding QoS parameters as influencing factors on QoE is helpful when trying to analyze QoE objectively, the relation between QoS and QoE is both complicated and nonlinear. QoS parameters are not enough, as “It has been proved that a technically sound product will not necessarily satisfy the user” [4].
The perceived QoE by the end-user is affected by a variety of different aspects. For example in [2], an implementation of a smartphone application was studied and from the study the result yielded that end-users‟ QoE were affected by the application interface design. Some end-users felt that they had problems with the input keys‟ location on the screen, difficulties resizing the application and other user interactive functionalities. Moreover, there also were complaints about the application performance. The end-users‟ QoE was degraded by the occurrence of freezes (application timeouts), poor performance, long delays in response time,
12
memory management of their SD cards, etc. From the study it also became apparent that missing desired or expected application features affected the QoE. The study showed that the application‟s users felt they missed features like flash player, special settings, GPS, etc. From the study‟s results in [2], it is shown that the perceived QoE of the end-user is affected by not only performance but also features and design [2].
In [6], the field of usability engineering is used to determine the reaction time thresholds for user perception of web surfing. The thresholds are said to be as follow: “100 ms is roughly the boundary at which a user feels the system reacting instantaneously; less than 1 s keeps the user‟s thoughts, although a delay is perceived; less than 10 s keeps the user‟s attention, while exceeding 10 s implies the risk of the user abandoning the activity” [6]. This point towards the importance of performance, in terms of response times, when working towards an improved QoE in any networked application. In [6], it is discussed that the perceived QoE becomes more valuable, the higher the quality perceived by the user is. When the user perceives the QoE as high, small delays in response time or other changes leading to degraded QoE are more impactful. But when the user‟s perceived QoE is low, a small delay does not affect the QoE with the same impact as on a higher level [6]. It is important to note that the perceived QoE varies between individuals of different ages and genders but also between different roles like customers or users. The idea is that people of different ages have different tolerance levels towards QoS degradation (e.g. increased delay times) and the customers of the product have different QoE requirements than those of the users [1]. In a field study by S. Afshari and N. Movahhedinia [3], they identified that it is a valid consideration to include the user‟s sensitivity when measuring QoE. A sensitive user quickly notices a small degradation in the service‟s quality, which affects their perceived QoE, while an insensitive user accepts that the system slows down or in some cases stops. This is important to consider when having limited resources, as QoE measurements results from very sensitive users will skew the results, e.g. making a service provider increase the quality more than necessarily, leading to network overuse [3].
As the QoE definition offered by ITU-T is purely subjective, a new definition is suggested by P. Brooks and B. Hestnes: “QoE is a measure of user performance based on objective and subjective psychological measures of using a service or product.” [18], to alleviate the limitation of only subjective measurements in the definition. In their paper, P. Brooks and B. Hestnes [18], explored different approaches to current QoE measurement techniques.
Following the recommendations of International Telecommunication Union, evaluation of network services has three parts: User-perceived QoS, subjective QoE and modeled media quality. The measurements from user-perceived QoS are used to detect changes in quality. They are usually focusing on user perception and behavior, using self-reporting ratings and calculations to measure a mean opinion score. Subjective QoE is also based on user input, but focuses less on technical aspects and more on the end-user satisfaction with the service. Modeled media quality differs from the other two, as it does not focus on direct user response, but rather on objective measurable parameters which are modeled with a goal to optimize the experienced quality [18].
13
Using ordinal scales (Bad, Poor, Fair, Good, Excellent) is a very common way of measuring QoE, which also introduces limitations [3], [18]. The distance between each option is not necessarily equal, making statistics which require intervals or ratio data, such as the mean and standard deviation, invalid. The suggestion is to instead use a label-free scale, or a scale with labels in each end. This involves less subjective interpretation and allows for better statistical comparisons of the measurements [18]. Measuring the QoE in this fashion makes the data more objective, contradicting the “widespread misunderstanding that objective measures can only be collected from technology and that data from users is necessarily subjective” [18]. In [3], [4], an automated process of measuring QoE is constructed, and as such, the studies moved away from using user self-reporting methods. Instead they have been relying on objective data either by monitoring physiological values (heart rate, breathing, etc.) of the test subject [3] or by identifying signs in usage which show that the user‟s QoE is decreased (e.g. word repetition during cellphone communication) [4], which offered data that the subject was not able to easily falsify.
3.2 Performance Evaluation Metrics
When developing software that requires a certain level ofQoE, QoS, or both a common problem is how its performance will be measured. “To be scientific and precise in our
computer systems performance studies, we must focus on measurable quantitative qualities of a system under study.” [19].
P. J. Fortier and H. E. Michel [19] present the fundamental concepts required for computer system performance evaluation by applying measurements. Two general categories of performance measures are: system-oriented measures and user-oriented measures. They further discuss four quantities which are important for measurements, namely time, events, intervals and responses. Additionally, three concepts useful for computer system performance measurements are discussed; independence, randomness and workload. Finally, different monitoring approaches are discussed.
3.2.1 System-oriented and User-oriented Measurements
System-oriented measurements are technical measurements which are easily quantifiable, by e.g. measuring the average amount of items processed per unit, the throughput is defined. Another metric is utilization which is gained by measuring the fraction of time that a resource is busy [19].
Another type are user-oriented measurements, which focus on response time or turnaround time. These values describe the elapsed time between that the user have initiated a task and that the system responds. But the user-oriented metrics are not clear by their definition, as there are many variables which affect the outcome, such as unrelated CPU work or I/O traffic [19]. In order to use these, it is of high importance to reduce the ambiguity in the values by defining an unambiguous definition of the value‟s meaning. The values have to be presented as expected or averages together with variances, as the values are considered almost random [19].
14
In all cases where these measurements are performed, a basic understanding of the environment and its parameters has to be acquired. A metric typically used in computer systems, is time [19].
3.2.2 Time as a Metric
“Time is the most fundamental of concepts needed for computer systems performance analysis.” [19]. If there is no set concept of time, the performance studies cannot become quantitative. Time as a metric is common when measuring computer system performance; arrival time, service time, time between failures, time to repair and such are all common values associated with both time and computer system performance, and all of them share a common property: they require a reference point from which their meanings are determined [19].
In computers, the time is calculated based on fixed time intervals, where each second is broken down into multiple smaller units. “Typical computer systems clocks or cycle times are measured in nanoseconds (10-9 seconds) or in slices of about one-billionth of a second.” [19]. These values are useful when comparing the CPU speeds in computers, e.g. a CPU with 1.5GHz clock, means that it has a clock cycle of about 0.67 ns [19].
When time is measured, it is the duration between two points which are of interest. These points differ depending on what the measure‟s goal is. They are e.g. the start and end of a database transaction, or more detailed points where time for connecting to the database, running the database transaction and returning the data are separated. These points are called events [19].
3.2.3 Events, Intervals and Responses
Events are descriptions of something of interest in the system. Usually events represent actions, such as the beginning or end of an instruction execution cycle, data reading from memory, etc. [19]. These events must be controlled in a way that their order becomes
meaningful, e.g. by leading up to a larger event. If the order is clearly defined, the events are easily measurable as the analyst can expect their order. Taking the example of the start of a computer clock cycle, which is an event followed by several other events where data is read and calculated. These small events are part of larger events, e.g. events which initiate data transfers from a storage disk or perform memory management [19].
Aside from organizing the events based on their order, it is also of use to categorize the events based on their size. Smaller events happen at the nanosecond range, while larger events are in the tens of milliseconds range [19].
The duration between two events depend on the environment. In computer systems, different environments are possible, one being the system clock and instruction execution cycle and another being higher level functions. Intervals are used for different measurements, e.g. for
15
the duration of an action, by measuring the interval between the start and stop events or the time between occurrences of actions, i.e. the time from one stop event to a start event [19]. Response time is another important measure in computer system performance. P. J. Fortier and H. E. Michel describe it as “a measure of the period of time a user or application must wait from the point of issuing some action or command until the completion and return of control for the requested command.” [19]. Response times are of importance not only as a metric in computer system performance, but as several of the QoE-related works have described, is important for how the software is experienced by the user [2], [3], [6]. If a system responds slowly, sensitive users will quickly notice [3]. The actual definition for slow varies, [19] describe that a tolerable range for a response time is between 1 and 3 seconds while [6] suggest a scale focusing on web surfing with finer granularity, which describes 1 second as noticeable, and over 10 seconds as too slow response time.
3.2.4 Independence, Randomness and Workload
Independence, randomness and workload are all concepts which are important to keep in mind when evaluating system performance. Independence between events implies that one event does not influence another event. When an independence is asserted, it is no longer required to take the other event‟s state into consideration [19].
Identifying randomness is also crucial in system performance analysis, as truly random events cannot be mapped to patterns and therefore they are hard to predict. However, proving true randomness is very difficult, but the opposite is easier: If a pattern is matched to an event‟s occurrence, it is not random. These random events are e.g. user keystrokes or remote calls, which affect the performance of the system being evaluated [19].
Workload, or more simply; load, is the amount of event sequences which are ready to execute during a set timeframe. When the load is measured, it is important to not only measure the amount of instructions ready for execution, but also to consider the type of instructions and the duration of the entire load [19].
3.2.5 Monitoring
The metrics and concepts presented above are measured and observed by applying some system monitoring approach. Computer system monitoring is divided into two general categories: hardware monitoring and software monitoring. Hardware monitoring is either achieved by adding hardware components to the system which will measure or extract signals, or by using internal available testing hardware. When performing hardware monitoring, the additional hardware is not allowed to interfere with the original system, as this would lower the validity of the measurements [19].
Software monitoring is run through the active system. Typical software monitoring is performed as trace monitoring, where code is added into the code sequence, so that it allows for monitoring [19]. P. J. Fortier and H. E. Michel describe that common measures for this
16
kind of monitoring are “how often a code segment is entered, how long the code segment runs, or how much of the total systems time the code segment utilizes.” [19]. One drawback of software monitoring is that it requires the knowledge of where, in the code, the samples will take place beforehand. This is because the code monitoring the code sequence, have to be implemented before the sampling starts. Also it is necessary to know at which frequency the sampling will occur [19].
3.3 Network Optimization
Previously, approaches to measuring performance have been presented. A specific
performance optimization approach that allowed for improvement in QoS parameters of the IMISC-WMS was altering the serialization and introducing compression in the
communication chain. This leads to lesser delay times when transmitting data across the network [20]-[22].
3.3.1 Serialization
“Serialization is the process of converting an object into a stream of bytes in order to store the object or transmit it to memory, a database, or a file.” [23]. The goal is to send an object over e.g. a network, and for it to be received by another software which can deserialize the
information and recreate the same object. The concept is also useful for developers wishing to store the state of an object and recreate it at a later point. But when focusing on serialization for network optimization, the serialization and deserialization is applied in a data exchange context [23].
K. Maeda [21], describes serialization using Java as an example. Java‟s Remote Method Invocation is used to invoke a method in another Java Virtual Machine. The method‟s
parameter objects have then to be communicated to that other machine. To do this, Java takes the objects‟ data and writes it into bytes which then are transferred over the network. On the receiving side, the received bytes are rebuilt into objects, allowing them to be used as parameter objects once again, which is the goal of serialization [21]. But, from an
optimization perspective, the size of the communicated objects matter. To decrease the size, compression is introduced [22].
3.3.2 Compression
Data compression is the concept of reducing the number of bytes used when storing or transmitting data. Many formats used for representing data have a certain degree of redundancy. Redundancy, when it comes to data compression, refers to the redundant information that takes extra bytes to encode. For example, when looking at Extensible Markup Language (XML), the major disadvantage is the large size of the format and its repetitive nature [24]. This leads to high redundancy, including unnecessary number of bytes. If those extra bytes are removed, the size will be smaller [22].
There exist two commonly known approaches for data compression, called lossy and lossless. Lossy data compression is when all data does not necessarily need to be transmitted. In [22],
17
lossy data compression is described as working towards “a certain loss of accuracy in exchange for greatly increased compression”. When using compression for graphic images and digitized voice, not all data is necessary to be able to recreate the digital image or voice at the receiver side in a desired level of quality. When it comes to lossless compression, the focus is on creating an identical copy of the message at the receiver side. This means that all data bits in the input stream must be identical at the receiver‟s output stream. Lossless compression is used when storing data records, spreadsheets and for other data storing or transmitting purposes where every bit of data is important to be able to recreate the exact information [22].
Data compression has different components, each responsible for different functions of the compression process. In [22], compression is described as “taking a stream of symbols and transforming them into codes”. The first important component of the compression process is called a model. The model consists of a set of data and rules that are used to determine which symbols in an input stream will be matched to which codes in the output stream. The model will assign a probability to each symbol and then it is the en-/decoders job to output the correct code matching that symbol based on the symbol‟s probability [22].
The compression process can utilize a variety of different types of en-/decoders. But,
according to [25], Huffman is commonly used. Huffman encodes with both high compression ratio and fast execution speed. The code is implemented either as static or dynamic Huffman code. The static implementation is based on statistical probability where all symbol
occurrences in the input stream are represented in a binary tree based on their probability. The dynamic implementation‟s fundamental difference from the static is that it has the ability to update its binary tree from different input streams [25].
When looking at the usage of Huffman coding [22], the model‟s job is to calculate
probabilities and assign them to symbols. Symbols with high probability will be represented with few bits while symbols with lower probability will be represented by a larger amount of bits. It is the en-/decoders job to take a symbol with a probability and match it to the right output code [22].
The model component in the data compression process is of two major types, one of which is the statistical model. In [22], a statistical model is when the model “tracks the probability of a symbol based on what symbols appeared previously in the input stream”. This means that the model takes different order levels, where an order level is how many previous characters in the input stream will be considered when calculating the probability for the character [22]. The statistical model is either implemented with a static table of probabilities or as an adaptive model. The static table of probabilities is constructed by analyzing representative parts of data. When the program later will compress data, it accesses the table during the compression process to find the codes related to the symbols. The adaptive model, instead of statically constructing the table first from a representative part, dynamically updates the table during compression as new data is encountered [22].
18
The dictionary model does not, like the statistical model, encode a single symbol at a time. Instead the dictionary model utilizes pointers. The pointers will be used as reference to a sequence of characters that have been encountered before. The sequence, or string, of characters will be put in a dictionary with a corresponding index and when that string is encountered the index will be used instead. The longer the string, the higher compression ratio will be gained [22].
3.3.2.1 LZ77
In [22], it is mentioned that Ziv and Lempel developed, in year 1977, a pair of compression methods using an adaptive dictionary data compression model to reach impressive
compression ratios. One of these compression methods, or algorithms, is called LZ77. The LZ77 dictionary is populated with all strings in a 4-KBytes window from the previously read stream. Then when reading the new stream, that window is used to find matches from the previous stream and the pointers will be inserted into the output stream. The LZ77 and its different variations are popular compression algorithms. It is easy to handle the model and en-/decoding the output is rather simple. This leads to programs which use the LZ77 achieve good compression ratios while still maintaining a desirable execution speed [22], [25].
3.4 Data Partitioning and Streaming
The previous research on serialization and compression are technologies that focus on
improving the end-user‟s perceived QoE through enhancement of the QoS parameters such as execution time. While this is a good approach, it does not guarantee that enhancement of QoS parameters will improve the user‟s perceived QoE [5]. To look at other factors that improve the user‟s perceived QoE, not simply through execution time minimization, the areas of data partitioning and streaming were studied.
When talking about partitioning in the context of databases it is said that “Databases are designed to manage large quantities of data, allowing users to query and update the
information they contain. The database community has been developing algorithms to support fast or even real-time queries over relational databases, and, as data sizes grow, they
increasingly opt to partition the data for faster subsequent processing” [8]. Partitioning is the concept of taking something large, in example of database; a large data table, and break it down into several smaller entities. One reason to how this improves the performance is that the cache locality is utilized better. If it is guaranteed that the size of the entities does not need more space than what the cache has resources to assign, a data collection larger than the cache will benefit from partitioning making every partition small enough to fit in the cache. When this partition of the data is being processed, better cache locality is achieved, leading to increased performance [8].
Another approach to modify network communication is to apply data streaming. Streaming is a method used in situations which work with real-time data streams [26]-[28]. In healthcare, a real-time monitoring system of epileptic patients, based on streaming data, is proposed. With multiple sensor devices and loggers, the system suggested is intended to help the patients
19
manage their illness [28]. The scientific computing communities are also increasingly reliant on large amounts of incoming data. A. Hutanu and S. Nimmagadda [27], present a scenario where much incoming data is streamed from servers, through a network, to a machine which will render the information into a visualization. Then this image data will be further sent to a displaying machine [27]. For a more general usage, a framework called the MeDICi
Integration Framework (MIF) is being developed, “designed to support loosely coupled components, asynchronous communications and efficient data transfer between components” [26], and allows for scalability by use of pipelines. I. Gorton and his team has used evolving versions of the MIF to build several demanding applications, which show that their
framework is a legible part of a system with many large data streams [26].
The team building a real-time monitoring system for epileptic patients [28] used an approach which utilized a Data Stream Management System (DSMS). The DSMS offered the tools required to perform continuous queries of the data stream. This allowed them to control the queries, scheduling and handling of missing data [28]. Another problem appears when trying to parallelize the data transfers, and usage of the common TCP. A. Hutanu and S.
Nimmagadda state that “It is well known that TCP is not suitable for fast (hundreds of Mbps to multiple Gbps) data transmission across wide area, possibly dedicated networks” [27] and mean that other protocols have to be considered. The congestion control of TCP is a common problem, and there are many versions of the protocol which alter the control algorithms. For their application, the User Datagram Protocol (UDP) is used, which allows the application to control the transmission rate. Using UDP with application controlled transmission was proved to achieve the best data transmission performance compared to other protocols [27].
3.4.1 Video on Demand
Data partitioning is applied in some VoD services. But VoD is also referred to as a streaming service [29]. To serve data efficiently to the clients, H. Kim and S. Park [7] suggest a scheme which divides the video into a front part and a rear part. The front part is shorter, which makes it possible to receive it faster and start the video playback, while the longer rear part is


![Table 5.4: Average total elapsed time for completion of a request with different partition sizes Average Elapsed Time [s] to Get All Data Data [Rows] Statistical Parameter 1000 10 000 100 000 500 000 800 000](https://thumb-eu.123doks.com/thumbv2/5dokorg/5518319.143929/59.892.107.780.128.680/average-completion-different-partition-average-elapsed-statistical-parameter.webp)
![Table 5.5: Average total elapsed time to receive the first partition with different partition sizes Average Elapsed Time [s] to Get First Partition of Data Data [Rows] Statistical Parameter 1000 10 000 100 000 500 000 800 000](https://thumb-eu.123doks.com/thumbv2/5dokorg/5518319.143929/60.892.109.779.118.687/average-partition-different-partition-average-partition-statistical-parameter.webp)
