Doing good to do well?
Corporate Social Responsible and Return on Investment in
Sweden
Master Thesis in Economics
Author: Marcus Johansson
Tutor: Johan Eklund and
Tina Wallin
i
Master Thesis in Economics
Title: Doing Good to Do Well? Corporate Social Responsibility Return on Investment in Sweden
Author: Marcus Johansson
Tutor: Johan Eklund and Tina Wallin
Date: 2013-01-11
Keywords: Corporate Social Responsibility, Stakeholder Theory, Q-Theory of Investment, marginal q
Abstract
This paper treats Corporate Social Responsibility as an investment in corporate reputation and as such aims at investigating the return of that investment. It does so partly by estimating the effect of being perceived as socially responsible on the firm’s ability to maximize shareholder value and partly by estimating the effect on a more traditional accounting based measure of financial performance. Results indicate that socially responsible firms are able to maximize shareholder value to a greater extent than less responsible firms while at the same time not necessarily performing better in traditional accounting terms.
ii
Table of Contents
1. Introduction ...1
1.1 Background and Problem Discussion ... 1
1.2 Previous Research ... 3
2 Theoretical Framework ... 5
2.1 Stakeholder Theory ... 5
2.2 Agency Theory ... 6
2.3 Theories of Corporate Reputations ... 7
2.4 Q-theory of investment ... 8
3 Method ... 13
3.1 Measures ... 13
3.1.2 Measure of Corporate Social Responsibility ... 13
3.1.3 Measure of Corporate Financial Performance ... 15
3.2 Data ... 16
3.3 The Model ... 18
3.4 Estimation Technique ... 23
4 Empirical Results ... 24
5 Summary & Conclusions ... 30
References ... 31
iii
List of Figures
Figure 1: Shareholder Value Maximizing Investments..……….………11
Figure 2: Histograms………....…….38
List of Tables
Table 1: Commonly Used Measures of Corporate Social Responsibility………..4Table 2: Descriptive Statistics of CSR Data………...…...……….….16
Table 4: Median CSR-Scores by Market Capitalization………...………...……….17
Table 5: Variance Inflating Factors for Different Specifications………..………..….21
Table 5: Estimates of Marginal q ………..…24
Table 6: Estimates of ROA ………..……...24
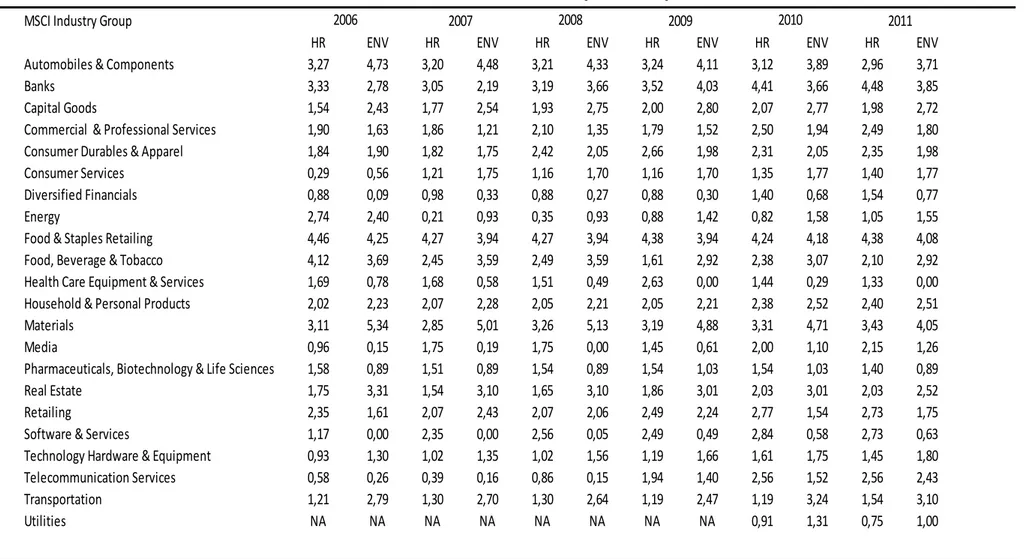
Table 7: Median CSR-Scores by Industry ……….35
Table 8: Regressions Results for Different Estimation Techniques....…………..………..36
1
1. Introduction
During recent years the interest in questions regarding the role of the company in society has increased drastically. In particular, public interest in the question of corporate social responsibility (CSR) has risen and at the same time, corporate awareness has increased as well. In 2011, over 90% of the companies listed on the Stockholm stock exchange reported on one or several issues related to CSR in their annual reports. In 2006, that figure was just above 70%.1 The question is why?
The obvious answer would be that firms observe the increased public interest and adapt to it believing that it would grant them some future benefits. Commonly, these benefits are thought to arise through positive goodwill effects from consumers and the investment community. However, whether or not such positive effects actually exist is a question of much debate. This paper seeks to add to that debate. Existence of positive goodwill effects would imply that firms who are perceived as responsible are performing better than those who are not, all else equal. If goodwill effects do not exist responsible firms would do worse given that there are costs associated with being responsible, again all else equal.
From a shareholders point of view the question becomes whether or not engagement in CSR-related issues is in their interest. They can choose to believe that positive effects exist and that they are large enough to offset any costs or other negative effects in which case engagement in CSR would be preferable. If they don’t however, engagement in CSR would be perceived as harmful to the shareholders desire to maximize wealth and would thus constitute an agency problem.
1.1 Background and Problem Discussion
Corporate Social Responsibility has had many different definitions and interpretations attached to it over the years and each one of them try to address the role of the company in society. Generally, there have been two conflicting views on what that role should be. The first view was famously formulated by Friedman (1970) who suggested that the only responsibility of corporations is to maximize profits for its shareholders, while obliging to the laws of the society in which they are active.
____________________
1.
Folksam Index on Responsible Business 2011 and 2006, available on:
2
This view is still shared by many economists2 and corporate executives today. The seconds
view is that the firm has responsibility not just towards their shareholders, but towards a set of multiple stakeholders, often just labeled as society as a whole. The economic arguments for this view are outlined in the theoretical framework. Proponents of stakeholder theory argue that adhering to said responsibility would allow the firm to perform better, all else equal.
In light of these conflicting views, this paper aims at investigating whether or not socially responsible firms are performing better than their less responsible counterparts. Engagement in CSR is treated as an investment in corporate reputation and as such, the return of that investment to the owners of the firm is the focus of the paper. The hypothesis of this paper is that firms have a positive return on their investment in CSR and thus that firms who are perceived as responsible are better prepared to deliver strong financial results than those who are not, all else equal.
To test this hypothesis, this paper will examine whether firms that are perceived as more socially responsible are more successful in maximizing shareholder value than firms that are perceived as less responsible. The paper will also examine if any positive or negative effects of CSR on financial performance exists when looking at more traditional accounting based measures. A responsible firm is defined, in accordance with Wood (1991), as a firm that is able to “meet or exceed the expectations of stakeholders on social issues”. The hypotheses of this paper thus become:
H1: Firms who are perceived as socially responsible are better at maximizing shareholder value than firms who are not.
H2: Firms who are perceived as socially responsible perform better in accounting terms than firms who are not.
The acceptance of H1 and H2 would lend support to stakeholder theory in the sense that it would indicate that firms who adhere to their social responsibility towards society as a whole performs better than firms who do not. Rejection however, would indicate that this is not the case.
The paper is organized as follows: The first section provides a brief overview of previous studies of the link between corporate social responsibility and financial performance. Section two lays out the theoretical framework underlying the reasoning behind the hypotheses and the testing of them. The third section describes and discusses the data and model used for hypothesis testing. Section four present the results and provides an analysis thereof. Section five concludes.
____________________
2.In particular, proponents of the Austrian school of economics tend to question the notion that companies have
3
1.2 Previous Research
Several previous studies have tried to measure the relationship between corporate social responsibility (CSR) and corporate financial performance (CFP), with mixed results. In a review of previous studies on the subject, Griffin & Mahon (1997) found 33 studies that indicated a positive relationship between CSR and CFP, 9 which were inconclusive and 20 that indicated a negative relationship. Their work was later replicated by Roman et al. (1999) who found 33 studies indicating a positive relationship, 14 inconclusive and 5 that indicated a negative relationship. Roman et al. (1999) argued that the discrepancy between their results and those of Griffin & Mahon (1997) were due to the fact that the latter survey included studies whose results had been later refuted or who´s methodology was “unsound” (Roman et al., 1999, page 120). Arlow & Gannon (1982) surveyed 7 previous studies on the subject and found the relationship between CSR and CFP to be inconclusive.
Needless to say, previous research on the subject is both comprehensive and contradicting. One of the reasons for this is the vast array of different variables used to measure both financial and social performance. Griffin & Mahon (1997) lists no less than 80 different variables used to measure financial performance in previous studies. The measures of social performance have also varied substantially over time, mostly due to the availability of new data. Typically, the variables used to measure financial performance is traditional accounting based measures such as return on assets or return on equity. Examples of studies making use of these measures are McGuire et al. (1988), Waddock & Graves (1997) and Bowman & Haire (1975) who all found a positive link between CSR and return on assets/return on equity. Alexander & Buchholz (1978), Soana (2011) and Nelling & Webb (2009) employed the same measures but found no significant relationship.
To some extent, market based performance measures have been used as well by for instance Sturdivant & Ginter (1977) who found a positive relationship between CSR and growth in earnings per share, Herremans et al. (1993) who found that more responsible firms earned higher abnormal stock market returns than less responsible firms, Folger & Nutt (1975) who found no relationship between CSR and a firms price-earnings-ratio and Vance (1975) who found a negative relationship between the price change of a stock and CSR.
The measures of corporate social responsibility has ranged between everything from the authors own subjective opinion of a company (e.g. Moskowitz (1972) and Parker & Eillbert (1975) who both found a positive relationship between CSR and financial performance) to government indices (Folger & Nutt (1975), no relationship found) and rankings published by magazines (McGuire et al. (1988), positive relationship). Table 1 below summarizes the three most commonly used categorizes of measures of CSR, some of the more well-cited studies using that measure and the results.
4
Table 1- Commonly used Measures of Corporate Social Responsibility
Even though the data has varied substantially across previous studies, the methodology has generally not. It has almost exclusively been that of an ordinary least squares regression of some measures of perceived level of responsibility on a measure of financial performance. This study offers no novelty in terms of methodology, but takes a slightly different approach than the majority of previous studies when it comes to the measures of financial performance. The focus is on a very specific type of financial performance, namely the ability to maximize shareholder value. To properly measure this, a market based approach with its starting point in the Q-theory of investment will be utilized. As will be shown later, the methodology uses market data to measures the firm’s financial performance on the margin, an approach which haven’t been found in any of the previous studies surveyed. This measure also account for differences in risk across firms, something that many previous researchers have failed to properly control for (McGuire et al., 1988). To examine if any results found would have manifested itself had we gone in the footsteps of previous researchers and used a more traditional, accounting based measure, such a measure will be used as well.
Measure of Corporate Social
Responsibility Example of Researchers Results
Researchers own opinion Moskowitz (1972), Parker & Eillbert
(1975) Positive Relationship
Government Indices Folger & Nutt (1975), Spicer (1978) No relationship, Positive Relationship
Reputational Indices McGuire et al. (1988), Waddock & Graves (1997), Alexander & Buchholz (1978), Vance (1975)
Positive Relationship, No
5
2 Theoretical Framework
2.1 Stakeholder Theory
Stakeholder theory was first developed by Freeman (1984) and deals with the idea that every firm has multiple stakeholders who all have different claims on the company. Typical examples of stakeholders include shareholders, employees, suppliers, government, trade unions, civil society, customers and other financiers but generally a stakeholder can be said to be anyone who has a claim, implicitly or explicitly (Cornell & Shapiro, 1987), on the company. Stakeholder theory can be viewed as opposite to the more traditional view of the company where the firm´s owners and their explicit claim of return on investment is the only firm-stakeholder relationship of importance. Friedman´s (1970) famous New York Times article is an example of this view.
One of the implications of stakeholder theory that is of particular importance for this study is outlined by Cornell & Shapiro (1987). In their framework stakeholders can have either implicit or explicit claims on a firm. Explicit claims are easy to identify and could typically be wage contracts, dividend policies, required returns or bond payments. Generally put; claims that can be explicitly priced and formulated in contracts.
Implicit claims are basically all claims which cannot be priced or explicitly regulated in a contract. Such claims could for example be the implicit promise of a manufacturer to supply spare parts for its products, an employer to provide a certain work environment for its employees or a producer of a support product or service to continue to exist. An example of the latter would be auto repair shops. Every car that is sold is sold together with an implicit promise that if the car breaks down there would be an, often independent, mechanic around to fix it. If all auto repair shops specialized in a specific brand of cars would go out of business, the value of the car sold would be less for the buyer.
The implications of this reasoning is that in a situation where every firm have multiple stakeholders and those stakeholders all have their own claims, the firm suddenly finds itself in a situation where it needs to service (or appear to be able to do so in the future) both implicit and explicit claims.
6
Cornell & Shapiro (1987) shows us that the firm’s prospects of being able to serve these claims are part of the overall valuation of the firm. In their framework, firms can very well default on implicit claims without defaulting as a whole, but a default on implicit claims leads to a decrease in market value of the firm as markets become uncertain about the ability of the firm to service its other implicit claims in the future. A default on explicit claims such as bond payments or wages would of course also result in a decrease in market value. Thus, given that the failure to service an implicit or explicit claim leads to a decrease in market value, it can be said that in the context of stakeholder theory the service of claims to all stakeholders becomes necessary to be able to serve the traditional claim of maximized shareholder value.
In this paper, corporate social responsibility is treated as an implicit claim held by society as a whole, on the company. It thus follows that companies that service this claim by being perceived as socially responsible should be better at maximizing value for its shareholders because it helps them uphold its market value (Cornell & Shapiro, 1987).
2.2 Agency Theory
While stakeholder theory focuses on the relationship between the firm and all its stakeholders, agency theory focuses on the relationship between the management of the firm and its owners, i.e. its shareholders, but could be extended to any principal-agent relationship.
An agency relationship arises when a contract is established between a principal and an agent, ordering the agent to carry out some services on behalf of the principal (Jensen & Meckling, 1976). In the case of a public firm, the agency relationship is between the stockholders (principals) that own the firm and management (the agent) that are employed to make decisions that maximize value for the first group. However as Berle & Means (1930) was among the first to point out, the interests of management and owners of a firm doesn’t necessarily coincide, giving rise to principal-agent problems. We may thus observe costs associated with the separation of ownership and control that characterizes a public company. Such costs are known as agency costs and consist of (1) monitoring costs and (2) residual loss (Jensen & Meckling, 1976).
Monitoring costs arises as a results of the need for the stockholder to monitor the managers of a
firm, or generally, for principals to monitor the agent. Such monitoring is undertaken as a mean for the owners to ensure that management are indeed acting with their best interest in mind. One way in which the owners of a firm can monitor the managers is the annual reports. Others include setting up budget constraint and forming a compensation policy for
management that creates incentive to act in the best interest of the shareholders, such as e.g. stock-option programs (Jensen & Meckling 1976).
7
While the publication of annual reports reduce monitoring costs (Raffournier, 1995), compensation policies may often increase them.
Residual loss is the divergence in value between the business decision that management makes,
and the business decision that would have maximized shareholder value. If management is able to maximize shareholder value, residual loss is zero. However, agency theory predicts that there will always be a divergence between the two (Jensen & Meckling, 1976) because the cost of full enforcement of contracts exceeds the benefits (Fama & Jensen, 1983).
The acknowledgement of agency theory and the existence of agency costs are important for this paper. Later on, when the firm’s ability to maximize shareholder value is examined, the reader should bear in mind that agency costs exists and may affect the firm’s ability to maximize shareholder value. Direct links between agency problems and CSR have also been suggested in other studies. Friedman (1970) for instance suggests that the mere existence of CSR practices in a firm is a sign that agency problems are present. This view is based on the notion that investment in CSR doesn’t add any value for the shareholders and in extent that CSR and ability to maximize value for shareholders are negatively correlated. McWilliams et al. (2006) presents a similar view and argues that agency theory in general suggests that CSR is a misuse of corporate resources that could have been spent on other, profit-generating projects. One of the hypotheses of this paper is that responsible firms are better at maximizing shareholder value than firm who do not engage in CSR practices. If that hypothesis holds true, it would imply that the existence of CSR practices does not constitute an agency problem since investment made in CSR would allow the firm to realize a higher risk adjusted return on its overall investments, thereby increasing value for the shareholders.
2.3 Theories of Corporate Reputations
A company´s reputation is the measure of how it’s perceived by its current and potential stakeholders. If a firm “treats” its stakeholders badly by, for instance, defaulting on their claims (be they of implicit or explicit nature) the perception of that firm among its current and potential stakeholders is likely to change for the worse – they experience a decline in reputation.
In the framework of Dowling (1986), potential stakeholders such as customers, investors or suppliers seldom have firsthand experience of any given company. Such potential stakeholders thus need to rely on corporate reputations when deciding whether they will engage in business with the company in question or not. Corporate reputations thus serve an important signaling function to potential and current stakeholders.
8
Furthermore, Fombrun & Shanley (1990) claimed that this signaling function had important applications when firms try to differentiate themselves in a competitive market. Research also suggests that firms who enjoy good reputations are able to charge premium prices for their products (Shapiro, 1983) and that they have better access to capital markets (Beatty & Ritter, 1986).
The implications for this study are of course that investments in corporate social responsibility can be viewed as investments in corporate reputation. Indeed, many studies have treated the two as being the same and used opinion surveys of corporate reputations to serve as a proxy for corporate social responsibility (Herremans et al. 1993). The first to do so was Moskowitz (1972), who rated companies based on his perceptions of their degree of social responsibility. Several subsequent studies have also employed the same methodology of using reputations to test the relationship between corporate social responsibility and financial performance (see for instance Cochran & Wood 1984, Alexander & Buchholz 1978 and McGuire et al. 1988).
Thus, there seems to be strong support in the literature for the theory that actions relating to CSR also affect the broad public notion of a company. In addition, the reputation of a company has been shown to affect the business decisions that current and potential stakeholders make vis-à-vis that company. Firms that enjoy a good reputation seem to be favored over those who do not, possible due to the differentiation effect discussed by Fombrun & Shanley (1990). In this context there are significant potential for company actions in the area of corporate social responsibility to influence their financial performance positively and increase value for its shareholders.
2.4 Q-theory of investment
The Q-theory of investment seeks to explain the investment behavior of firms with the use of Tobin’s Q (Tobin, 1969).Tobin’s Q is a financial metric which measures the ratio of the market value of assets to the replacement cost of the same assets:
(1)
Usually, the market value of installed capital is measured as the sum of the market values of equity and debt and the replacement cost of capital as the book value of assets. Thus, Tobin’s Q measures the ratio of the markets valuation of a company’s assets to the cost at which the company could replace all of its current assets with new ones, at current prices.
If market prices were solely a reflection of the value of the recorded assets of a company, Tobin’s Q would take on a value of 1.
9
If Tobin’s Q takes on a value greater than 1, the market is valuing the assets at a rate above their replacement cost implying that it believes that the firm will be able to earn a higher future return on those assets, which will increase total firm value. A Tobin’s Q of less than 1 implies the opposite, that the market believes that the firm will not be able to earn high returns on its assets in the future and that the value of the firm will decrease as a result. Tobin also suggested that the ratio had important implications for the firm’s investment decisions. If the firm should undertake more investment in capital. The logic behind this is easily seen by looking at equation (1): If Q is above one, then an investment of 1 SEK that adds to the current capital stock and thus increases the replacement cost of capital of the firm by 1 will, all else equal, increase the market value of the company by more than 1. This means that as long as a firm has a Q above 1, it will continue to invest until its Q reaches 1 at which point the firm is indifferent about investing or not investing because the increase in market value from investing is exactly the same as the cost of investing. On the opposite end, a firm which has a Q below 1 will not undertake any investments since their market value will increase by less than the amount invested.
Tobin’s Q have however been criticized as a determinant of investment. The major point being made is that Tobin’s Q is an average measure of the potential return to investment while investment decisions should in fact be based on the potential marginal returns (Gugler & Yurtoglu, 2003). Firms experiencing spells where they are able to realize a high return on investment (i.e. having a high Tobin Q) may very well be encourages to overinvest if they neglect taking into account the marginal return in their decision.
As a remedy to these problems, Gugler & Yurtoglu (2003) propose a marginal q as a determinant of investment and as a measure of firm performance.
The methodology for deriving and calculating the marginal q used in this paper was first developed by Mueller & Reardon (1993). Here, I will briefly go through the more straightforward derivation as it is outlined by Gugler et al. (2004). Starting off by noting that a firm’s investment in period t generates real cash flows equal to with present
value we have:
(2)
∑
( )If we assume capital market efficiency and thus that the market makes an unbiased estimate of the present value we can go on to state the following: If the real discount rate is the same over all time periods, the investment would have the same present value if is the pseudo-permanent return on investment.
(3)
Equation (3) implies that we can formulate a specific criteria for shareholder wealth maximization.
10
Since the firm could always increase the wealth of its shareholder by by using the funds to repurchase stock or pay them as dividends, shareholder wealth maximization requires that and thus that (Mueller & Reardon, 1993).We can now define the market value of a firm in any given year as such:
(4)
Where is the depreciation of the firms total capital stock that has taken place over the
year and is the markets error in evaluating . Substituting equation (3) into equation (4) and rearranging yields:
(5)
Given that the assumptions of market efficiency holds, ( ) . Therefore, we can set in the equation above. From equation (5) we see that the change in market value of a company is a function of the investments made times the marginal return of those investments minus the depreciation of the companies’ prior market value, plus an error term. If we divide through with we obtain the standard model used to estimate marginal q:
(6)
(
)
Qm in equation (3) and (5) is marginal q (henceforth q), the marginal rate of return on investment in relation to cost of capital. With marginal q, a firm that maximizes shareholder wealth only undertakes investments for which . Any investments for which is destruction of shareholder wealth since the firm always could have increased wealth with by using the capital available for investment to repurchase stock or pay extra dividends. This means that only firms that exhibit are fully maximizing shareholder value since they are investing up to the point where marginal return equals the cost of capital. This is illustrated in Figure 1 below.
Figure 1 has cost of capital on the vertical axis and total amount invested on the horizontal axis. In the figure, the (fictional) firm invests up until the point where its marginal return on investments equals its cost of capital, at point C. At point C, the firm thus has a marginal q of exactly 1. By looking at the areas ABC and BCDE we can see that the difference between the returns generated by investing (ABC+BCDE) and the cost of doing so (BCDE) is positive and thus that the firm enjoys a net surplus from its investment activities. It can also be seen that investing beyond the point of C will decrease that surplus, because the marginal return generated will be less than the cost of capital. It is also obvious that investing less than at point C will result in a lower surplus. Point C is thus the point of value maximization.
11
Figure 1. Shareholder value maximizing investments
As seen from figure 1 firms with are underinvesting, and could have increased shareholder value even more if they had continued to invest up to the point where . Conversely, firms that exhibit are overinvesting and are in fact destroying shareholder value by investing beyond the point where marginal return equals cost of capital. However, a point that is not visible in Figure 1 is that is preferable to . By looking at Figure 1, on might get the impression that at marginal q of let’s say 1,1 is as bad for shareholders as a q of 0,9. This is not the case. It is true that the firm that has a marginal q of 1,1 is not fully maximizing shareholder value because it could have invested more at a return above its cost of capital. A firm that has a q of 0,9 on the other hand is not maximizing shareholder value because it has invested too much. The difference is of course that the firm with a q of 1,1 have retained some extra amount of capital instead of investing it, perhaps to have it available for larger investments in the future. The firm with a q of 0,9 on the other hand have invested more and done so at a marginal rate of return below its costs of capital. It has thus destroyed shareholder value and spent money that otherwise could have been retained for future investments.
For the purposes of this study, there are a couple of advantages of using marginal q rather than Tobin´s Q or other average performance measures as a measure of firm performance. Firstly, marginal q provides a measure of the return on investment relative to the firm’s cost of capital (this is most easily seen by studying equation 3).This means that marginal q is a risk adjusted performance measure since the markets perception of the risk associated with any given company will be reflected in that firms cost of capital. The method also allows for differences in risk across firms (Gugler et al. 2004).
Secondly, the fact that marginal q measures the return on investment on the margin rather than on average which is the case for measures such as Tobin’s Q or return-on-assets (ROA)
Co st o f c ap ital, i
Shareholder value maximizing
investments
Marginal Return on Investment A B C D E12
is a great advantage. While Tobin’s Q is the market value of a firm divided by its capital stock, marginal q is the change in the market value of a firm divided by the investment that created it (Gugler et al., 2004). Lastly, Tobin Q confuses marginal and infra-marginal returns. Tobin’s Q is the average return on capital while marginal q measures the marginal return on investment. It is thus a much more straightforward way of measuring return on investment. Marginal q is also less restrictive than Tobin’s Q or ROA because it uses panel data in its estimation.
13
3 Method
3.1 Measures
3.1.2 Measure of Corporate Social Responsibility
Typically, studies of the relationship between CSR and firm financial performance make use of two different methods to measure CSR (Cochran & Wood, 1984). The first of these is to use an index on reputation. Such an index is constructed by letting knowledgeable observer’s rate firms on one or multiple areas of CSR. Obviously, this method of measurement is very subjective. It does however have the advantage of being internally consistent (Cochran & Wood, 1984) since the constructor of the index is applying the same subjective criteria to each firm in the sample. Among the early well-cited studies that use a reputational index to measure CSR are Moskowitz (1972) (who created his own), Vance (1975) and Alexander & Buchholz (1978).
The other commonly used measure of CSR is content analysis. Content analysis was first used by Bowman & Haire (1975) and basically consists of measuring the extent to which CSR-related issues are reported on. A common approach is to go through the annual reports of a set of firms and quantify what is reported in terms of CSR. One advantage of using content analysis is that it’s somewhat more objective than the reputational index. Once the criteria to look for are (subjectively) decided it is quite an objective process to measure the extent on which they are reported in the annual reports.
The measure of CSR used in this study is the Folksam index on responsible business, published semi-annually by the mutual insurance company Folksam. For the purpose of this study, annual data have been provided by Folksam. The Folksam index on responsible business (henceforth called “the index”) is calculated using a form of content analysis similar to the one discussed above. By surveying documents made public by firms the index evaluates to what extent firms have proper managerial guidance systems in place to deal with risks within the areas of environmental impact and human rights. The index covers all companies listed on the Stockholm stock exchange and each company are given two grades ranging between 0 and 7; one for their environmental work and one for their work within the area of human rights. The result is numerical data on CSR in the form of an unbalanced panel for a total of 340 companies over a period of 6 years.
14
Aside from covering a relatively large sample, the index has other advantages that make it suitable for this type of study. The criteria used for grading the companies are derived from internationally agreed guidelines and standards such as those published by the OECD and the UN, among others. These guidelines are developed through broad consultations with a wide range of stakeholders representing civil society groups, law-makers, companies and trade unions (OECD, 2011). The criteria are therefore likely to be in line with the expectations of corporate behavior held by a large number of stakeholders. Given that a low score in the index reflects a failure to meet the criteria and by extension a low level of compliance with the guidelines, low scores in the index reflects a company´s failure to meet the expectations of many of its stakeholders and should therefore, according to stakeholder theory, have a negative effect on the company. This negative effect is then expected, in line with the hypothesis of this paper, to make it harder for the firm to maximize value for its shareholders, all else equal.
An obvious criticism of content analysis is that it will be based solely on information provided by the company itself. Given that asymmetric information is prevalent, firms will have strong incentives to distort the picture of their true responsiveness to CSR-issues for the better. While this is probably true in some cases, it is hard to predict which direction, if any, the arising bias will take. Firms that in reality are performing very poorly on these issues of course have strong incentives to make themselves look good if they believe that their stakeholders are expecting it. On the other hand, firms that in reality are performing well have similar incentives, although perhaps not as strong, and may very well find themselves facing higher expectations due to prior performances. Thus it is reasonable to assume that while the firms in the index are likely to signal themselves as more responsible than they are, all firms will have
similarly strong incentives.
There is also a possibility that firms that are performing very poorly on CSR-issues simply choose not to report on it at all in their annual reports. This will however not pose a problem since firms who do not report on the issues at all receive a score of zero (the lowest possible) in the index. Firms that are performing well on CSR-issues will always have an incentive to report that, so the fact that failure to report result in a grade of zero, should not be a source of bias either.
15
3.1.3 Measure of Corporate Financial Performance
As mentioned earlier, the variety of performance measures used to gauge the impact of CSR on profitability has been vast. The most common approach however, is to use some measure of the average returns on investment for the firm such as return on assets (ROA) or return on equity (ROE). This paper partly adopts a slightly different approach by using marginal q, which measures the firms return on investment in relation to its cost of capital, on the margin. The purpose of this paper is to examine whether being perceived as socially responsible is associated with being more able to maximize shareholder wealth. In the context of stakeholder theory, the task becomes to test if firms that are servicing the implicit claims from society to conduct business in a responsible manner are better at also servicing the explicit claims of value maximization. That is, is a high degree of social responsiveness associated with a higher return on investments, measured by marginal q? To test this, marginal q will be estimated for all firms in the sample using equation (5), modified for the purpose of regression analysis and to include the measures of CSR. By doing so, an estimate of the effect of CSR on marginal q will be obtained and we can thus determine if socially responsible firms have higher q’s than less responsible ones. A positive and significant effect of CSR on marginal q would support the hypothesis that socially responsible firms are more able to maximize shareholder value than less responsible ones.
The estimation of marginal q makes use of both accounting data and market data. Thus, it is necessary for the methodology to be valid that at least the conditions for semi-strong form of market efficiency (Fama, 1970) are met. I will assume that this is the case.
To test hypothesis two, that responsible firms are more profitable in accounting terms, a more traditional approach is adopted. The measure of financial performance will then be ROA, which has been used extensively for this purpose by previous researchers3. ROA is an
accounting-based, average performance measure that gives an indication of how effectively a firm utilizes its resources. It is calculated as follows:
(7)
To test if being responsible affects ROA, a regression will be performed with the measures of CSR as the independent variables, together with commonly used control variables. The logic behind using ROA to measure performance in accounting terms is that it allows for good comparison against results obtained from using marginal q. As been shown previously, marginal q measures the marginal return on investment for the firm in market terms, whilst ROA measures the average returns in accounting returns. Looking at both marginal q and ROA essentially means looking at the same thing from two different points of view. We will thus be able to draw conclusions based on whether or not these two measures show similar results. This will be elaborated upon in section 4.
____________________
3.2 Data
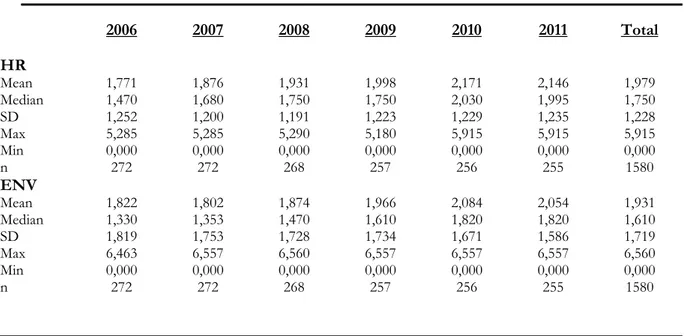
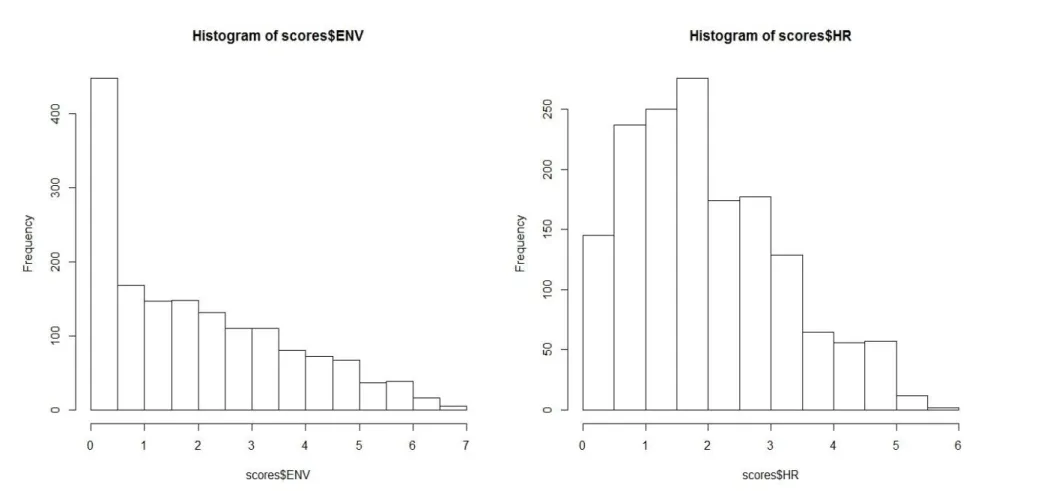
Table 1 provides descriptive statistics for the data on Corporate Social Responsibility obtained from Folksam. A couple of tendencies are directly visible when looking at Table 2. First off, the scores have generally increased over time, with few exceptions. Secondly, no firm has ever achieved the highest score in the index, and the majority of companies seems to have scores in the bottom half of the scale (less than 3,5). This suggests that the distribution of the scores might be somewhat skewed. A look at the histograms of the two variables confirms this4.
The distribution is indeed skewed to the left so that we have more observation on the bottom half of the scale than on the upper. This suggests that the mean does a poor job of representing the central tendency of the data. Therefor the median will be used as the measure of average CSR performance throughout this paper.
Table 2 – Descriptive Statistics of CSR data
2006 2007 2008 2009 2010 2011 Total HR Mean 1,771 1,876 1,931 1,998 2,171 2,146 1,979 Median 1,470 1,680 1,750 1,750 2,030 1,995 1,750 SD 1,252 1,200 1,191 1,223 1,229 1,235 1,228 Max 5,285 5,285 5,290 5,180 5,915 5,915 5,915 Min 0,000 0,000 0,000 0,000 0,000 0,000 0,000 n 272 272 268 257 256 255 1580 ENV Mean 1,822 1,802 1,874 1,966 2,084 2,054 1,931 Median 1,330 1,353 1,470 1,610 1,820 1,820 1,610 SD 1,819 1,753 1,728 1,734 1,671 1,586 1,719 Max 6,463 6,557 6,560 6,557 6,557 6,557 6,560 Min 0,000 0,000 0,000 0,000 0,000 0,000 0,000 n 272 272 268 257 256 255 1580
Notes: HR refers to the score given to a company for their work within the area of human rights. ENV refers to the score given to a company for their environmental work.
Another possibly interesting issue is firm size. It is reasonable to assume that the benefits of being perceived as more socially responsible is greater for firms that are closely monitored and have a well-established brand with the public. Such firms are often large. These firms often have a reputation to care for and being perceived as socially irresponsible may inflict damage on that reputation. That creates an incentive for the company to make sure that it is perceived as responsible.
____________________
17
Furthermore, engaging in CSR-related issues and maintaining a good reputation are associated with at least some initial costs. Larger, more mature firms are more likely to have already borne those costs or at least to be able to afford them within a foreseeable future.
All in all large firms seem more likely to report on CSR-issues and more eager to be perceived as responsible. This may have implications for our study: If larger firms systematically have higher scores we will have to take that into account when constructing our model. Looking at the data, this is confirmed.
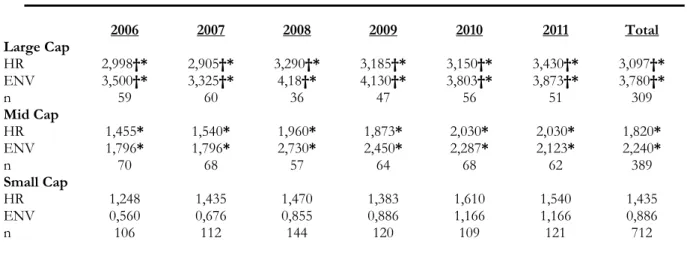
Table 3 below gives the median CSR-scores for the companies that belong to each of the three lists that make up the Stockholm Stock Exchange; Large Cap companies (companies with a market capitalization above 1 billion euros), Mid Cap companies (companies with a market capitalization between 150 million and 1 billion euros) and Small Cap companies (companies with a market capitalization below 150 million euros).
Given the skewness of the data the Mann-Whitney U-Test5 (Mann & Whitney, 1947) is used
to calculate whether or not the medians are significantly different from each other.
Table 3 – Median CSR-Scores by market capitalization
2006 2007 2008 2009 2010 2011 Total Large Cap HR 2,998†* 2,905†* 3,290†* 3,185†* 3,150†* 3,430†* 3,097†* ENV 3,500†* 3,325†* 4,18†* 4,130†* 3,803†* 3,873†* 3,780†* n 59 60 36 47 56 51 309 Mid Cap HR 1,455* 1,540* 1,960* 1,873* 2,030* 2,030* 1,820* ENV 1,796* 1,796* 2,730* 2,450* 2,287* 2,123* 2,240* n 70 68 57 64 68 62 389 Small Cap HR 1,248 1,435 1,470 1,383 1,610 1,540 1,435 ENV 0,560 0,676 0,855 0,886 1,166 1,166 0,886 n 106 112 144 120 109 121 712
Notes: †: Significantly different from mid cap companies at the 95% level. * Significantly different from small cap companies at the 95% level. Statistical differences are tested for significance using the Mann-Whitney U-Test.
____________________
18
As seen, the difference in median between the different size-classifications is statistically significant in every year. This implies that larger firms are being perceived as more responsible than smaller firms. This will be important to bear in mind later on when we are estimating the effects of being responsible on financial performance.
When it comes to our two different measures of financial performance all data used are obtained from company records using Datastream. Data are obtained for the years 2005-2011.
3.3 The Model
This study treats CSR as an investment in company reputation and tries to gauge the effect of it on the firm’s current ability to maximize shareholder value. What we are studying is if previous and current investment in CSR affects the marginal return on the firm’s investments as a whole? We are also testing if CSR have any effect on accounting profitability.
To test the relationship between corporate social responsibility, measured as the CSR-Score given in the Folksam index on sustainable business (the index), and the firm’s ability to maximize shareholder value measured by marginal q, regression (8) below is ran. Regression (8) is simply equation (6) with an interaction term for CSR and control variables included. All variables are divided by in accordance with Gugler et al. (2004). For the relationship
between CSR and financial performance in accounting terms, regression (9) will be employed. Regression (9) contains, apart from ROA and CSR-Scores, control variables commonly used (Beta and Debt) when estimating ROA.
(8)
( ) ( )
(9)
Where;
is the market value of the firm
is the depreciation rate of capital for the firm (and the intercept of regression (7)) is the total amount of funds available for investment
is a measure of the firms level of social responsibility, here denoted as HR for human rights score and ENV for environmental score
is an error term which is assumed to be normally distributed with mean 0 and variance . is return on assets, calculated as in (7)
19 is the intercept of regression (8)
is the Beta of the firm
is the ratio of the firms debt to its total book value (debt-to-value ratio)
is a dummy variable that takes on a value of 1 if the firm belonged to the large cap
segment on the Stockholm Stock Exchange in the given year, and 0 otherwise.
is a dummy variable that takes on a value of 1 if the firm belonged to the small cap
segment on the Stockholm Stock Exchange in the given year, and 0 otherwise. The market value of the firm is calculated as follows:
(10) ( ) So that the market value represents the sum of the market value of equity and the book value of debt (book value of debt is used as a proxy for market value of debt).
Total funds available for investment are calculated (in accordance with Mueller & Reardon (1993)) as follows:
(11)
Here, debt is yet again calculated as the difference between total assets and book value of equity. Mueller & Reardon’s (1993) original formula contained advertising expenditures which have been excluded in this paper due to lack of data.
Earlier in this paper I discussed the fact that CSR-Scores tends to vary with firm size. More specifically, it was showed that the median CSR-Scores of firms were significantly different between large, medium sized and small firms. If firm size also is correlated with the change in market value and ROA, our dependent variables, our estimates might be biased by the fact that we have omitted firm size from the model. To prohibit this and to account for the fact that CSR-Scores systematically varies across the size-segments two dummy variables are included in the regressions. One dummy is included for Large Cap companies and one for Small Cap companies making Mid Cap firms the baseline size in the regression. Some readers may wonder why the dummy variables aren’t allowed to interact with the investment ratio in a fashion similar to the variables measuring CSR. Doing so would possibly have yielded interesting results such as estimates of the effect of size on marginal q. When this approach was tested however, interacting the dummy variables with the investment ratio gave rise to severe statistical difficulties such as multicollinearity, making interpretation very difficult. As such, I choose to use dummy variables in their “original form”.
20
In the case of regression (9) it is also plausible to believe that ROA varies significantly across industries due to factors such as capital needs and profit margins. Some industries may therefore be able to consistently exhibit higher ROAs. Therefore, that model must take industry effects into account. To achieve that purpose, a fixed-effects model using industry specific fixed effects is employed for regression (9).
The regression model outlined in equation (8) will tell us several things. Firstly, the intercept would normally provide us with an estimate of the depreciation rate of capital for the companies in the sample, plus the systemic change in market valuation. However, since we have introduced dummy variables in the regression this is not entirely true anymore. By having one dummy for Large Cap firms and one for Small Cap firms we are effectively making Mid Cap firms our “base-line”. This means that the intercept term will, apart from estimating the depreciation rate and systemic change in market valuation, also estimate an effect related to being a mid-sized firm. Normally, one would expect the intercept term to take on a negative sign, but since being mid-sized may very well have a positive effect on the change in market value; it may take on a positive sign. However, this estimate is not really of interest for the purposes of this study.
Secondly, it will provide us with an estimate of marginal q. It will do so by first estimating which will tell us the effect of one additional unit of investment on the change in market value, which is the definition of marginal q as it is formulated by Gugler et al. (2004). However, this is only a partial estimate of marginal q. With the inclusion of the third term in (8) I aim to bring in the effect of the firm´s human rights and environmental scores into the model. Since I am looking to estimate the effect of being perceived as responsible within both fields, the intuitive way would be to include the scores in both areas as interaction terms in (8). There is however reason to suspect that the CSR-Scores on human rights and environmental work may be correlated with each other. Table 2 seems to support this suspicion; if the average score on human rights is high, the average score on environmental work is high as well, and vice versa. Scores also seem to co-vary across time. That means that we may encounter a multicollinearity problem if we include both CSR-variables in the regression. To test if multicollinearity is present in the data, the variance-inflating factor (VIF) is calculated for each of the explanatory variables. VIF is calculated by regressing each of the explanatory variables on each other. From these regressions the R2 is obtained and VIF is the calculated
as:
(12) ( )
As can be seen from (12), the VIF has a minimum value of 1, which it will take on if R2 is
zero. Therefore, a VIF of 1 implies that there is no correlation what so ever between the explanatory variable of interest and the other explanatory variables. As R2 increase, implying a
higher degree of correlation among the explanatory variables, the VIF increases into infinity. Generally, a is considered to imply problems relating to multicollinearity (Aczel & Sounderpandian, 2008) but higher cut off values such as has been proposed.
21
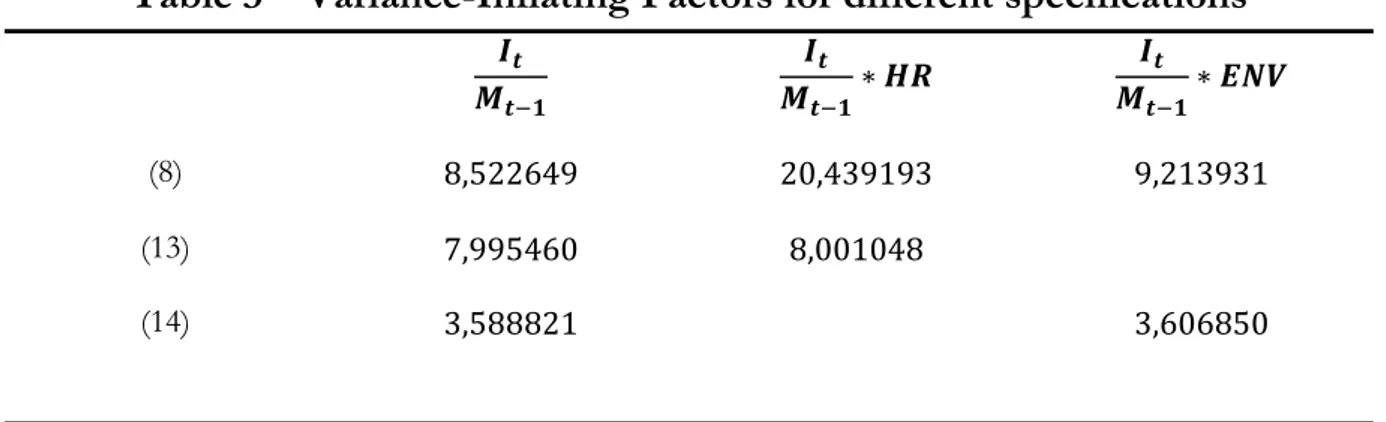
The VIFs for our explanatory variables are indeed high, ranging between 8,5 and 20, indicating that multicollinearity is indeed present in regression (8). The VIFs for regression (9) did not indicate a multicollinearity problem. If we were to run regression (8) in its current form, we would thus risk estimating statistically insignificant (low t-ratios) coefficients, where they in fact should be significant (Gujarati & Porter, 2008).
To remedy this, I consider estimating two separate regression models for the estimation of marginal q with one CSR-variable in each so that the variable is the score on human rights (13) and the score on environmental work (14), respectively:
(13)
( )
and
(14)
( )
By doing this, the multicollinearity arising from the correlation between the two CSR-variables will be removed. Looking at the VIFs for model (12) and (13) we can see that they have decreased significantly compared to (7):
Table 3 – Variance-Inflating Factors for different specifications
Notes: VIF-values for the Dummy Variables are excluded from this table. They were however low, with the highest value at 1,43.
Thus, the method for estimating the effect of being perceived as socially responsible on the ability to maximize shareholder wealth will be to perform two separate regressions, (13) and (14), for each of the measures on social responsibility. Even though no multicollinearity problem was detected in the regression estimating the effect on ROA, I will still chose to estimate two separate regressions there as well, with one measure of CSR in each. This will make comparison between the results easier later on.
In the case of the estimation of marginal q this methodology will mean that will give us an estimate of marginal q for a firm that has a score of zero (the lowest score possible in the index) on both human rights and environmental work. is thus the marginal q for a firm that is perceived as socially irresponsible (or just negligent to the issue as a whole) by the
(8)
(13)
22
index’s standards. will then give us estimates of the impact that the CSR-score on human rights and environmental work respectively has on a firm´s marginal q. A positive and significant estimate of would imply that firms that are perceived as socially responsible exhibit higher returns on investment and thus, that they are better at maximizing shareholder wealth than their irresponsible (or negligent) counterparts.
Such a finding would support hypothesis 1 of this paper. The marginal q estimated in our model will thus be given by the following formula:
(15)
Why this is the case is easily understood by looking at equation (8). Since the two explanatory variables are exactly the same with the exception that the second term are multiplied with the firms CSR-Score, the only source of additional variance introduced into the model by adding the second term are coming from the variance in CSR-Scores. Thus, all the explanatory power that is attributable only to the term
will be contained in and the explanatory power of
perceived social responsibility´s effect on market value will be contained in .
The interpretation of the regressions estimating the effect on ROA is very straightforward. The variables of interest are the coefficients on the two measures of CSR, and the remaining variables are included as controls. Positive and significant estimates of the coefficients for the CSR variables would support hypothesis 2 of this paper that responsible firms perform better in accounting terms.
23
3.4 Estimation Technique
The regression technique for the estimation of marginal q will be a pooled OLS regression. A fixed-effects regression technique was considered to account for the fact that there may exist some firm and/or time specific effects other than investment (and that is uncorrelated with the
level of investment) that are affecting the market value of a firm. Fixed effects have been
introduced in models trying to assess the relationship between CSR and financial performance before. In a recent study, Nelling & Webb (2009) used fixed-effects techniques to reject the hypothesis that such a relationship existed and attributed previous contradicting results to problems arising from not taking fixed effects into account. In the case of this study however, the models using firm, time and two-ways (both time and firm specific effects) fixed effects did not provide a different result than the pooled OLS technique. In addition to that, all models making use of fixed effects showed lower values for adjusted , implying that introducing fixed effects did not improve the model. It thus seems reasonable to assume that the relationship between investment, CSR and market value is relatively constant across both firms and time (at least in the case of our 6 year sample) and we may thus proceed with the estimation using a pooled OLS panel data regression technique. The interested reader may consult Table 8 in appendix for the estimated coefficients and adjusted s for all four regression techniques.
The model that tries to estimates the relationship between CSR and accounting profitability makes use of industry-specific fixed effects to account for the fact that ROA may vary systematically across industries because of e.g. profit margins, competiveness and capital requirements. A Hausman test6 (Hausman, 1978) was used to test if a random effects model
was more appropriate. The result indicated that random effects indeed were preferable but employing such effects did not alter the results significantly. The result from both regression techniques are given in the following chapter.
____________________
24
4 Empirical Results
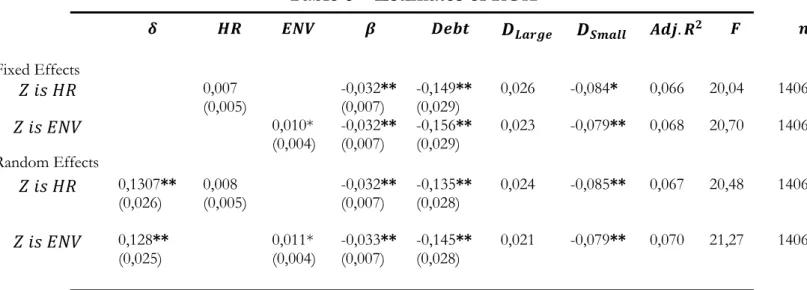
The results are summarized in table 5 and 6 below:
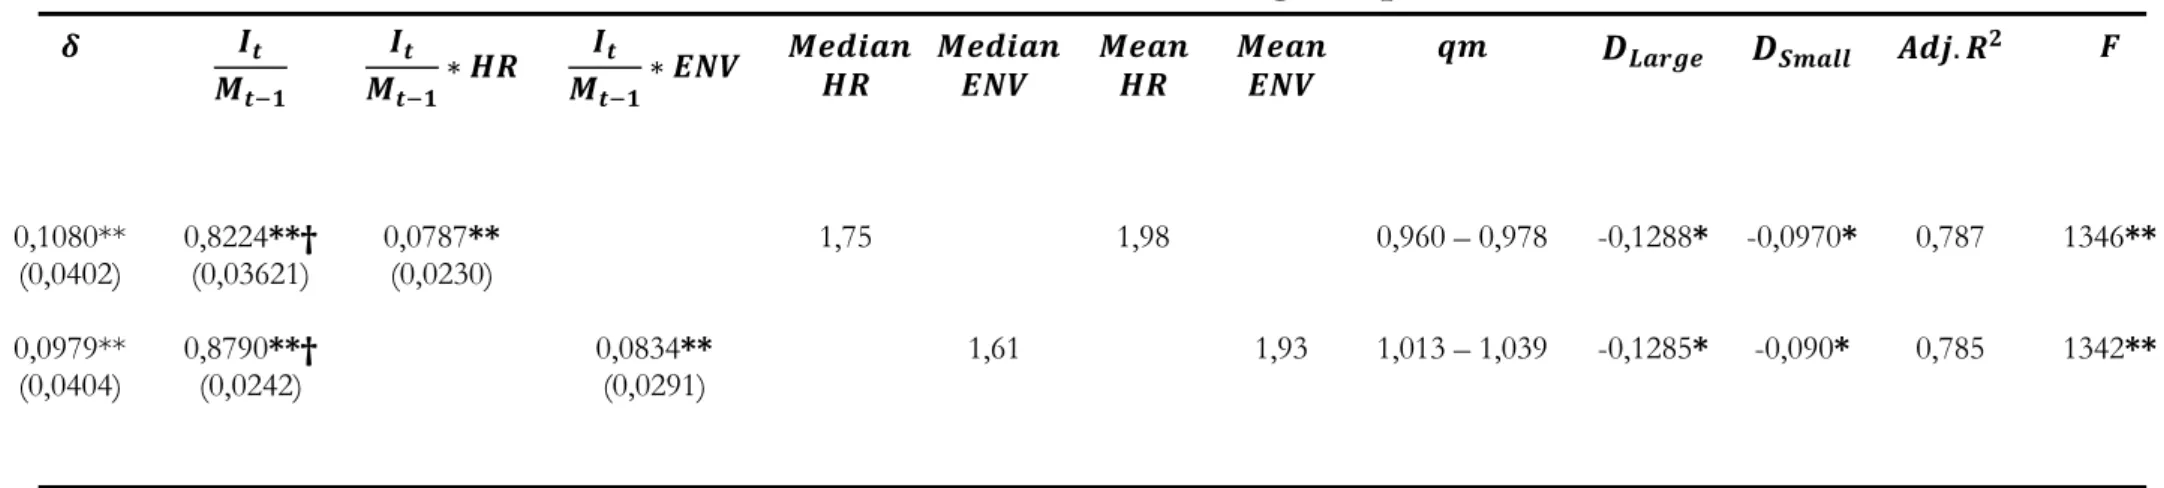
Table 5 – Estimates of marginal q
Notes: *: Statistically significant at the 5% level. **: Statistically significant at the 1% level. †: Significantly different from 1 at the 5% level. Marginal q is calculated using the
formula given in (15) where Z is the median and mean CSR-Scores, respectively.
Model (13) 0,1080** (0,0402) 0,8224**† (0,03621) 0,0787** (0,0230) 1,75 1,98 0,960 – 0,978 -0,1288* -0,0970* 0,787 1346** 1453 (14) 0,0979** (0,0404) 0,8790**† (0,0242) 0,0834** (0,0291) 1,61 1,93 1,013 – 1,039 -0,1285* -0,090* 0,785 1342** 1453
25
Table 6 – Estimates of ROA
Notes: *: Statistically significant at the 5% level. **: Statistically significant at the 1% level. Fixed effects are
industry specific and estimated using the within-group (WG) estimator.
Recall equation (15):
(15)
This means that our estimates for marginal q for a firm that has a CSR-Score of zero is 0,8224 (13) and 0,879 (14). Remembering that a firm maximizes shareholder wealth if and that
(3)
It follows that and consequently that for a firm that maximizes shareholder wealth. In our case however (statistically significant at the 5% level) implying that in general, firms that were listed on the Stockholm stock exchange during the period 2006-2011 and who were perceived to have a very low level of social responsibility were unableto maximize wealth for their shareholders. More specifically, firms with a very low level of social responsibility are overinvesting, either by committing themselves to too many investment projects or by choosing projects that produce an insufficient return.
The finding that firms in general are unable to invest a level that maximizes shareholder wealth is consistent with the original findings of Mueller & Reardon (1991) and with those of Gugler et al. (2004)7. It is also consistent with agency theory which predicts that the presence
of agency costs may prevent a public firm from fully maximizing shareholder value. ____________________
7. Gugler et.al. (2004) estimated a marginal q of 0,65 for the Swedish market, well below the condition for
shareholder wealth maximization.
Fixed Effects 0,007 (0,005) -0,032** (0,007) -0,149** (0,029) 0,026 -0,084* 0,066 20,04 1406 0,010* (0,004) -0,032** (0,007) -0,156** (0,029) 0,023 -0,079** 0,068 20,70 1406 Random Effects 0,1307** (0,026) 0,008 (0,005) -0,032** (0,007) -0,135** (0,028) 0,024 -0,085** 0,067 20,48 1406 0,128** (0,025) 0,011* (0,004) -0,033** (0,007) -0,145** (0,028) 0,021 -0,079** 0,070 21,27 1406
26
The intercepts are positive and significant in both models estimating marginal q implying that no erosion of firm’s capital stock took place over the sample period. On the contrary, the firm’s capital stock seems to have appreciated over the sampling period. However, since we have introduced dummies into the regressions, the intercept term contains both an estimate of the depreciation rate of capital and of the effect of being a mid-sized firm. In this case, there seems to be a positive effect associated with being a mid-sized firm that dominates the depreciation effect, although we cannot be sure. However, since neither the depreciation rate nor the estimates of size effects are of particular interest for this study, no further attention will be paid to that issue.
The estimates for is positive and statistically significant at the 1% level of confidence for both measures of CSR in regressions (13) and (14
).
This implies that being perceived by the market as socially responsible within the fields of human rights and environmental work is associated with a higher marginal return on investment and thus with a greater ability tomaximize shareholder wealth.
The 7th column of table 5 shows the range of estimates of marginal q calculated using
equation (14), when is the median and mean CSR-Scores within respective fields. As seen, firms that hold the median and/or means score in the index have an estimated marginal q very close to 1, our condition for wealth-maximization. Indeed, a test for statistically significant difference from 1 reveals that the estimates for marginal q are not significantly different from 1.Together with the fact that firms who exhibit a score of zero have marginal q’s that are significantly below 1, this means that while firms with very low scores are unable to maximize shareholder value, firms with an average score are able to so.
Table 6 indicates that being perceived as socially responsible within the field of human rights have no significant impact on financial performance measured by ROA whilst being perceived as responsible within the field of environmental work has. This means that although firms with high scores on human rights exhibit higher marginal returns on investment using market based measures, they do not exhibit higher average returns using accounting based measures. When it comes to environmental work however, firms with high scores exhibit both higher marginal and average returns.
For the analysis of these results we should first recall what the index on responsible business actually measures. As is laid out in the “Method” chapter it aims to quantify “…to what extent the firm has proper managerial guidance systems in place to deal with risks within the areas of environmental impact and human rights”. This means that firms that have extensive managerial guidance systems that are compliant with international standards are the ones that will obtain the highest scores. The keyword here is “managerial”. CSR is an issue for management, as is investment decisions. Some researchers have suggested that the process of building the rigid managerial guidance systems required to obtain a high CSR-Score can help managers develop other competencies such as better scanning skills, processes and information systems (Orlitzky et al., 2003). These management skills that are acquired thru an internal process (Orlitzky et al., 2003) could then lead to the ability to better utilize resources thru increased productivity (Majumbar & Marcus, 2001). If this is the case, CSR would have an important signaling function as an indication of high managerial competence, which has
27
been suggested by McWilliams et al. (2006). If CSR signals managerial competence, markets may perceive the actions of managers of responsible firms to be better than actions of managers for less responsible firms. In such a scenario, the market may “reward” the investment decision of a responsible firm with a larger increase in market value then if the firm had been less responsible because it assumes by default that the managers of the more responsible firm are more capable of making investment decisions that generate high future returns. Responsible firms would then exhibit a higher marginal return on investment because of the markets perception of its managers. The existence of such a signaling effect could also explain why the evidence in favor of CSR-related activities are stronger when looking at market based performance measures than accounting based ones. If markets do indeed perceive managers of socially responsible firms as more competent and reward their investment decisions with a larger increase in market value than if the firm had been perceived as less responsible that effectively means that they are valuing the future prospects of responsible firms higher than those of less responsible firms. This is regardless of the accounting profits made by the firm today. If so, it is certainly possible that an increase in the level of CSR of a firm would lead to an increase in market value (and a higher marginal q) but not necessarily to higher accounting profits such as ROA.
Another possible explanation for the positive effect of CSR on marginal q is that responsible firms simply make better investment decisions. For instance, a firm who maintain good working conditions in their factories may enjoy increased worker productivity which would increase the possibility of earning a high return on the investments made in those factories. A similar case could be made for firms who take environmental responsibility by e.g. reducing pollution from a factory: Such work could lead to reduced energy costs for the factory, thereby increasing the possibility of earning a high return on the investments made in that factory. If this is the case however, we should be able to observe a positive relationship between CSR and financial performance not only when looking at marginal q but also when looking at ROA. That is, the returns to being perceived as responsible should show up not only in the markets judgment of the company’s prospects, but also in the company’s books. Table 6 however gave us very weak evidence in favor of this theory. A weak positive relationship seems to exist between a firm’s environmental score and ROA, but no relationship was found when it comes to human rights. This gives some credence to the idea that taking environmental responsibility, for instance by reducing pollution, may lead to higher profitability through e.g. a reduction in energy costs. The same case however cannot be made for human rights and e.g. working conditions.
Apart from the theory that CSR has a signaling function towards the market which allows responsible firms to realize higher returns in market terms, there are several other potential reasons for the discrepancy between the results of market and accounting based measures.