Visualizing cadastral parcels for
surveyors using handheld
Augmented Reality
Linus Håkansson
Computer Science
Bachelor of Science in Computer Science with specialization in Computer
Application Development, 180 credits
15 credits
2019-06-03
Supervisor: Thomas Pederson and Fredrik Rutz
Examiner: Jose Maria Font Fernandez
Abstract
The purpose of this study consists of gaining an understanding about Augmented Reality (AR) and if this technology can help land-surveyors to visualize cadastral parcels using an iOS app. In addition, the app is also used to get insights of what it takes for an AR system to replace 2D paper maps completely. In land-surveyors daily work, they usually bring annotated 2D paper maps to locate their assets when they do field work. However, the 2D paper map can be cumbersome to use because the map visualizes assets in 2D while the working environment for land-surveyors is in 3D. Therefore, this study presents an AR app that can visualize cadastral parcels in 3D in collaboration with a company called InfoTrader. This dissertation utilizes a qualitative methodology with a design and creation strategy as well as semi-structured interviews. To get feedback and evaluate the proposed app it was tested with professionals with experience in the land-surveying business. The findings from testing the app indicated that the app could be very useful in different scenarios. Nevertheless, to completely replace the 2D paper map, the AR system should integrate all the layers of information that the 2D map provides.
Keywords
Augmented Reality, land-surveying, geographic information system, location-based services, handheld
Table of Contents
1 INTRODUCTION ... 1 1.1 BACKGROUND ... 1 1.2 PROBLEM DEFINITION ... 2 1.3 PURPOSE ... 2 1.4 LIMITATIONS ... 3 2 RELATED WORK ... 42.1 RELEVANT CONCEPTS OF INTEREST ... 4
2.2 AUGMENTED REALITY ... 4
2.2.1 Mixed Reality... 5
2.3 LOCATION-BASED SERVICES ... 6
2.4 GEOGRAPHIC INFORMATION SYSTEM ... 6
2.5 PLATFORMS FOR AUGMENTED REALITY ... 7
2.5.1 Head-mounted displays ... 7
2.5.2 Smartphones and tablets ... 7
2.6 RELATED APPLICATIONS ... 7
2.7 SYSTEMS COMPARISON ... 9
3 METHOD ... 10
3.1 COURSE OF ACTION ... 10
3.2 RESEARCH STRATEGY ... 10
3.2.1 Design and creation ... 10
3.2.2 The role ... 11
3.3 THE DESIGN AND CREATION PROCESS ... 12
3.4 DATA COLLECTION... 13
3.4.1 Interviews ... 13
3.5 THEMATIC ANALYSIS ... 15
4 DESIGN AND IMPLEMENTATION... 16
4.1 SYSTEM ARCHITECTURE ... 16
4.2 HARDWARE AND SOFTWARE ... 17
4.3 FILTERING OF GPS LOCATIONS ... 17
4.4 TRANSFORMING 2D COORDINATES ... 18
4.5 CADASTRAL PARCEL VISUALIZATION ... 19
4.5.1 First version of the iterative design process ... 20
4.5.2 Second version of the iterative design process ... 21
5 EVALUATION ... 22
5.1 USER TESTS ... 22
5.2 RESULT ... 23
5.2.1 Augmented Reality experience ... 24
5.2.2 Usability of Augmented Reality in land-surveying ... 24
5.2.3 Augmented Reality versus 2D map ... 25
5.2.4 Precision ... 25
5.2.5 Additional functionality... 26
6 DISCUSSION ... 27
6.1 VISUALIZATION OF CADASTRAL PARCELS USING AR ... 27
6.2 REPLACEMENT OF THE 2D PAPER MAP ... 28
6.4 LIMITATIONS WITH THE STUDY ... 29
7 CONCLUSION AND FUTURE WORK... 30
REFERENCES ... 31
APPENDIX A: INTERVIEW GUIDE... 34
1
Introduction
In this chapter the background and the problematization around the gap between the available technology that can be brought on field for land-surveyors is described. The problematization leads to the purpose of this thesis and the research questions.
1.1
Background
Land-surveyors usually make use of tools like GPS receivers, 3D scanners and Geographic Information Systems (GIS) in their daily work. These tools help land-surveyors increase productivity, efficiency and accuracy in their daily work. Furthermore, these tools enable land-surveyors to determine positions of Points of Interest (POI) by measuring distances and angles between them (Pena-Rios et al. 2018). Moreover, utility companies rely on GIS to maintain or manage their assets on field (Schall et al. 2009). Field workers usually make use of the established way to bring plotted 2D paper maps to the field in order to maintain or locate their assets. Other field workers bring laptops to be able to consult the underlying GIS for improved productivity (Schall et al. 2009). However, Schall, Zollman and Reitmayr (2013) discovered that there is a gap between the available technology for office desktops and for devices that could be brought on field regarding GIS. With an improvement of the available technology while doing field work, would result in higher productivity and more savings for the utility sector (Schall, Zollman & Reitmayr, 2013).
Furthermore, to be classified as a GIS it has to be a system that captures, stores, analyzes, and presents data that are bound to some location. In addition, GIS is a system that combines cartography, statistical analysis and database technology in order to be used in fields like land surveying and public utility management (Dawsen, 2011). Moreover, according to Pena-Rios et al. (2018) GIS aims more to handle the data and the author expresses that there is a need for a visualization of the 3D data in a representable way other than already existing 2D paper maps. In addition to this, Schall et al. (2009) mention a particular problem that builds on the same concern that Pena-Rios et al. (2018) brought up. This particular problem arises when using 2D paper maps, the land-surveyor needs to make an accurate judgement from the 2D paper map and a GPS location (Schall et al. 2009). The land-surveyor needs to apply a mental transformation from the 2D map into reality. Moreover, Schall et al. (2009) argues that the land-surveyor must be familiar with map scales, generalization and symbol language in order to be able to make the transformation. Such mental skill should not be taken for granted (Schall et al. 2009).
To approach the highlighted problem above, Pena-Rios et al. (2018) believe that two visualization techniques, Augmented Reality (AR) and Virtual Reality (VR), can help to visualize 3D data stored in GIS in an effective way. Furthermore, Virtual Reality is a visualization technology where the user is completely surrounded by a computer-created virtual world and thus cannot percept changes in the real world environment. In addition, a variation of VR is AR where both virtual- and real world objects coexist in the same environment (Hincapie et al. 2011). Hence, AR technology enhances the
real world and should be considered a natural way to explore 3D objects (Capece, Agiatello & Erra, 2016). According to Cheng et al. (2011) will AR be an important
Human Computer interface (HCI) due to the fact AR enables people to interact with
the world. One thing in particular that is highlighted by Cheng et al. (2011), is that smartphones could become a suitable AR platform for AR applications since many smartphone devices furfill the requirements of beeing an AR device. Since most smartphones nowadays are delivered with hardware components as Geographic Position System (GPS) reciever, accelerometer, gyroscope, powerful processors, touch-screen and wireless communication interface the requirements are met (Cheng et al. 2011; Kurkovsky et al. 2012).
Duties that land-surveyors have in their daily work tasks includes measuring angles and positions of points on the ground. These points often form some sort of boundary which the land-surveyor carfully delineates (Carpentier, 2018). In addition to the above mentioned, one could argue that cadastral parcels belong to such boundaries which could be seen as imaginary lines that subdivide land and hence, is not visible for the human eye. The expression cadastral parcels can be defined further as “cadastral parcel should be considered as a single area of Earth surface, under
homogeneous real property rights and unique ownership” (European Commission,
2019). Several efforts has been made using AR in field work, trying to visualize things that are hidden for the human eye (Schall et al. 2009; Schall et al. 2013; Pena-Rios et al. 2018). Hence, to the best of my knowledge there does not exist any system trying to visualize cadastral parcels using handheld Augmented Reality.
1.2
Problem definition
As being highlighted under the background section, there is a need for better visualization techniques on field for land-surveyors. As for today, field workers usually bring annotated 2D maps with them even though a mental transformation has to be done, which can be cumbersome. Pena-Rios et al. (2018) believe that Augmented Reality is the right way to approach this problem. Therefore, this thesis will investigate the following research questions:
• RQ1: To what extent can cadastral parcel visualization using Augmented Reality be useful for land-surveyors?
• RQ2: How can the 2D map be replaced using Augmented Reality?
1.3
Purpose
The aim of this study is two folded. First, to gain an understanding about AR and to what extent this technology can visualize cadastral parcels for land-surveyors. In
addition, this study seeks to get insights of how the 2D paper map can be replaced using AR. The first aim is more academic and hope to contribute to the academic research with more insights regarding the subject as well as strengthen previous research. The second aim is to develop an AR prototype app for iOS that can be used by the company this thesis is written for. Since the company has customers within the field of land-surveying this is the objectives of this dissertation and the two RQs will be answered by insights from interviews as well as the developed prototype.
1.4
Limitations
Limitations of this study has been set at only evaluating the augmentation of cadastral parcels in terms of visualization and its usefulness for land-surveyors. Other measurements such as how well the cadastral parcel outlines in AR compared to the physical boundary is beyond the scope of this study.
2
Related work
Relevant concepts as Augmented Reality, Location-based systems and Geographical Information Systems will be explained and defined in this section as well as related applications. Under the related application section, applications that makes use of AR, LBS and GIS are discussed. Furthermore, a table is presented at the end of this chapter to visualize similarities and differences between the applications discussed under the related applications section.
2.1
Relevant concepts of interest
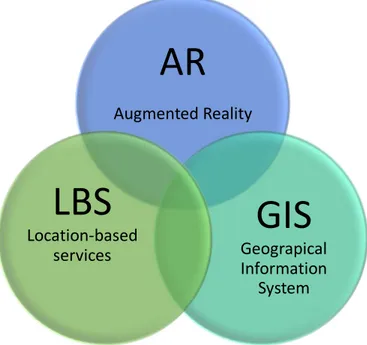
Relevant concepts of interest in this thesis are visualized in Figure 2.1 below. The artefact that will be developed in order to be able to collect relevant data to answer the research questions will use these three concepts in its implementation. Therefore, the artefact having the hopes to fit in the overlapping gap of these concepts. Furthermore, every concept is defined under its subsection later in this chapter.
Figure 2.1 Relevant concepts of interest
2.2
Augmented Reality
Although the concept of Augmented Reality could be seen as a new technology to some people, the concept has its roots back in the 90s. Caudell and Mizell (1992) where the two researchers who first coined the term. In the researchers’ paper, they presented a design and an artefact of a system that made use of Augmented Reality. The hardware consisted of see-through goggles which would support aircraft manufacturing workers while assembling the aircraft. With these goggles, things like
AR
Augmented Reality
GIS
Geograpical
Information
System
LBS
Location-based
services
errors while assembling would be eliminated (Caudell & Mizell, 1992). Caudell and Mizell (1992) did not only coin the term AR, also gave Virtual Reality its name. Furthermore, to distinguish between AR and VR, one could think of VR having more complexity regarding graphical objects because VR systems need to generate graphics for every pixel the user sees (Caudell & Mizell, 1992).
In early days of AR some researchers only thought of AR as being visualized with the use of head-mounted displays (Milgram et al. 1994). However, Milgram et al. (1994) did not agree with that definition. They came up with two different categories of AR displays:
• See-through • Monitor-based
In this definition, see-through still refers to head-mounted displays. The difference in this categorization is the second proposition (Milgram et al. 1994). According to Milgram et al. (1994) the monitor-based AR display is non-immersive where computer generated graphics are overlaid onto live video images instead. One could argue that the latter technique is used in today’s smartphones while using AR in such apps. Furthermore, Azuma (1997) also noticed that many researchers limit the AR technology to that such systems must involve some type of head-mounted displays. However, Azuma (1997) suggested that the technology should not only be limited to head-mounted displays. Instead, Azuma (1997) argues that any system that has the following three characteristics could be defined as an AR system:
• Combines real and virtual • Is interactive in real time
• Is registered in three dimensions
2.2.1 Mixed Reality
Milgram et al. (1994) discovered that the term Augmented Reality started to appear in the literature. However, the researchers noticed that there was not a consistent definition. Milgram et al. (1994) came up with the continuum below to deal with this uncertainty (see Figure 2.2). In the continuum the term Mixed Reality is the larger class and the more generic form when addressing AR and VR (Milgram et al. 1994).
2.3
Location-based services
When talking about location-based services (LBS) one refers to systems which are using the current GPS position of a smartphone or another device, in order to show relative information (Aydin et al. 2013). In order to track the position of the device relative to the real world, the GPS of the smartphone is used. When an accurate position has been obtained from the smartphone, the position can then be used to query some server for any nearby points-of-interest (Aydin et al. 2013). Furthermore, a location-based service can be classified into two types of application design when it comes to fetching POIs from a server, for instance. The system can either make use of push service or pull service (Aydin et al. 2013). Furthermore, Aydin et al. (2013) explain that the difference between the two types are that when using push service, relevant geolocation information is sent to the user whether or not the user is making an explicit request for it. On the other hand, the pull service is used when the user makes an implicit request.
Furthermore, Capece, Agiatello and Erra (2016) explain that Points of Interest (POI) represents a georeferenced location in the real world. These POIs could for instance be a shop, a restaurant or some other interesting location for the user depending on the context (Capece, Agiatello & Erra, 2016).
2.4
Geographic Information System
Geographic Information Systems are widely used in many areas such as architecture, environmental planning, health care, real estate and more (Dawsen, 2011). Moreover, it is a computer-based system for integration and analyses of geographic data (Cromley & McLafferty, 2012). The data that is kept in the system is a result of an observation and measurement of earth phenomena where the data is referring to some location on earth. According to Cromley and McLafferty (2012) the term GIS refers to the technology itself, whereas “GI science” refers to the theory of spatial analysis and cartography. Cromley and McLafferty (2012) mention that GIS has the following software functions:
• Display and store spatial relationships between objects • Store many attributes of an object
• Retrieving and managing data
• Integration of spatial data from different sources.
One important feature that the GIS has is the ability to store and manage spatial data (Cromley & McLafferty, 2012). Additionally, the stored data could be objects represented as points, lines and polygons. Cromley and McLafferty (2012) explain the difference between these three representations. Firstly, oints could be viewed as zero-dimensional since it contains a location on earth but no size. Secondly, lines could be viewed as one-dimensional since it has a length but no specific width. Lastly, polygons could be viewed as an enclosing space and therefore is two-dimensional (Cromley & McLafferty, 2012).
2.5
Platforms for Augmented Reality
As mentioned in the background section, land-surveying involves knowing boundaries of subdivided land. Since Augmented Reality can be used to visualize such boundaries one need to argue for a suitable platform. As mentioned before, there exist two types of displays that is used for augmenting (Milgram et al. 1994). Three such hardware platforms that fit under monitor-based- and see-through displays are head-mounted display, tablets and smartphones.
2.5.1 Head-mounted displays
One of the aforementioned platforms is Microsoft HoloLens which belongs to see-through head-mounted displays (Microsoft, 2019). This device consists of the necessary sensors to create an augmented experience. One key feature that Microsoft Hololens has compared to other platforms is that it provides hands-free interaction. Not only because it is mounted on the head of the user, but also since it has both hand-tracking and voice recognition as sources for input (Microsoft, 2019). This possibility is clearly an advantage compared to what the other handheld devices like smartphones and tablets offers. On the other hand, one big disadvantage is that device is not as widespread as smartphones and tablets.
2.5.2 Smartphones and tablets
Another suitable device for running Augmented Reality apps is the handheld smartphone. According to Fritschle (2018) an estimation of more than five billion mobile users where at least 50% of them are using smartphones is expected by the end of 2019. Additionally, the market reach combined with the ergonomically designed device are the advantages with the smartphone. Although the smartphone has some advantages compared to head-mounted displays, the smartphone has some disadvantages as well. The field of view is limited due to the small size of the screen (Kurkovsky et al. 2012). In addition, the handheld smartphone does not provide hand-free interaction as head-mounted displays does. Furthermore, tablets have a lot of similarities compared to smartphones in terms of hardware components. However, tablets contain a larger screen than smartphones and the problem with hands-free interaction still persists. Moreover, tablets normally need to be held with both hands. Linked to the topic, Wang et al. (2017) highlights a general problem for all devices running an Augmented Reality is the fact that they are sensitive to strong ambient light. As a result of this issue it may be harder for a user to percept certain objects in the AR world (Wang et al. 2017).
2.6
Related applications
Schall et al. (2009) presented an AR system that could support field workers of various utility companies. Furthermore, their study investigated companies in the telecommunication infrastructure business, in their outdoor tasks in the
underground infrastructure business. Schall et al. (2009) mention that these companies commonly use Geographical Information Systems (GIS) to handle their information of underground infrastructure assets. According to Schall et al. (2009), companies could benefit from using AR technology to see were the underground infrastructure lies. It would be useful during excavations and preventing underground assets from taking any damage (Schall et al. 2009). After an evaluation of the system was done, participants agreed that the system provided a highly useful method for outdoor inspection of underground assets (Schall et al. 2009). Although their system was considered to be a useful method, shortcomings in GPS tracking in the street canyons were experienced by the participants.
Schall, Zollman and Reitmayr (2013) developed a novel AR system, called “Vidente”, that could be brought onto field. Their hardware consisted of a tablet PC, GPS antenna, camera, laser measurement device and a measurement unit. The reaserchers conducted several workshops with experts from the industry and with end users to gain useful information for developing the system. The experts and the end users were observed during the workshops. Schall, Zollmann and Reitmayr (2013) noticed inefficiency in the daily work of the observed employees in terms of planning and surveying. Efforts was made to address the inefficiency by developing a system that could perform surveying and planning tasks on-site without having to bring annotated 2D maps. Their results showed that on-site planning could benefit from using AR.
Pena-Rios et al. (2018) also contributed to the field of systems that use AR, LBS and GIS. As described in their report, they developed a fuzzy logic-based AR system with a smartphone and a pair of Microsoft Hololens. The smartphone was used to fetch the location of the user with use of the embedded GPS receiver of the smartphone. The location was then sent to a server and then sent to Microsoft Hololens which
showed relevant POIs within 9m2 (Pena-Rios et al. 2018). When the mentioned POIs
were within a predefined distance it allowed to user to interact with them to show metadata.
Capece, Agiatello and Erra (2016) developed another application that made use of the depicted technologies in Figure 2.1. However, even though the application did not aim to solve problems for land-surveyors, one can argue that it is relevant since the researchers used similar technologies which the artefact in this study aims to use. Capece, Agiatello and Erra (2016) implemented Augmented Reality applications for smartphones running the Android OS with the purpose to create a client-server framework to present interesting POIs. The application in their study showed relevant POIs that was located within a predefined radius of the user. Capece, Agiatello and Erra (2016) mention that a common problem when dealing with location-based AR, is to be able to interact with POIs what are close to the location of the user. Capace et al. (2016) addressed this problem with interactable billboards that allowed the user to be presented with related metadata of the POI. As for future work, the authors planned to incorporate GIS to the system architecture since the current version fetched POIs from a MySQL database (Capece, Agiatello & Erra, 2016).
2.7
Systems comparison
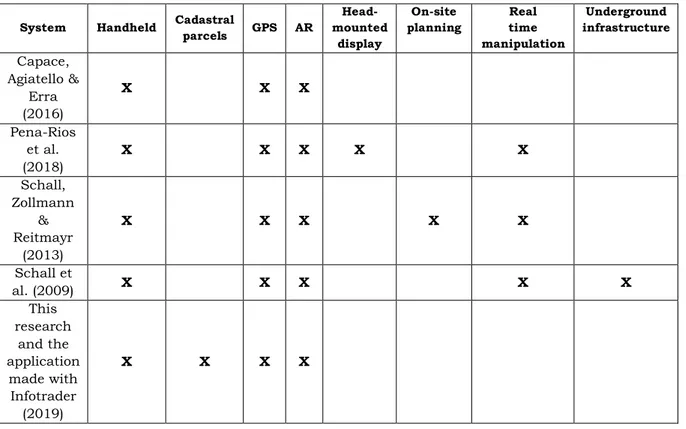
Below this text Table 2.1 presents and illustrates the similarities and the differences between each and every system that has been mentioned under the related work section. One noticeable difference between these systems are the fact that none of them have implemented any visualization of cadastral parcels. Therefore, the system that will be implemented during this thesis aims to solve a problem that none of the other systems have yet to my knowledge solved. The top row outlines different features that each and every system have.
Table 2.1 Illustration of similarities and differences between systems
System Handheld Cadastral
parcels GPS AR Head-mounted display On-site planning Real time manipulation Underground infrastructure Capace, Agiatello & Erra (2016) X X X Pena-Rios et al. (2018) X X X X X Schall, Zollmann & Reitmayr (2013) X X X X X Schall et al. (2009) X X X X X This research and the application made with Infotrader (2019) X X X X
3
Method
This section will explain relevant methodology for this thesis as well as why they were chosen. The chapter starts by presenting a section about the chosen research strategy and follows by the design and creation process, data collection method and qualitative data analysis.
3.1
Course of action
A company named InfoTrader with its base in Ronneby has a particular interest in this study. They have access to graphical data such as cadastral parcels which will support this study. With use of their data the aim for this thesis is to develop an Augmented Reality artefact for iOS which will help land-surveyors to visualize cadastral parcels. The application will then be used during user tests with participants which has knowledge within land-surveying to examine its usefulness. Moreover, usability tests will take place before the actual user tests to eliminate bugs or such things so the application can work as expected when the actual user tests take place. Opinions and other thoughts about the system will then be collected after user tests through interviews. The collected data will be analyzed in order to be able to present a result, from which conclusions will be drawn.
3.2
Research strategy
In order to answer the research questions, one should have a research strategy (Oates, 2006). In Oates (2006) six such strategies are described which are: survey, design and creation, experiment, case study, action research and ethnography. Furthermore, the research strategy that was considered to be the superior one was the design and creation strategy because of its focus of dealing with producing IT artefacts using an iterative design process.
3.2.1 Design and creation
Design and creation is one of the six previously mentioned research strategies. According to Oates (2006) this strategy focuses on developing new IT artefacts which should help to answer the research questions. Usually, the IT artefact is a computer-based system but it could also be an element of the developing process such as a new construct, method or model (Oates, 2006). Furthermore, Oates (2006) describes these four artefacts the following way:
• Constructs: Can be notions of entities, objects or data flows that is being used in IT-related domain.
• Models: Using combinations of constructs to represent a context where a problem needs to be visualized to better be understandable. A model construct can for instance be a diagram or a use-case scenario.
• Methods: Can be described as a stepwise guide to be followed to solve a problem using IT.
• Instantiations: A computer-based system that demonstrates the above-mentioned artefacts or demonstrates other ideas that can be implemented in such system.
Since the aim of this thesis is to find out more about to what extent it is useful to visualize cadastral parcels using Augmented Reality an artefact that can provide usage of AR needs to be implemented. The expected outcome from the design and creation research strategy is for the artefact to be demonstrated and made from ideas from the literature. As the artefact aims to demonstrate these ideas found from the literature, the IT artefact will be an instantiation type. Since this research focuses on developing an IT artefact that will be used and tested by land-surveyors in its real context I argue that this method is superior to the other methods that has been mentioned. Although, another method that could be suitable for this type of research is the action research method. One of its advantages are that the method concentrates on bringing improvements in practice relevant for people in the real world (Oates, 2006). An important aspect with this method is that the researcher needs to involve specialists during the whole research (Oates, 2006). Since the researcher lacks the possibility to involve land-surveyors during this research, the design and creation method was more suitable. Otherwise the action research method would be a great alternative as well.
3.2.2 The role
The artifact created to contribute to knowledge needs to take one of the three roles (Oates, 2006): the main focus of research, a vehicle for something else, or a tangible end-product where the focus is on the development process. Furthermore, Oates (2006) gives a few examples of how each of the roles can be used to contribute to knowledge:
• The main focus of research: The artefact is used in a new automated IT domain which previously was not automated. It can also integrate a new theory which is new to computing.
• A vehicle for something else: Conclusions drawn from research work or literature reviews is being illustrated with the artefact. The artefact that has been developed can also be used in real-life context and the contribution to knowledge is based on what happens when it is used in that context.
• Tangible end-product where the focus is on the development process: An artefact can be developed in order to examine a development method.
As stated above, the artefact must play one of the three roles. The role that the resulting iOS application played within this study was that it was “a vehicle for something else” since it was used to explore the usefulness of visualizing cadastral parcels using Augmented Reality. As mentioned under the introduction section, researchers found out that there was a lack of available technology on field compared to what was available in the offices (Schall et al. 2013). Pena-Rios et al. (2018)
proposed that Augmented Reality could be used as a technology on field for land-surveyors. These two conclusions led to the resulting role that the IT artefact played during the research since the artefact was used in real-life context for land-surveyors and evaluated in its natural environment.
3.3
The design and creation process
No matter which artefact that is constructed, the process of using the design and creation strategy has to follow established principles of system development in order be considered valid (Oates, 2006). To create the desired artefact, the design and creation process uses five phases: awareness, suggestion, development, evaluation and conclusion (Oates, 2006).
• Awareness: Is the recognition of a problem. Usually, these problems are found from studying the literature or from clients that express certain needs.
• Suggestion: Can be seen as the first idea offered by the researcher in order to address the problem found in the awareness-phase.
• Development: In this phase, the suggestion made in the previous phase is being implemented which will be evaluated in the next phase.
• Evaluation: Evaluations of the produced artefact takes place in this phase in order to examine how much the implemented version of the artefact deviates from expectations from the evaluators.
• Conclusions: Finally, the knowledge gained from evaluation of the artefacts are summarized.
According to Oates (2006) these above-mentioned phases of the iterative design process should not be followed in a step-wise manner. Instead, Oates (2006) suggests these phrases should form an iterative cycle. If the researcher only thinks of the suggestion in the second phase as tentative, it will lead to greater awareness of the nature of the problem (Oates, 2006). The researcher will gain new understanding of the problem and new solutions in each iteration. Once these solutions are evaluated it will lead to new insights and theories. With all of this in mind, the researcher using such a research strategy as design and creation, will learn by doing (Oates, 2006). With this strategy and the different phases in mind I argue that the first phase, the awareness phase of the process occurred when InfoTrader as a client expressed a need for a system. In addition, a gap was discovered by studying the literature and academics which provided knowledge that the outcome of this thesis could possibly strengthen previous research. After the awareness phrase, suggestions were made by the researcher to address the problems found in the previous phase. Once a version was ready to be evaluated it went through the evaluation phase. The evaluation phase was conducted with an employee from InfoTrader which expressed thoughts in terms of usability of the artefact. Due to time-constraints the usability test was unstructured and informal. The employee got instructions to test the artefact and to express the first impression simultaneously. As a result of performing the informal usability test, new insights were gained of what needed to be improved during future iterations (see section 4.5.2). Because the lack of getting in contact with professionals
during the design process, a usability test with the employee was performed instead. Although, it would be more feasible to involve professionals during the design process as well because it would allow the researcher to be sure to develop something useful. During the next iteration of the design process the issues highlighted in the conclusion phase of the previous iteration was addressed. The artefact was developed during two iterations before it was considered to be ready for the final user test with actual professionals with knowledge from land-surveying. The artefact was evaluated through semi-structured interviews with those professionals (see 5.1 User tests).
3.4
Data collection
The design and creation usually make use of interviews, observations, questionnaires or documents as data generation methods to be able to gain feedback from end-users about the developed IT artefact (Oates, 2006). These data generation methods can both be used to evaluate the final IT artefact as well as to evaluate in the aforementioned evaluation phase of the iterative design process (Oates, 2006). Since this research applies the design and creation strategy and have a qualitative nature the most applicable data collection method is interviews to be able to gain an understanding of to what extent cadastral parcel visualization using Augmented Reality is useful for land-surveyors.
3.4.1 Interviews
One of the data collection methods in the design and creation strategy are interviews (Oates, 2006). According to Oates (2006) interviews differentiate from regular conversations in the way that it does not occur by chance or randomly (Oates, 2006). Instead, the researcher has the control and will when needed steer the interview into the topic which are interesting for the study. Furthermore, Oates (2006) argues that interviews usually are conducted in an ethically correct fashion since the interviewee normally has agreed to be recorded for research purposes. However, if the interviewee expresses that some response should be “off the record”, the researcher must agree with that demand (Oates, 2006).
Furthermore, interviews can be conducted in three different ways and the researcher should have decided what type of interview beforehand. Oates (2006) describes the following three interview-types:
• Structured interviews: The researcher asks the same identical questions to each interviewee.
• Semi-structured interviews: It has the same arrangement as structured interviews but the researcher is allowed to change the order of the questions asked depending on the flow of the conversation. The researcher is also allowed to ask additional questions to the interviewee in order to get more detailed answers. The interviewee can also introduce new issues that they think is of relevance.
• Unstructured interviews: Here, the researcher has less control which means that the interviewee can speak freely about the topic after it has been introduced.
An important aspect in all of the above-mentioned interviews is that the researcher should note the responses without any expression nor indicate personal feelings. Furthermore, interviews as data collection method is suitable when the researcher wants more detailed information since complex questions can be asked. During the interview privileged information can be obtained that the interviewee would not be willing to tell a researcher they don’t have met in person (Oates, 2006). When an interview has been conducted, the researcher must transcribe the material in order to be able to analyze it in detail. It is of importance that sentences is being kept intact during transcribing, because the findings from these interviews will be used later as quotations (Oates, 2006).
To be able to answer the research questions and for this study to gain an understanding of to what extent it is useful to visualize cadastral parcels using Augmented Reality I argue that semi-structured interviews are a good option. In total three interviews were conducted with three interviewees who were customers to InfoTrader. Another requirement for this study to be able to participate in the interviews were for the interviewees to have experience within land-surveying since this is one of the main goals this research is focusing on. Moreover, as mentioned before, semi-structured interviews were chosen since it allowed the interviewees, with knowledge from the land-surveying business, to introduce new topics that the researcher was not aware of, as well as give valuable and insightful information regarding the artefact. In addition, semi-structured interviews also allowed the researcher to get more detailed information since follow-up questions could be used depending on the flow of the conversation between the researcher and the interviewees. Thus, gaining a deeper understanding of topics related to the research question which would not be collectable using another data collection method like observations. The interviews with land-surveyors were conducted as a part to evaluate the developed iOS application. The aim was set at evaluating the system from a technological aspect rather than usability of UI since it was more in line with the focus of the research. Furthermore, each one of the three interviews were conducted in real life where they tested the application and then made the interview. All interviews were recorded with a consent from each participant to later be transcribed and analyzed into codes to get valuable insights. See appendix A for the interview guide used during the interviews and appendix B for the consent form template.
According to Bryman & Bell (2011), interviewees might have difficulties to express themselves as greatly in another language than their mother tongue. Therefore, interviews were held in Swedish since it was the mother tongue of all the interviewees. In addition, Swedish was the chosen language to prevent the interviewees to not be able to express themselves as they would like. Therefore, the researcher argues that he reduced the risk of missing out any important information when conducting interviews in Swedish.
3.5
Thematic analysis
According to Oates (2006), when dealing with qualitative data one can apply either a qualitative analysis or a quantitative analysis. Qualitative data is data with no numerical values to analyze. Instead, the data can consist of words, images, videos and sounds. Furthermore, Oates (2006) argues that analysis of qualitative data often includes abstracting from the data into themes and patterns that the researcher believes are important to the research topic. The process of abstracting the data into themes is known as a thematic analysis. Braun and Clarke (2006) describes that a thematic analysis involves identifying, analyzing and reporting themes found from the data. Furthermore, Braun and Clarke (2006) explain that to be classified as a theme, the theme should capture something important about the data related to the research question. In addition, the same data should represent a pattern in the response. Linked to this, Braun and Clarke (2006) emphasizes that it is vague exactly how to define something to be patterned. Therefore, the judgement of the researcher is important to be able to classify something as a theme (Braun & Clarke, 2006). According to Braun and Clarke (2006) the thematic analysis consists of six phases to be performed on the data:
• Familiarizing yourself with your data: Includes transcribing the material if data was collected verbally.
• Generating initial codes: Includes coding the data to give it a meaningfulness.
• Searching for themes: The researcher should combine codes to an overarching theme.
• Reviewing themes: Some themes may need to be refined or broken up into separate themes.
• Defining and naming themes: The essence of each theme should form the definition and naming of it.
• Producing the report: Involves telling the complex story of the data in a way so that the reader is convinced of the validity of the analysis.
The thematic approach was used during the analysis of the data collected from the three interviews. Each recording was transcribed to make it easier to analyze further. Since only three interviews were transcribed and the fact that the participants expressed similar thoughts, the process of finding themes were not time-consuming. The themes found and considered to be relevant for the research questions were abstracted into the different subsections which can be found later in chapter five where the findings are presented.
4
Design and implementation
This section will present how the application was designed and implemented. Moreover, a detailed description of what hardware and software frameworks was used will also be presented. In addition, necessary algorithms that were made use of is also described in more details.
4.1
System architecture
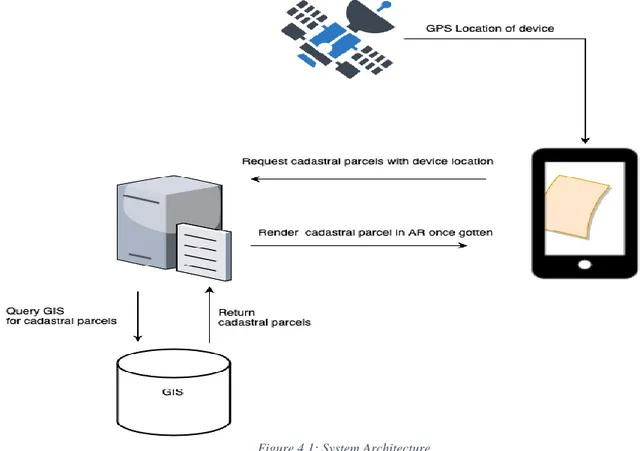
As mentioned before, land-surveyors often deal with cadastral parcels in their daily work. Moreover, because of the cumbersomeness of using 2D paper maps in a 3D environment to locate assets, forms the problem that this artefact aims to solve. Again, to address that particular problem, this artefact aims to visualize cadastral parcels in 3D using Augmented Reality. Furthermore, in Figure 4.1 a design proposal for the system architecture is outlined which also includes the data flow of the application made for this study. A crucial component for this design to work out is the ability for the smartphone to have a good understanding of its GPS location in the real physical world to be able to locate cadastral parcels around itself. With use of an accurate location of the device it should be able query a server with an underlying GIS with an objective to get nearby cadastral parcels relative to the device location. Once the cadastral parcels are fetched from the server they need to be rendered in the AR session of the device so the user can perceive and explore the rendered cadastral parcel.
4.2
Hardware and software
A suitable platform to implement the AR system that this study aimed to do was needed. The smartphone was chosen because most land-surveyors has access to such device. The Apple iPhone XR which belongs to one of the latest releases from Apple in terms of smartphones, were the chosen smartphone model. The operating system that runs on iPhones is called iOS and it was the 12.1.4 version that were made use of in this particular study and application.
Furthermore, to be able to develop applications for iOS an IDE is needed. For this thesis, the chosen IDE was Xcode 10 which offers all the necessary things needed to create apps for iOS (Apple Developer, 2019). Moreover, another decision that had to be made before developing the app was to decide which programming language to be used. As of the time the app was developed, Xcode 10 supported both Objective-C and Swift as the chosen programming languages. A decision was taken to develop the app using Swift with version 4.2 since its syntax was more appealing compared to Objective-C. The Swift language itself is an object-oriented programming language that was released in 2014 by Apple. Moreover, with the aim to answer the research questions using Augmented Reality, such a toolkit was required. Fortunately, Apple had support for this with their framework called ARKit which enable developers to create Augmented Reality apps for iOS. In addition, another framework that was used was Core Location which provided the GPS location of the device in the real physical world.
4.3
Filtering of GPS locations
Implementation of the system depicted in the system architecture of the previous chapter included fetching data from a GIS through a server. The server nor the GIS was something that needed to be implemented during this study. Instead, as being highlighted in the method section, InfoTrader provided that service so the focus of the implementation could be aimed at developing the app itself.
One key feature of the app was the ability to get the GPS location of the device in order to be able to get nearby cadastral parcels from the server. Therefore, the importance of getting an accurate location as possible was crucial. The device location could be acquired through the Core Location Framework when implementing an instance of the CoreLocationManager class. Through that instance one could get location updates. However, the framework delivered inaccurate or old locations sometimes. A filtering process of locations gotten from the framework had to be implemented to filter out inaccurate locations that were considered old and therefore not up to date. Locations were considered old if the delivered location was measured to be more than 10 seconds old. That data was acquired through the timestamp property of the location. Another property of the delivered location was the horizontal accuracy. According to the documentation of the Core Location Framework, locations with a horizontal accuracy of less than zero meters is to be considered as invalid, so these was filtered away. In addition, locations with horizontal accuracy with a value greater than twenty meters was also filtered away because they were considered to
be too inaccurate for this application. Other locations were considered to be valid. Once the initial location of the device was determined, an API call was made to the server to fetch cadastral parcels within a predefined radius of five meters around the initial location. The API call was sent as a push service without any input from the user.
4.4
Transforming 2D coordinates
An AR session could be achieved in the iOS app by using ARKit framework which provided all the necessary functionality. The session ran with an AR-World-Tracking-Configuration which enabled tracking in six degrees of freedom (6DOF). Since tracking was made in 6DOF, each position in the AR session could be expressed with X,Y,Z coordinates. Once running such a session, the initial position of the device denoted the origin of the world coordinate system of the device.
The app is configured to automatically make an asynchronous API call to the server as soon as the initial GPS location and the world origin has been verified in the app, with the objective to fetch cadastral parcels. The response from the server consists of several 2D GPS coordinates, together forming a polygon. The response came back as JSON which was parsed into several classes. These coordinates were measured in the WGS84 coordinate system. The WGS84 coordinate system has the middle point of the earth as its world origin and is standard for GPS (GIS Geography, 2018). Because of this a lot of processing of the data had to be done which are explained below.
One problem that aroused was the fact that these coordinates were relative to the GPS coordinate system while the AR app operated in its own coordinate system. To address this problem a transformation from the GPS coordinate system to the local coordinate system of the device were performed. Such a transformation was executed stepwise. Firstly, by calculating the distance between the GPS position of the device and the GPS position of the coordinate using the Haversine formula (Van Brummelen, 2012). Secondly, calculating the bearing between the two locations using the Bearing formula (Veness, 2012). Lastly, getting a rotation matrix in the y-axis using that bearing and a translation matrix using the distance calculated in step one. The above-mentioned transformation was applied to every GPS location of each polygon representing the cadastral parcel in order to determine the position of each and every location in the AR local coordinate system. These positions in the AR session could be considered as POIs since they together outlined the cadastral parcel.
4.5
Cadastral parcel visualization
Once each and every position of the POIs were determined they were rendered to the screen of the iPhone. One observation made while implementing the system, was the fact when the cadastral parcels were rendered in the AR session, the cadastral parcels which had control points at a distance farther away from the user were hard to see. Especially when the cadastral parcel area was small. To address the observed problem and to make it easier to percept the cadastral parcel, an implementation was made that only rendered the current smallest cadastral parcel which the user at the time was located within.
Furthermore, a function which calculated the area of an irregular polygon was implemented and used in order to sort an array containing all the cadastral parcels in ascending order. To filter out cadastral parcels which the user was not currently within, the solution to the famous point-in-polygon problem could be applied (Sutherland, Sproull & Schumacker, 1974). The problem could be solved using different algorithms and the one used was called the Winding Number algorithm (Sunday, 2001). Unfortunately, the algorithm was given in C++ code so it had to be implemented using Swift 4.2 instead since it was not part of any standard library. Then, only the cadastral parcel with the smallest area and which the user was currently within was then rendered to the AR session and thus was perceptible for the user. Another feature that was implemented to the system was its ability to track if the user left a cadastral parcel and thus was located within an adjacent cadastral parcel instead. Simply, by calling the filtering function every two seconds to evaluate if the user still was inside of the current smallest cadastral parcel. If the user was estimated to be outside the rendered cadastral parcel, the system then rendered the adjacent cadastral parcel instead so the user could percept the correct one.
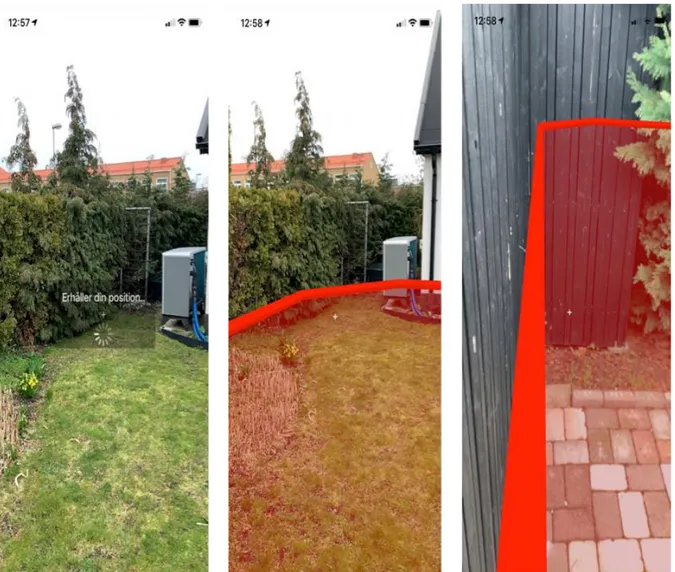
4.5.1 First version of the iterative design process
Using the design and creation method while developing this artefact resulted in two versions of the artefact. The first version of the implemented app is visualized in Figure 4.2. In the first version there was no feedback telling the user that the system currently was trying to determine the location of the user in the real world. This uncertainty led to that the participant of the usability test did not understand what was going on during the initial moment. Another thing noticed were that only the border of the cadastral parcel was visualized. Suggestions was made from the participant that the whole cadastral parcel should be colored to make it easier to percept larger cadastral parcels.
4.5.2 Second version of the iterative design process
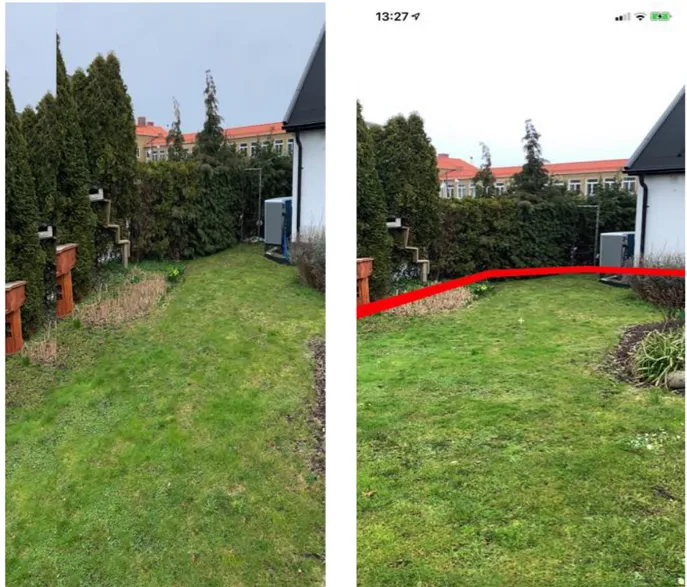
Suggestions that were made from the participant during the evaluation of the first version was implemented in the second iteration of the design process. The second implementation had a component which told the user what was going on during the initial moment. A filter was implemented to make it easier to percept the cadastral parcel (see Figure 4.3).
5
Evaluation
This chapter will present the way the developed artefact was tested in practice with professionals with knowledge from the land-surveying business. The outcome of the user test will be presented under the result section where each subsection is abstracted using the thematic analysis described under the method section.
5.1
User tests
The participants in this study who performed the user tests consisted of three professionals with experience in the land-surveying business. All of them were customers to InfoTrader. From now on, these three participants will be referred to as Bob, Carlos and Alice. Moreover, all the participants had more than five years of experience in the land-surveying business and were considered as end-users. Bob is a 67-year-old male, active in a smaller company in Sweden. He explained that he has more than 30 years of experience within the field of land-surveying. Carlos is also a male, at the age of 59. He expressed that he has been involved in questions regarding land-surveying since 1986, which is more than 30 years of experience. Carlos currently works at a large electric utility company based in Sweden. Lastly, Alice is a female at the age of 33, and she is also working at the same electric utility company as Carlos, but at a different office. She has about 5 years of experience from the land-surveying business.
User tests was performed outside since it is the natural working environment when performing land-surveying. It was performed on a parking lot in Malmö which was considered to be a great fit for testing the application (see Figure 5.1). The boundary of the parking lot was visually observable and could therefore easily be compared with the visualization that the application augmented, in terms of precision. All of the participants Bob, Carlos and Alice had a chance to test the artefact individually and therefore form an opinion by themselves so that they could not influence each other’s opinion and answers. While conducting the user tests, the participants got instructions to start the application and wait for the device to realize its GPS location. As mentioned before, once the device realized its location it automatically fetched nearby cadastral parcels and rendered the smallest one according to the area. Once the cadastral parcel was rendered to the screen of the AR session the participants got further instructions to walk towards the boundary which outlined the cadastral parcel to percept the boundary closely. Furthermore, after a while the participant got the last instruction to take a step over the boundary and therefore be located within an adjacent cadastral parcel instead so the application automatically could render that particular cadastral parcel.
The aim of the user test was to let the participants form an opinion about the artefact and its usefulness by letting them follow the above-mentioned instructions. After every participant had tested the artifact the participants opinion was evaluated using semi-structured interviews. The semi-structured interviews were performed individually with each of the participants Bob, Carlos and Alice. See appendix A for the questions asked during each of the interviews.
Some predefined questions were asked during each interview and the order of these questions was altered depending on the flow of the conversation. The first part of these questions was regarding personal information about the participant. Questions concerning the artefact was asked during the second part of the interview. Each and every participant had to give their consent through a consent form before testing the artefact to make sure that the interviews could be recorded and that the data could then be used in this study.
Figure 5.1 Participant testing artefact at the parking lot
5.2
Result
The data collected through the aforementioned semi-structured interviews formed the basis of the result that is presented below. The participants will still be referred to as Bob, Carlos and Alice. Each of the sections below are referring to different themes found in the transcribed material from the interviews using the thematic analysis method. The themes derived from performing the thematic analysis were the following: augmented reality experience, usability of AR in land-surveying, augmented reality versus 2D paper map, precision and additional functionality.
5.2.1 Augmented Reality experience
When the participants answered a question regarding their prior knowledge of what the concept of Augmented Reality means, their answers differentiated. For instance, Bob expressed that he had experience working with Augmented Reality before, but not within the land-surveying business. Instead, it had been used in the real estate business where they could view addresses of houses in neighborhoods. Hence, he was familiar with the concept beforehand. On the other hand, both Carlos and Alice mentioned that they had never been in contact with any type of Augmented Reality system before. Furthermore, both Carlos and Alice said that after they had tested the artefact, they began to understand the concept of Augmented Reality and how the technique could be used.
5.2.2 Usability of Augmented Reality in land-surveying
Another theme that were found in the collected data regards usability of AR in land-surveying. Alice explained that when changes are made to a piece of land, for example when that particular land needs to be subdivided, the land-surveyor measures every corner of the subdivided land and marks them as control points into the ground. By measuring, Alice referred to as annotating the GPS location of each and every control point. These control points were something that both Bob and Carlos referred to in each of their interviews. Furthermore, Bob stated that sometimes, it is hard to find old control points in urban environments as they are buried into the ground. Moreover, Bob believed that the artefact could be an excellent tool as he said:
” …this would be an excellent tool, not only within land-surveying, but for everyone that have needs to know where to start searching
for the control points that are grounded.”
In addition to the above, Carlos also expressed that these control points were most of the time the ones one is interested in while performing surveying. In addition to what Bob said about helping the land-surveyor where to start looking for control points, Alice also believed that the artefact would be very good as a complement, for getting an idea of where these control points are located in the ground as they could be hard to find in urban environments.
While Alice admitted that the artefact would be a very useful tool to have, she also believed that most of its usefulness lies in helping the land-surveyor to find old control points. Moreover, Carlos had similar thoughts about the usefulness. Bob on the other hand mentioned other usages. Bob believed that the visualization technique that the artefact provided could help to visualize a result of a subdivision before annotating each new control point and bringing back the result to the office and import it into the GIS. In addition, Bob mentioned that this would reduce the risk of not being pleased with the subdivision and therefore heading back out to the field and repeat all annotations. Moreover, Bob also mentioned the tool could be useful while meeting with property owners and being able to show them where the true
cadastral parcel delineated since many of the owners had their own imagination of where the boundary outlined.
Lastly, both Carlos and Alice mentioned that the possibility to take a step over the augmented cadastral parcel helps associating where it lies. Alice was surprised in a positive way that the artefact managed to justify the cadastral parcel which the device was, at the time, currently located within. This was noticeable when taking a step over the edge of the cadastral parcel. Bob did not express anything regarding this feature.
5.2.3 Augmented Reality versus 2D map
When asked a question regarding if the provided visualization could replace older visualization techniques like the 2D paper map, answers from the participants differentiated. As for the current state of the artefact, Bob did not seem to think that it could replace the 2D paper map completely. Instead, Bob believed if the artefact would get more stable in the future, it could replace the 2D paper map in the long run. Linked to what Bob said, Alice believed in the combination of using both systems by saying:
“…there exists old useful information which is nice to have when doing field work which could not be replaced by this model, but I
definitely believe in the combination”
Carlos did on the other hand believe that the 2D paper map was replaceable by saying that the way the artefact visualizes cadastral parcels, could be a completely new way of showing cadastral parcels.
5.2.4 Precision
Another theme that became evident when reading and analyzing the data were precision of the GPS in the artefact. When each participant tested the artefact, issues with the GPS of the device aroused. Differences between the augmented cadastral parcel and the outline of the parking lot were observed.
During interviews, a question was asked if the participant could express their first impression of the artefact, while in use. Carlos mentioned the augmented cadastral parcel unsuccessfully outlined where it supposed to, compared to where the parking lot delineated. Moreover, Carlos said in order to make the artefact more useful in field work, the precision needs to be more accurate than it was during the test. Also, while answering a question regarding if Carlos felt a demand of visualizing cadastral parcels Carlos stated the artefact would be even better if the precision was more accurate. Bob gave a similar answer regarding precision. Linked to the topic, Alice mentioned the only drawback with the artefact was the precision of the GPS. In addition, Alice said this could be a further problem since while in use in urban environments, even poorer connection to satellites would be common.
5.2.5 Additional functionality
The last theme found that are interesting for this study are additional functionalities. For further implementations to the system, Alice proposed a clearer visualization of the control points in the augmentation of the cadastral parcels to percept them easier since these are the interesting points of interest for the land-surveyor. Alice stated it would be enough by adding a small rectangle at each control point for distinguishing purposes. Furthermore, Alice suggested adding more layers to the AR world similar to what a GIS office system can display.
Bob recommended adding more layers in terms of information bounded to cadastral parcels or other augmented objects. Although, both Bob and Carlos said it was hard to come up with new ideas at the time the interview was conducted but suggested new ideas would arise if the artefact was used in practice.
6
Discussion
The purpose of this section is to discuss the findings presented in the previous chapter. In addition, the research questions will be answered based of the insights the results gave. Furthermore, limitations with the artefact and limitations with this study will be discussed as well.
6.1
Visualization of cadastral parcels using AR
The findings and insights from the semi-structured interviews indicate that visualizing cadastral parcels in Augmented Reality is useful for land-surveyors. This is drawn from the fact that two participants in this study expressed not only that the artefact would be useful. Instead they highlighted that it would be very useful when searching for old control points because these control points are physically buried into the ground. In addition, as one participant stated that helping land-surveyors to locate old control points would possibly be the main contribution that the artefact provides, that statement also indicates that it is useful to visualize cadastral parcels using Augmented Reality. Moreover, two participants noticed that if a cadastral parcel boundary were crossed, the artefact rendered the adjacent cadastral parcel instead. Both participants expressed positive thoughts of that feature because it helped them to associate where the boundary outlined. Due to what has just been mentioned from the findings one can draw the conclusion that to use Augmented Reality when visualizing cadastral parcels can be useful for land surveyors in their daily work. In fact, it could even help them become more effective and make their daily work better due to the fact that when using this type of technology, it would be easier and more effective to find old control points.
The participants’ positive thoughts about the usefulness of the artefact can possibly be explained by the fact that AR operates in real-time and hence can accomplish more than the traditional 2D paper map. As highlighted before, the land-surveyor need to be familiar with map scales, generalization and symbol language to be able to perform a mental transformation from 2D paper map to the real world which is in 3D (Schall et al. 2009). That particular problem is addressed by using AR instead since AR already operates and renders graphics in 3D. Neither can a 2D paper map provide any feedback when a user is in fact crossing a cadastral parcel as this artefact managed to do. Linked to the topic, Schall et al. (2009) experienced similar results from their study while visualizing underground infrastructure using AR, LBS and GIS. Their participants found it useful to visualize underground infrastructure which further indicates that it indeed is useful to visualize GIS layers using AR. Furthermore, all of the above is doable by combining the three concepts of AR, LBS and GIS. In addition, it gives indications that combining these three concepts is something businesses, within different kinds of field work, should look more into because of its advantages.
6.2
Replacement of the 2D paper map
The findings suggest that the 2D paper map could not be replaceable by the functionality that the artefact provide. Only one participant believed that the 2D paper map could be replaced by using the artefact. Although, one of the participants believed the 2D paper map could be replaced in the long run by systems like this, if the system were to be more stable. Another participant expressed that the combination of using such system and using a 2D map would be more suitable. Since the 2D paper map still visualize other things than just cadastral parcels. Linked to the topic, one participant suggested that the artefact should incorporate other layers of information than just cadastral parcels. As in the case of a GIS, which integrates data from different sources as layers (Cromley & McLafferty, 2012). From the above discussed one can draw conclusions that this type of way to use AR could in the long run be very successful but it might need some more time and research to out rule the old 2D map.
Although, the result gave new insights and indications of what it takes to replace the old 2D paper map with newer visualization techniques like AR. Compared to the 2D map which can express more layers like bushes, trees and lakes which probably help land-surveyors further to locate control points as these layers can act as reference points when searching. Therefore, a direction towards replacing the 2D paper map by such system like this one, the system needs to at least provide the same type of information that the 2D paper map can.
6.3
Limitations with the artefact
The design and implementation of the artefact could be further improved. All the three participants felt a dissatisfaction regarding the precision of the virtual cadastral parcel of the parking lot during the user tests. Compared to the physical boundary of the parking lot, the virtual did not align where it should have. The dissatisfaction could be explained by the artefact aligning the cadastral parcels with a higher margin of error than what the participants are used to have with their measuring instruments. The results gave new insights which indicates that the precision is a very important feature and should therefore be taken into more consideration when developing location-based systems which need a high accuracy.
The reason of the margin of error can perhaps be explained by the fact that the current state of the art sensors in an iPhone XR does not provide a sufficient GPS location accuracy. Because, in order for the system to calculate the position of each control point, it uses the haversine formula which calculates the distance between two GPS coordinates in meters. In this case, as the system uses its own GPS coordinate to calculate the distance to each and every other control point, the GPS location of the device has to be very accurate. Otherwise, the result of these calculations would be a bit off, as in the case when the participants evaluated the artefact. Furthermore, the evaluation of the artefact gave indications that developing such systems that incorporate the concepts of AR, LBS and GIS while requiring high GPS accuracy may not be a feasible when using only a smartphone.