ECOLOGICAL TECHNOLOGY AND MANAGEMENT KALMAR, SWEDEN, September 22-24, 1 999
15
APPLICATION OF HYDROLOGICAL
MODELS IN WATER PLANNING
Lars Kyle/ors
Vatten & Samhdllsteknik Ltd, Sweden
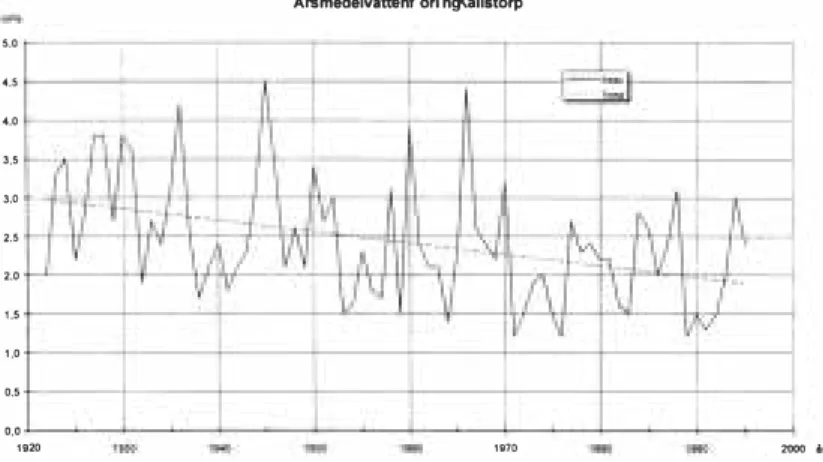
SUMMARYWater Planning, in the strictest sense, is still in its infancy as part of the traditional comprehensive planning field. One of the main reasons for this might be that only a handful of the key decision-makers and planners share the comprehensive view of water being one of the most important natural resources. In the south-eastern part of Sweden, water resources for different kinds of use are scarce on a regular basis: hence one has had to learn to be careful with the usage of this resource. Over time, as computer technology has developed, the question whether practical water planning issues can be eased with the use of hydrological models has been raised. Over the past few years, researchers at Royal Institute of Technology (Thomas Gumbricht) have developed a model - "PHASE" - based upon physically associated factors, but with simplified structures. Also available on the market is the well-established "MIKE-SHE" model which is also based on physically correct factors, but belongs to more sophisticated/complex models. Both models have been tested on the river basin of the Ljungby River and extensive knowledge has been collected and analysed on hydrological conditions. It has been noted that the annual mean discharge has decreased successively during the past 75 years.
Planners have ordered impact assessments ofe: probable decreases or increases in forest area; changes in drainage; as well as the transport of nitrogen through the landscape from the model operators.
The model operators obtained basic information, directly from GIS producing institutions. This information has been studied/processed and digitised. Measurements over a brief period of time have been used in order to calibrate the models against calculated water flow measures with reference to the water level gauge of the Swedish Meteorological and Hydrological Institute at Kallstorp. The basic measurements have been adjusted in order to get a reasonable
show the positive effects of wetlands as well as of water reservoirs in lakes. Which contribute to the reduction in Nitrogen by the process of denitrification.
This modelling case study/experiment demonstrates the need for profound specialist knowledge in the use of GIS data as well as modelling. At the present stage of development, neither of the models are of much use to the traditional planner or the decision-maker. MIKE SHE has - in the present research project - given a greater number of, as well as more accurate results in comparison with PHASE. Nevertheless development needs to continue. PHASE ought to keep its basic concept: simplicity. In such a shape PHASE can - with reasonable investments - be used for more comprehensive estimations of changes within river basins. MIKE SHE is being continually improved through experience gains from market use. Within the area of water management the model ought to - for reasons of cost - primary be used to enlighten important and especially complicated issues within a river basin i.e. the transport of nutrients.
The model operators presently want improved databases with successively improved parameters. Issues concerning vegetation indexes and leaf area indexes need to be developed as well.
TEST AREA
The south-eastern part of Sweden as a role lack of water. ln this area we have a long tradition of water planning. ln the Ljungby River we have collected lots of data, useful in a research project. This is the background for choosing the river basin of the Ljungby River as test area.
ECOLOGICAL TECHNOLOGY AND MANAGEMENT KALMAR, SWEDEN, September 22-24, 1999
-:{._
/�! ··-' ",t
Fig 1 Over-view DATA
3,0 2.5 Arsmedelvattenftirlng Klllstorp 5,0 ◄,5 ,.o 3,5 2.D
'·'
,.o 0,5 0,0 "20 11HO 2000 i,Fig 2 Annual mean discharge at Kallstorp, period 1922-1995
During the same period the atmospheric precipitation have not decreased at all, fig 3. This means that you have to find the reasons some where else.
Arsne darbOrd, Kalmar
-f ----+----+---+---,---�1----1----+---I 325
300 .l---l---l---4---4---+---+---<1---�
11120 11i13O 1140 11150 1180 1170 1910 ,,,o 2000,,
---··-------�
ECOLOGICAL TECHNOLOGY AND MANAGEMENT KALMAR, SWEDEN, September 22-24, 1999
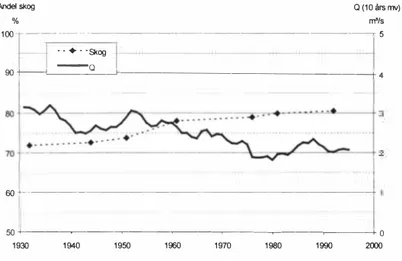
The use of land have been described based on digitized maps, photos and remote sense. The area of forests, in percent of total area, is together with the discharge shown in fig 4.
Andel skog a c10 ars mv)
% -100 s ··♦··Skog
oot---l.._===��
0
:____1---T4 6Q+---+ �+---�---�--�---�---�---+o 1930 1940 1950 1960 1970 1980 1900 2000HYDROLOGICAL MODELS
In the project two hydrological models have been tested parallel - PHASE and MIKE SHE. The principle structure of the two models are shown in fig 5 and 6.
rumsupplOst data tidsupplOst data
-f\Odesvagar
hydrologiska parametrar tor markvatten regional kalibrering eller GIS-data
(empirisk optimering)
punktmatningar
Pixlar eller celler
VY>.
tidsserier -nedert>Ord -temperatur!
j Fysiska parametrar Hydrologisk model! sem1-d1stribuerad 1 (PHASE) I lokal kalibrering Vegel.ltions Fr1ktal �•fTlk vattenqbl- Btadyteindex Modellresultat - vatteninneh:tll - transpiration
- evaporation - ytvattenavrinning - markvattenavrinning - grundvattenbildning
t---1:===�--llli
ECOLOGICAL TECHNOLOGY AND MANAGEMENT KALMAR, SWEDEN September22-24, 1999
I
Snosmaltning bidrag till nettonederI
bord • ettonederl>ord ·nterceptions agasin ojlig evapo spiration Evapotranspiratio �-�--<iutzonen Y tavrinning och alstromning ·nfiltration Omiittad zon Utbytes modulRESULTS
The two used models have succeeded in presenting acceptable synchronization with real data. R2-values are 0.7 - 0.8.
By working with the models we have found that we can explain the decrease of discharge with changes in the area of forests and other vegetation together with changes in the depth of drainage.
It has also been possible to use the models in planning of steps to optimise the retention of nitrogen.
990618,LK List of references:
GUSTAFSSON, GUMBRICHT, KYLEFORS 1999. VAY - VA-FORSKe- Rapport. Application of Hydrological Models in Water Planning.