KALMAR, SWEDEN, November 26-28, 2007
CONSTRUCTED WETLAND SYSTEMS IN THE
UK - THE CW A DATABASE RESOURCE
Peter Randerson
1Paul Coope/
1School of Biosciences, Cardiff University, UK
2PFC Consulting, The Ladder House, Cheap Street,
Chedworth, GL54 4AB, UK
ABSTRACTThere are now believed to be more than 1,200 Constructed Wetland systems (CWs) in the UK. The Constructed Wetland Association (CWA) was formed in 1999 by a group of experienced, reputable designers and constructors to bring together best UK practice. CWA is now responsible for a database of design and performance relating to a range of systems (bed types and applications), which now contains information from more than 1,000 beds. CWA members are encouraged to contribute data to the database, which has been updated 9 times since it was first created in 1999. Most of these sites treat sewage/domestic wastewater but the database also includes examples of systems for the treatment of minewater, sludge, landfill leachate, industrial effluents, surface runoff and road runoff. Particular treatment applications are illustrated by Case Studies, summary articles describing design, construction and performance, For beds with data on influent and effluent concentrations and flow rates, the user can fit four alternative models, to derive reaction rate constants (K), enabling some degree of quantitative comparison of the pollutant reduction performance for different system designs. Access to the database is the main benefit of CWA membership: new members from outside UK are welcome (www.constructedwetland.org).
KEYWORDS
Constructed Wetlands; Reed Beds; database; design; models; performance data; case studies; sewage treatment; tertiary treatment; wastewater treatment
I. INTRODUCTION
Over the past 20 years, constructed wetlands (CWs) have become accepted as a relatively inexpensive, low maintenance "green" technology for wastewater and leachate treatment [I, 7, 12]. Pollutants are removed from wastewater in the wetlands by a complex variety of physicochemical and biological processes [3, IO]. Although a large number ofCWs have been built worldwide, the mechanisms for removal of organic matter and inorganic nutrients in these systems is poorly understood [I I]. In the UK, it is thought that over 1200 such systems have been created [2]. The Constructed Wetland Association (CWA) was formed in 1999, by a group of experienced, reputable designers, constructors, water company operators, researchers and plant suppliers, with the aim of maintaining high standards in the new industry. CW A organises meetings, training courses, promotional events, and maintains a website (www.constructedwetland.org), as well as a database detailing the CW systems in the UK. The website provides authoritative information on CWs and advice to potential customers for
membership of CW A must demonstrate technical and financial competence as practitioners in CW technology, or with academic publications. To help maintain the reputation of CW systems and to promote confidence among potential users, CW A members are asked to contribute design and perfonnance data to a central resource of information on best UK practice. This serves to demonstrate the capability of CW technology in a wide range of applications, including treatment of sewage/domestic wastewater minewater, sludge, landfill leachate, industrial effluents, surface and road runoff.
2. THE CWA UK DAT ABASE
The first UK Reed Bed database was compiled as a supplement to a handbook on CW design [6] and contained infonnation on 154 sites. CWA later took over responsibility for the database, and since 2000 it has undergone 9 revisions using data provided by CW A members and UK environmental regulators. The database is constructed with Windows Access (version 2003 and now contains infonnation on 1,012 sites/beds [2, 4]. Researchers from outside the UK showed interest in becoming members in order to gain access to the CWA Database. A decision was taken in 2005 to admit members from outside the UK at a reduced subscription rate and the Association now has members in Australia, the Czech Republic, Italy and USA. 2.1 Contents of the Database
The Main Menu (Figure 1) shows the separate sections of the database. The Member/Contact database gives contact details of CW A members and their specialist interests and expertise, as well as other contributors to the database. One key feature of the database is a series of Case Studies. These are Microsoft Word documents containing process descriptions of sites, perfonnance data tables, site diagrams, photographs and references. These are aimed at demonstrating to potential users how a particular wastewater treatment problem has been solved by a CW design.
If MAIN M£NU · form
[[j
�flj
r
:fel'f01i11'1nce !Site 1
····-·-·-·Datah.ase !;_dit Add Oat,1
M_ember;Conto1ct
Datab,ue M,2tlelli119 An,,lysis
C.1s.e Studies Sites with Pe-rfo1111.111ce Oat<.'I
KALMAR, SWEDEN, November 26-28, 2007
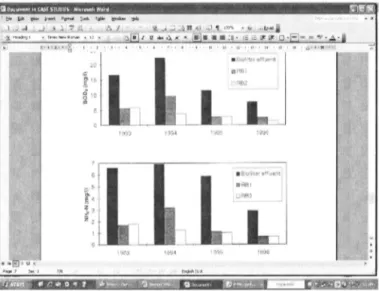
Figure 2. A screen from the Case Study for Tertia,y Nitrification in VF beds at WRc Medmenham.
Case Studies are given of the following systems: Secondary Sewage Treatment in HF beds Tertiary Sewage Treatment in HF beds Hybrid systems (VF beds followed by HF beds) Tertiary Nitrification in VF beds
Sludge Drying VF Reed Beds
Compact VF beds for Secondary treatment
Separate Storm sewage overflow treatment in HF beds
Combined Storm sewage overflow+ Tertiary treatment in HF beds
Figure 2 shows a summary of performance data from a Case Study for VF Tertiary Nitrification at Water Research centre, Medmenham. The 2-stage vertical flow reed bed design was successful in achieving full nitrification over a 4 year period, allowing discharge to the River Thames, well within consent limits. Table l shows the performance of a CVF reed bed system at Will's Barn, Somerset designed to treat septic tank effluent from 9 people (area = 4m2 ). Excellent reduction is achieved for all parameters, despite the relatively high concentrations in the influent. Oxygen Transfer Rate (OTR) was calculated to be 28 gO2 m2 day"1, with the system operating at the average hydraulic loading rate of 39 mm day"1 [4].
Table 1. Average petformance of Will 'sBarn CVF Jystem (l 8 samples, mgr')
BODs TSS NH4N Total N Total P
Influent 350.8 258.1 93.9 124.5 16.6
--�
"""""
,�-
-
...
_
.'-� ,.,.. � � �-ctii&· e Contact:, � [Abberi;conm:.in, !Abberley(orm,or,2--
Count,,:====·
�
WoddA•n: @:) Apph�ion: 'Acomb'A<badm GH9faphical A,u.:
:Morton
-�
V � · Mningt""�
onP1__,,
func(ion: " s,1tea it.tin: ,.,, � Alcfxircu;t,GasServiceS� Oesignier. v � AlderlonFTS PlMltSuppli•: Y � _Aford:A1t,Y1�A1m, D� PlMit Specie.1: V �
\Aki,w,,s
·Alslorw.leld
Armfield
Aiuton [Phase 11 · �I ear AU Selection Criteria!
!
.Bact to Previous ScreenI
Arddleen� e ... gedn
-
Site Information (Selected Site)-·-A,hbyFOW•e
�
:Athford(1rtlMell
[As!wy
"'"""
Site Information (All Sites in List)�
(Print Preview)Ashom!! Hill M�ment Colege
F'leest1�ye1r
IAtkham C1ffl He"°°'1
.,,_
A.m�.Sn.rih ...'.:°'.'f � Report l?"'���!L'"'
j .. . f_rinJLi:tt
""
""
Net of Site• Selected:
i�
Graph""
"""
1012
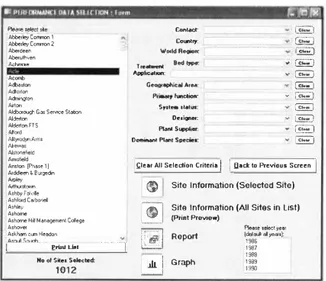
Figure 3. The main screen of the Performance Data Selection form.
A three page Reading List covers the sources of infonnation on wastewater treatment with a
particular bias towards UK and European systems and practice, The Performance/Site
Database button brings up a screen (Figure 3), which lists 1,0 I 2 beds from more than 900 sites in the UK, Of these beds, 20 I have some Performance Data but the amount varies widely
from data over several years to just occasional records. This Performance Data Selection
screen allows the user to select sites to view based on Bed type (Table 2), Treatment
Application (Table 2), Geographical area and Designer, The number of sites selected by these criteria is displayed,
Table 2. Breakdown by Bed Type and by Treatment Applications (June 2007)
Bed Tvve 1012 Treatment
Secondarv sewage Horizontal Flow beds 107 Sewage 874
Tertiarv sewage HF beds 698 Minewater 50
Vertical Flow (VF) beds 49 Landfill leachate 24
Comoact (CVF) beds 21 Industrial 19
Hvbrid svstems (VF+ HF) 19 Surface runoff 16
Storm sewage overflow ( seoarate) 6 Agricultural run-off 13
Combined storm sewage overflow+ 40 Road runoff 6
Tertiarv
When a particular site has been selected, details are accessed using the Site Information
button, the Report button brings up a spreadsheet showing performance data, and the Graph
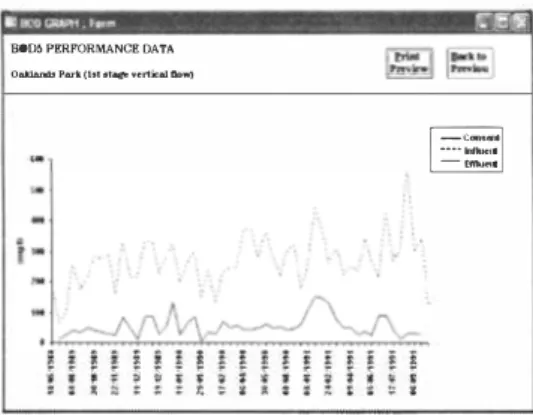
button allows performance data to be plotted against time (Figure 4), In the 1980s and early 1990s, when CWs were still new and experimental, both influent and effluent composition and flow rates were measured in order to establish design and operating criteria,
�
'KALMAR, SWEDEN, November 26-28, 2007
soru PERFORMANCE DATA
O�Parl(llllt.llfillwertir:alllo->
'
Figure 4. Graph of BOD5 removal for Oaklands Park 1st VF stage from the database.
Now that CWs are regarded as conventional, safe solutions for many treatment applications, only effluent analysis is nonnally carried out, as required for regulatory compliance (2]. The
Add/Edit data screen allows users to add their own data if they have some new material to
contribute. The Modelli11g Analysis function allows a user to model data from a particular site
using 4 standard models of pollutant removal kinetics.
3. MODELLING POLLUTANT REMOVAL 3.1 Removal kinetics
Removal of pollutants in CWs is usually assumed to follow first-order plug flow kinetics [5, 8, 9], whereby there is a uniform mass flow through the bed from inlet to outlet (HF) or from surface to base (VF). The bed is treated as a bioreactor in which a given pollutant undergoes a constant proportional decline in accordance with the hydraulic residence time.
C, = Co e<-ktr) Equation 1.
Where: Co, C, = influent and effluent concentrations respectively (mg 1"1); tr = hydraulic residence time (day); k = first order reaction rate constant (da/). Hence the rate of decline of pollutant concentration depends on the value of k (Figure 5), which must be detennined empirically for a given bed type and conditions such as bed area (A), depth (d), porosity (n) and flow rate (Q).
ln(C1/C0) = -k tr Equation 2.
Reaction rate is typically dependent on the temperature (of sewage in the reed bed). Within
the range J 5-20 ° C this can be approximated by a linear model k(T) = a T+ b; where a and b
are empirical parameters, and T = temperature (°C) [9]. In a VF bed the input is not a
continuous flow, as in HF, but there is rapid drainage producing an unsaturated phase after each pulse of wastewater. Q is a mean daily value and, although the wastewater is in contact with the bed for a shorter time than if the flow were constant, it may be treated as a plug flow reactor, since Q is averaged over time. Equation 2 may be used to determine the bed area required to achieve the desired pollutant removal for a given hydraulic residence time
C: !!! 300 250 200 150 100 50 0 0 2 4 6 8 10 12 Time Figure 5. First order kineitcs of pollutant removal
A= Q (In C1 - In Co)/ (k. d. n) Equation 3, This equation is used in the CWA database [4] in the form
A = K1 Q (In C1 -In Co) Equation 4,
Where: K1 = I / (k. d. n)
The constant K1 represents the performance of the bed in tenns of pollutant removal and is
characteristic of its design and operation. Hence it would be desirable to determine the value of K1 from empirical data for C0, C1 and Q, in order to compare different designs and modes
of operation, In the case of the first-order kinetic model, the value of K1 can be determined
from the slope of the regression line relating the appropriate measured values of pollutant concentration (In Ce1 - In C0), over a range of unit flow rates (A/Q), as shown in Equation 4, 3.2 Model Fitting in the CW A database
In the Model Selection screen, the user can select a site or group of sites with similar bed types, which contain perfonnance data for 8005 (total), 8005 (dissolved) or NH3N, Four
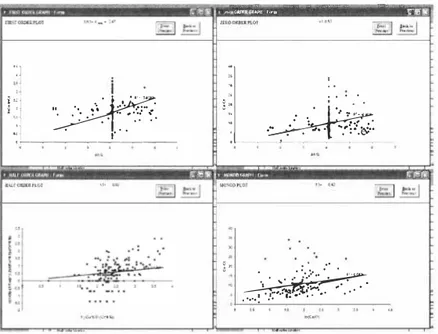
alternative models are available for fitting to such data: first order, half order, zero order and Monod kinetics (Figure 6), To be included in the model fit, samples must contain influent and effluent concentrations as well as flow rate, otherwise they are ignored, In each case, the fitted model is displayed as a graph showing all available data points, the (linear) regression line and its associated R2 value (indicating the proportion of total variation explained by the
regression) (Figure 7), The value of the reaction constant K, derived from the regression line, is given at the top of the screen (Figure 7). In the first, ha! f, and zero order models, regression lines are forced through the origin, on the assumption that change in pollutant concentration is directly proportional to flow rate,
First order and zero order models tend to give similar results, Zero order kinetics involve absolute reductions of pollutant concentration (C 1 - C0), rather than proportional declines (In
Co)-"
--
(.,� ..
'.KALMAR, SWEDEN, November 26-28, 2007
Similarly, half order kinetics uses the square roots of such concentrations, whereas Monod kinetics incorporates the sum of both proportional and absolute declines (Figure 6). Values of K are unique to the model from which they were derived. Comparisons should be made between beds or site groups, with respect to the model fitted. Values of K, in effect, summarize the overall performance of the bed over a wide range of conditions.
MODEL INFOR/tf.4 T/ON
'.!!.ack ro , iPre,iou<?i -'¼ Surface aHa (m") Q Flowrate (m' d)c�
lnt1uent concentration {m gl}c,
'Effiuent concentration (mg!)K,
Constant FIRST ORD[RK1:,;rncs HALF ORD[ R Kr:,;rncs .·L =QK
[c/
5-(
K.")" -
c
<5
+(K:) '']
'• l • C C'
Cr K,=-◊ n.,;2.2Z£RO ORD£R Kl�[TICS
�IO'.'\OD KI:,;[ TICS
A,
=K,
o[in(�')
+(
C - C.i]
Figure 6. Models available in the CWA database�
• • •.
� .. _,::• .e-�
����-
.. · ...
,...
�!,
·!�---·
·
•_.__
�
·
j �, .. ·.:;. ...OftJllll{;�<W!f ,,...., 'Z'"H ''.] ll..
I ..l
.1
!'I
"
.. •.. ,\·�
�____
r
__ _
'I • � ;t • I • • • •::
...
,�.-'�
..;.. I -� � •J
r.·.·�·=--5--�
,.- ,.··
···!..Figure 7. Modeljitsfor Leek Wootton HF tertiary sewage treatment
1 '-' ---~ �l!;£l.2',_.,,,_ • tWJOAAl11$APll f,...., !
t
u'
; a • !.: -.. ':�g•�·-i
tl �--• •.c
•
---f- __,
KALMAR, SWEDEN, November 26-28, 2007
3.3 Examples of model fits using the CW A database (sites described as Case Studies)
I . Leek Wooton: Horizontal Flow, Tertiary Sewage Treatment (269 performance records)
( Figure 7). Note in first and zero order models, records show periods of constant flow (points
where A/Q = 4. 1 ) and other periods of variable flow rates (both high and low).
2. Water Research Centre, Medmenham: Vertical Flow I st Stage, Sewage Treatment; Tertiary Nitriefication (74 perfom1ance records) ( Figure 8). Note in first and zero order models, records show almost constant flow rates (A/Q = approximately 1 3). In these cases, regression lines are barely visible, but they simply join the origin to the centroid of the points, hence the slope (and the value of K) is defined. In the other two models, constant values of Q are not a problem.
4. CONCLUSION
• CW A was fonned as a coordinating organisation within the UK water industry in response to poor design by some constructors [2].
• The CWA database has proved a useful tool to the UK water industry as a method of demonstrating what is possible with good design [2].
• The database has collected together basic information from more than 1 ,000 sites of which about 201 have some performance data [2].
• Case Studies are provided for 9 of the most common design/treatment applications as a method of building confidence in constructed wetland systems [2].
ACKNOWLEDGEMENTS
We are grateful to Gareth Job, who built the original database, for advice on the database models.
REFERENCES
[ I ] Brix, H., 1 999. How 'green' are aquaculture, constructed wetlands and conventional wastewater treatment systems? Water Science & Technology. 40(3), 45-50.
[2] Cooper, P,F,, 2006. The Constructed Wetland Association UK constructed wetland 0th
database, paper presented to the I !WA conference Wetland Systems for Water Pollution Control, Lisbon, Portugal, September, 2006,
[3] Cooper, P.F., Job, G.D., Green, M. B., Shutes, R.B.E., ( 1 996). Reed Beds and Constructed
Wetlands for Wastewater Treatment. WRc Swindon, UK. pp202.
[4] CWA, 2006. Constructed Wetland Interactive Database Version 10.0 I , June 2007, available from Constructed Wetland Association UK (with membership) www.constructedwetland.org.
[5] EPA, I 988. Constructed wetlands and aquatic plant Jystems for municipal waste water
treatment: Design Manual. US EPA Publication 625/1 -88/022, Centre for Environmental
Research Information, Cincinnati, OH 45268, pp83.
[6] Job, G.D., Green, M. B., Cooper, P,F,, 1 996, Reed Beds and Constructed Wetlands for
Wastewater Treatment, WRc Swindon, UK. June 1 996 CD Rom containing data from 1 54
sites.
[8) Kickuth, R., 1 98 1 . Abwasserreinigung in Mosaikmatrizen aus anaeroben und aeroben Teilbezierken. Grundlangen der Abwasserreiningung. GWF Schriftreihe Wasser-Abwasser,
1 9, Oldenburg Verlag, Oldenburg.
[9) Kowalik, PJ., Mierzejewski, M., Randerson P.F., Williams H.G., 2004. Performance of Subsurface Vertical Flow Constructed Wetlands Receiving Municipal Wastewater. Archives of Hydro-Engineering & Environmental Mechanics, 5 1 ( 4 ), 349-3 70.
[ I OJ Nutall, P.M., Boon, A.G., Rowell, M.R., 1 998. Review of the Design and Management of Constructed Wetlands. CIRIA PubL London UK. 62-67.
[I I ) Verhoeven, JTA., Meuleman, A.F.M., 1 999. Wetlands for wastewater treatment: opportunities and limitations. Ecol. Eng. 1 2, 5- 1 2.
[ 1 2) Vymazal, J., Brix, H., Cooper, P.F., Green, M.B., Haber!, R., 1 998. Constructed
Wetlands for Wastewater Treatment in Europe. Backhuys Pub!., Leiden, The Netherlands. pp366,