The Role of Consumer
Amenities to Human Capital
in Sweden
A study on how consumer amenities affect the change
in share of highly educated people in Swedish
municipalities.
BACHELOR
THESIS WITHIN: Economics NUMBER OF CREDITS: 15 ECTS
PROGRAMME OF STUDY: International
Economics & Policy
AUTHORS: Arvid Ek and Mohsin Waris JÖNKÖPING May 2017
i
Bachelor Thesis in Economics
Title: The Role of Consumer Amenities to Human Capital in Sweden Authors: Arvid Ek and Mohsin Waris
Tutors: Charlotta Mellander and Emma Lappi Date: May 2017
Key terms: Human capital, Highly educated individuals, Consumer Amenities, Urban Amenities, Economic Growth, Service Diversity.
Abstract
Municipalities in Sweden need to find ways to attract human capital to address their long-term economic needs. Over the last two decades, scholars have pointed out that consumer amenities have become one of the key determinants of labor attraction. The purpose of this thesis is to find out if consumer amenities play a role in the locational choices of highly educated individuals in Sweden. Variables aiming to capture consumer amenities have been examined to see if they significantly relate to the variations in change in the share of highly educated across Sweden’s 290 municipalities. These variables were tested together with a base equation of independent variables using a series of OLS regressions aiming to capture what factors influence the location choices of highly educated. The findings of our paper are in line with the theories and supports that a municipality with a higher level of Consumer Amenities will attract and retain a higher share of Highly Educated individuals. Our results also support the theory, that economic opportunities do have a primary role in attracting the highly educated.
ii
Table of Contents
1. Introduction ... 1
1.1 Purpose ... 2
1.2 Limitations ... 2
1.3 Disposition of the Thesis ... 3
2. Literature Review ... 4
2.1 Human Capital for Regional Economic Growth ... 4
2.2 Urban Amenities as a General Concept ... 5
2.3 The Role of Consumer Amenities to Human-capital ... 6
3. Formulation of Hypotheses ... 11
4. Methodology and Data ... 13
4.1 Empirical Model ... 13 4.2 Variables ... 14 4.2.1 Dependent Variable... 14 4.2.2 Independent Variables ... 15
5. Empirical Results ... 18
5.1 Descriptive Statistics ... 18 5.2 Correlation Analysis ... 19 5.3 Regression Analysis ... 196. Analysis of Results ... 22
7. Conclusion ... 26
List of References ... 27
Appendix ... 32
iii
Tables
Table 1: Variables, definitions and expected signs ... 11
Table 2: Municipalities with highest and lowest change in share of highly-educated, 25-64 years old, between 2008-2015 ... 15
Table 3: Descriptive Statistics ... 18
Table 4: Correlation with dependent variable ... 19
Table 5 Regression Results ... 20
Appendix
Appendix 1: Correlation Matrix ... 32Appendix 2: Equation with VIF ... 33
Appendix 3: Restaurant Variable Specification ... 33
Appendix 4: SNI 2007 Codes ... 34
1
1. Introduction
Over the recent decades, there has been a dramatic increase in the influx of highly educated workers in large cities. The migration of this highly skilled labor was conventionally associated with the gains in productivity that cities provide (Baker, 2016). However, over the last two decades, scholars such as Florida (2000), Glaeser (2000) and Clark (2004) have pointed out that consumer amenities have become one of the key determinants of labor attraction. As income for individuals with higher-education increases, the demand for goods, and especially luxury products, increases. Therefore, the availability of a wide variety of goods and services has become one of the key factors for attracting highly educated. Glaeser et al (2000) argued that the future of cities increasingly depends on whether they are an attractive place to live. Quality of life would therefore become more important to these increasingly rich workers in the future, influencing their choice of location. With the on-going globalization and the importance of amenities gaining significance, classic urban theories are losing relevance in urban development policies (Clark, 2002).
Amenities are a wide concept and there is a great deal of attributes that can be defined as amenities. Glaeser (2000) define four types of urban amenities that are important for the development of a region. The first category is the variety of goods and services, i.e. products and services that an individual can consume, which is also specified by most of the prominent scholars such as Florida (2000), Glaeser (2000) and Clark (2002) in their explanation of urban amenities. Second is the aesthetic and physical settings, for example the architecture of a city or climate. Third is public services such as schools, health care and emergency services. The fourth is speed, which refers to transportation, infrastructure and ability to move around within the metropolitan area. Less congested roads and a good public transportation system can be a way to improve this. Among the four categories of urban amenities, consumer amenities being one of the key ingredient for attracting the highly-educated, will be the focus of our study. Our paper will investigate if there is a relation between the level of consumer amenities and the change in the share of highly-educated workers in Swedish municipalities. Consumers today are willing to pay a higher residential price to have access to the amenities available in the city. The salary of an individual might be higher in a large city, but the high cost of living in the city makes the real income much lower. This together with the polluted air, a higher crime rate and population density is the price people are willing to pay
2
to live in a city (RTK, 2008). According to Glaeser (2000), there is a "penalty fee"1 which he
refers to as the premium that individuals are willing to pay to have access to the wide range of amenities that a city offers.
In Sweden, around 26% of people aged 25-64 are considered highly educated, which implies that they have three or more years of post-secondary education. A great portion of these highly education individuals live in the urban areas. Out of the top ten municipalities with the highest share of highly educated individuals, seven are in the Stockholm region (Statistics Sweden, 2012). Recent statistics show that 60% of the highly-educated live in Sweden's three largest cities: Stockholm, Gothenburg and Malmö (Statistics Sweden 2015, Mellander 2016).
Almost every other municipality in Sweden has a net outward migration whereas Stockholm has the largest positive net inward migration of the highly-educated (VG- Regionen, 2012). This consistent trend of human capital flight to larger cities is quite alarming for many of the small and medium sized municipalities in Sweden and subsequently policy makers are showing great interest in determining ways to retain and attract their share of well-educated workers. Mellander & Florida (2007) conducted a study for Swedish regions; concluding that universities, amenities or service diversity, openness, and tolerance affect the distribution of human capital. This brings us to the question of this paper, if there is a relation between the level of consumer amenities and the share of highly educated individuals in Swedish municipalities.
1.1 Purpose
The purpose of this thesis is to find out if there is a relation between the level of consumer amenities and the change in the share of highly-educated workers in Swedish municipalities. We are interested in examining how consumer amenities influence the highly-educated individuals' choice of location. As the developed economies have increasingly become knowledge based, ways to attract highly educated individuals has become highly important and represents a serious challenge to policy makers (Florida 2000).
1.2 Limitations
Among the four urban amenity categories described by Glaeser (2000), we have limited ourselves to the diversity of goods and services category, which we refer to as Consumer
1 Glaeser (2000) describes this as the difference between income and housing cost. The lower real wage because
3
Amenities. The other urban amenities will be used as control variables together with variables that measure economic opportunities in a region. Digital commerce is practically accessible across all parts of the country; therefore, we focus our research specifically on the goods and services fixed to a specific location. These include amenities such as availability to theatres, operas, sport complexes, shopping malls and stores, restaurants and other entertainment arenas. When referring to human capital which is our dependent variable, we will restrict our research to human capital as the share of individuals with three or more years of higher education.
1.3 Disposition of the Thesis
The thesis will be organized into six sections. Section 1 provides a background and overview of the topic. In section 2, we will present the existing theories and research done on the topic, covering diverse literature on the importance of consumer amenities. Section 3 will present the hypotheses based on the previous literature. In section 4, we will construct our methodology with required details of our choice of method and present our data. In section 5, we will present the empirical results, describing the relationship between the level of consumer amenities and the share of highly educated people. In section 6, we will analyse our results with our hypotheses. In the seventh and the last section, we will draw conclusions and suggest further possible research on the topic.
4
2. Literature Review
The literature review will first cover studies that highlight the importance of human capital for regional growth. This is followed by a description of the theoretic idea on amenities and types of urban amenities in general. Finally, we will provide an overall insight on the latest knowledge and perspectives on the role of consumer amenities in increasing the share of highly-educated people.
2.1 Human Capital for Regional Economic Growth
Several empirical studies have analyzed the role of human capital for regional growth. Simon (1998) and Glaeser et al (1995) are among those who found a positive relationship between human capital and regional growth, encouraging urban planners to identify methods and resources to attract highly educated and skilled workers. There are diverse viewpoints on what influences the geographical distribution of highly-educated workers within a certain region. Sjaastad (1962) was first to come up with the theory of maximizing returns of human capital, arguing that a worker chooses the destination which maximizes the present value of lifetime earnings, taking the costs and benefits of migration into consideration. Roback (1982 and 1988) and Greenwood (1997) later pointed out that migration theories based on the human capital approach is not the exclusive reason for migration. It was rather also the increasing change in demand for amenities that lay behind it.
The OECD economies are increasingly based on knowledge and information. Knowledge is now recognized as an important driver of productivity and economic growth, leading to a further emphasis on the role of information, technology and learning in economic performance (OECD, 1996). Since Florida presented his report2 in 2000 and
respectively his best-selling book 'The Rise of Creative Class' in 2002, recognition of how cities are transforming into knowledge cities gained tremendous significance. Florida mainly emphasized on how the quality-of-place in terms of natural, recreational, and lifestyle amenities are vital in attracting knowledge workers and in supporting leading-edge high-technology firms and industries. According to Glaeser (2006), over the last two decades there has been a remarkable increase in the importance of knowledge in the economy and the biggest, densest cities appear to have a comparative advantage in facilitating the flow of knowledge.
5
Shapiro (2006) using Census data from 1940 to 1990 to show that metropolitan areas rich in human capital tend to experience faster growth in wages, rental prices, and housing prices. The effects on rents and house values are much larger than the effect on wages. He also concludes that while the employment growth effects of college graduates are due to improvements in productivity, roughly one third of the effect seems to come from rapid improvements in quality of life. He further states that the most prominent measures of quality of life factors are the “consumer city” amenities such as bars and restaurants rather than more politically mediated amenities such as crime, schools, and pollution. Kahn (2008) argued in his paper on urban economics that the composition of a city's economic activity also plays a key role in determining the supply of quality of life. He argues that if a region can attract highly educated individuals, then a vicious circle starts to set off. Highly educated people earning more income, will subsequently attract finer restaurants and other urban amenities.
2.2 Urban Amenities as a General Concept
Ezzet (2006) reviewed the models used by labor economists such as Hicks (1932) and Sjaastad (1962), who employed micro-level analysis in migration studies with the assumption that individuals are utility-maximizing agents. She argued that these models are estimated using the framework of income maximization, focusing only on the economic dimensions of migration and they tend to ignore the possibility that regional urban amenities may also be included in the utility function. Clark (2004) also emphasizes the basic economics that people maximize utilities, not only income, and that utility consist of both income and amenities.
Regions that attract highly educated and high-earning households tend to experience high demand for housing, especially from people willing to pay extra to live there (Florida, 2008). Glaeser (2000) created an equation to explain the relationship between wages, rents and amenities. His equation explains that the effect of cities on wages (productivity premium) plus the effect of cities on quality of life (amenity premium) must be offset by the effect of cities on housing rents (rent premium). This means that the higher rents compared to wages in cities is explained by the increased amenity level in cities. This also implies that we can measure the amenity premium of a city by looking at the differences between the urban wage premium and the urban rent premium.
6
There are different ways in which urban amenities can be described and accounted for. Various scholars have defined amenities in their own different ways. Brueckner et al. (1999) categorized three different types of amenities in explaining location patters of the highly-educated. First, natural amenities, generated by an area’s topographical features, including rivers, hills, coastline, etc. Second, historical amenities, generated by monuments, buildings, parks, and other aesthetic characteristics. And the third, modern amenities or consumer amenities which include restaurants, theaters, and modern public facilities such as swimming pools and tennis courts. Later, Glaeser et al. (2000) further categorized urban amenities into four groups and included two further categories apart from the natural, historical and modern amenities. First, they took public service amenities such as schools and hospitals into account and the second group they introduced was the ease and speed of mobility in an urban area. Clark (2004) went further and even included population's socioeconomic structure and diversity and as well as the attitudes of the population, especially features such as broad-mindedness, the willingness to take risks and individualism under his group of urban amenities.
2.3 The Role of Consumer Amenities to Human-capital
Since 2000 and onwards, prominent urban studies scholars have pointed out the importance of consumer amenities in attracting the human capital to large urban areas. R. Florida who has a major influence on urban planning in the US has done substantial work on the impact of amenities in attracting the skilled class, arguing that if cities want to succeed they need to think about providing lifestyle and consumption advantages to their inhabitants. He also acknowledges the idea that both economic opportunities and lifestyle qualities are required to attract and retain talent. Further on, he differentiates amenities as old and new economy amenities. He defines the old economy amenities as sports, the fine arts (e.g., opera, classical music, and the theater), and cultural destinations (e.g., museums and art exhibits) and highlighting the new economy amenities generally as outdoor recreational activities and lifestyle amenities (Florida, 2000).
Subsequently, later in 2002 and 2005, he focused more on how the creative class as in
technology workers, artists, musicians, lesbians and gay men along with tolerance levels are vital for regional development instead of just taking human capital into account. Harvard economist E. Glaeser, was critical of this narrative and performed statistical regression on the same data set, noting that it is rather the level of education that affects the economic growth of a region than the presence of creative class or the bohemians as referred by Florida.
7
Although he does acknowledge that there is a high correlation between human capital theory and Florida's concept of creative capital. Hoyman and Faricy (2008) also performed a similar test and concluded that the "creative class" does not explain the higher incomes and increased employment opportunities in a region rather it's the human capital that predicts economic growth.
Gates et al. (2000) provides additional evidence of the link between amenities and knowledge workers. The findings indicate that a correlation between amenities and knowledge-intensity tends to be highly positive for knowledge workers (measured as the percentage of the population with bachelors and graduate degrees) and negative for others (measured as percentage of the population with high school degree or less). Glaesers (2000) also talks about how high-amenity cities have grown faster than low-amenity ones. Urban rents have increased faster than urban wages, indicating that higher real wages are not the reason people move to cities. Cities' success relies more heavily on their role as "centers of consumption." As incomes rise, individuals will demand more “normal goods”, but especially more “luxury goods”. Large urban markets also increase the welfare for high-income consumers as goods which appear to have substantial scale economies, as baseball teams, operas and niched restaurants can operate. Glaeser (2006) later talks about how the city has resurged since the post war period and list two main reasons for this. First, negative amenities connected to cities such as high crime rates have declined, and secondly rising incomes and education level has made the demand for consumer amenities such as museums, restaurants, and concerts much higher.
In 2003, Glaeser and Saiz concluded that cities grow because they become more economically productive and less because of rising amenities. The study showed different results on the metropolitan and on the city level. At the metropolitan level, their available evidence show that skills predict growth in productivity rather than the availability of amenities. At the city level, attention is paid to raising the amenity level as a way for declining central cities to begin attracting these skilled human capital workers. Heuer (2004) also found a weak relationship between university graduates and quality of life. He further argues that recent graduates tend to migrate to urban areas, while among those recent graduates who are married, or have children, and those who grew up in small towns plus the older graduates are associated with migration to non-urban areas.
Hanson et al. (2003) study of migration of college graduates in the Pittsburgh region came up with similar results as Glaeser and Saiz (2003). Amenities may play an important role on the margin when some college graduates make their career decision. They also suggest
8
consumer amenities such as cultural activities, nightlife, and participatory sports may especially appeal to recent graduates. Gottlieb (2004) finds that compared to older workers, young workers migrated more often to high amenity, high human-capital metropolitan areas during the 1990s. He also points out the importance of amenities when highly educated chose their location. As both Glaeser and Saiz (2003) and Hanson et al. (2003) have the same consensus that amenities are not everything, they argue that it matters more for individuals with high human capital. This is because they tend to be more mobile and more likely to shop for place-specific goods than others. Amenity strategies can therefore complement human capital strategies for economic growth.
Clark (2004) says that college graduates are more likely to locate in areas with fewer natural amenities (lakes, weather, etc.) and more constructed amenities (museums, sports facilities, research libraries, etc.). Conversely, elderly seek natural amenities and locate relatively more in such areas. Interestingly he also finds that residents filing for high tech patents live in locations with both a high rate of natural as well as constructed amenities.
Chen and Rosenthal (2008) suggest that cities with improving business environments acquire increasing shares of workers, especially workers with high levels of human capital. However, they argue that cities with improving consumer amenities become relatively more populated by retired people than by young individuals.
Gottleib and Joseph (2006) studied the college-to-work migration decisions of technology graduates and holders of doctorates within in the US using detailed individual data on migration with relevant characteristics. Testing at the metropolitan level they concluded that technology graduates migrate to educated areas. Also, they found that PhD graduates respond more to amenity characteristics than other degree holders. The foreign students from immigrant groups also tend to migrate to place where the concentration of these groups is high.
Mellander and Florida (2007) examined the measurements of human capital and the factors that shape and affect the geographic distribution of human capital and the creative class across 81 Swedish regions. They found that universities, amenities or service diversity, openness and tolerance affect the distribution of human capital. It indicated that universities play the most significant role. Their findings also indicate that the creative class measures outperform the conventional educational attainment measure, in the case of Sweden.
Further, there is a trend of highly-educated power couples moving to larger cities, where both have high-powered careers especially in politics and entertainment. Costa and Kahn (2000) identified job market co-location problem as a supporting factor to the increasing
9
concentration of highly-educated couples in large cities. They also argued that regardless of marital status, dual-career households tend to move to places with favourable business surroundings, providing opportunities to resolve job market co-location problems. Compton and Pollack (2007) found no support for this hypothesis, and instead suggested that the rising concentration of highly educated couples in large cities has more to do with the greater opportunity for highly educated singles to meet in large metropolitan areas which have a significant presence of bars and other social-networking arenas.
Latterly, studies by Brown and Scott (2012) mentioned that with the increasingly higher salaries for the highly-educated workers, the marginal benefit of non-monetary factors such as amenities relatively increases in value. Although, they also argued that while amenities are becoming a key factor for attracting the highly-educated, the economic advantages remain as the primary factors of attraction. Moretti (2012) suggests that cities having high-level of amenities does not guarantee large share of highly-educated workers and firms, with giving example of many former manufacturing capitals in US.
More recent, Backman and Nilsson (2016) examined the role played by built heritages and cultural environments alongside other location specific natural and economic factors in attracting human capital in Sweden. They found a positive relation between local presence of cultural heritage and change in share of highly educated individuals across Sweden. Their findings also suggest that several location specific factors such as presence of institutions of higher education and climate also play an important role in explaining change in share of human capital.
Considering the previous research in relation to urban amenities, we observe that scholars have used diverse measures of amenities when conducting their research. With the presence of diverse measurements of urban amenities to test the relationship, it is hard to associate our empirical test of 'consumer amenities' strictly in contrast with the previous studies. Likewise, the use of the conventional human capital measure or the creative class also gives different results when analyzing the impact on regional growth. Andersen et al. (2006) tested Florida's creative class concept in the sense of the Nordic labor market and argued that the Nordic regions differ substantially from the US, with the US having several larger cities while the Nordic regions have one dominating capital city. Also, labor unions are stronger and wealth distribution is much more equal making highly-skilled workers less mobile.
Our literature review suggests, overall, that apart from economic opportunities, amenities are also becoming increasingly significant in attracting and retaining highly educated people. Along with this, it is also clear from the literature reviewed, that while the chief reason in
10
attracting human capital are economic factors, amenities appear to play a somewhat secondary role. We also expect that although urban amenities altogether have a significant influence in attracting and retaining human capital, the four categories of urban amenities, independently, might play a limited role. Due to this we will analyze specifically how big of a role consumer amenity factors play in Swedish municipalities, while controlling for other urban amenities and economic opportunities.
11
3. Formulation of Hypotheses
Based on the literature review, we expect that the level of consumer amenities will have positive correlation with the change in share of highly educated individuals. Consumer amenities include essentially anything that an individual can consume in form of goods and services as well as recreational and outdoor activities that a person can experience. Fel!
Hittar inte referenskälla. below summarizes how all our independent variables would
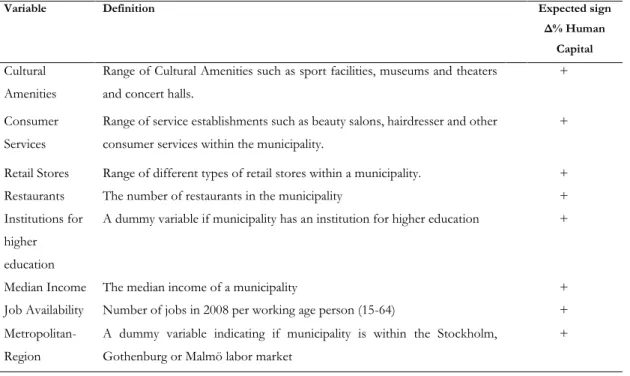
influence the share of highly educated, based on theory presented in the previous section. Table 1: Variables, definitions and expected signs
Variable Definition Expected sign
Δ% Human Capital
Cultural Amenities
Range of Cultural Amenities such as sport facilities, museums and theaters and concert halls.
+
Consumer Services
Range of service establishments such as beauty salons, hairdresser and other consumer services within the municipality.
+
Retail Stores Range of different types of retail stores within a municipality. +
Restaurants The number of restaurants in the municipality +
Institutions for higher education
A dummy variable if municipality has an institution for higher education +
Median Income The median income of a municipality +
Job Availability Number of jobs in 2008 per working age person (15-64) +
Metropolitan- Region
A dummy variable indicating if municipality is within the Stockholm, Gothenburg or Malmö labor market
+
According to theory, higher education levels and incomes have increased the demand for other outdoor-oriented lifestyle and recreational amenities such as museums, concerts halls, sports arenas, amusement parks etc. Therefore, we expect that the presence of a wider range of entertainment and cultural amenities should attract more highly educated individuals. Hence, our first hypothesis:
H1: “Municipalities with a higher variety of entertainment and recreational options in form of
consumer amenities will have a higher change in share of highly educated individuals”
According to several prominent scholars (Florida 2000, Glaeser 2000, and Clark 2002), the diversity of goods and services play an important role in cities and especially for high income individuals. As highly educated individuals in general have a higher income they
12
demand more “normal goods”, especially “luxury goods”. Therefore, we expect that a municipality with wider range of consumption opportunities in form of diverse retail businesses will attract more highly educated individuals. Our two consumer amenities variables, Consumer Services and Retail Businesses, are used to test this hypothesis.
H2: “Municipalities with a wider diversity of consumption opportunities will have a higher change
in share of highly educated individuals”
According to the theory, restaurants and night life establishments in form of bars and clubs also have a great impact in attracting the high income educated people. Therefore, we expect that municipalities with a higher variety of restaurants and bars will attract more highly educated people. Hence, our third hypothesis:
H3: “Municipalities with a higher number of Restaurants and other night-life activities will have a
13
4. Methodology and Data
This paper will examine whether there is a relation between the level of consumer amenities and the change in share of highly educated people in Swedish municipalities. We will use data from Statistics Sweden for our dependent variable 'Human Capital' and the SNI Swedish Standard Industrial Classification 2007 register for our independent variables within consumer amenities to test our hypotheses empirically. The other sources of data for our control variables are mentioned under the respective variable’s section. The data set we are using is from the years 2008 and 2015 respectively. We are examining all the 290 municipalities of Sweden, which have a responsibility for providing a significant proportion
of all public services including schools, social services and care of old people (SKL, 2017).
4.1 Empirical Model
The statistical model explains a specific mathematical linear relationship between the independent variables and the dependent variable being tested. This model helps us to avoid reverse causality issue as our dependent variable is the change between two time periods (2008-2015) whereas the independent variables are based on one single given time (2008). Implying that a change in Human Capital levels between these periods cannot affect our independent variables back in 2008. Following is the linear multiple regression model suitable for our empirical analysis:
Δ % Human Capital (2015 – 2008) = β0 + β1 (Cultural/Recreational Amenities) + β2 (Consumer
Services) + β3 (Retail Business) + β4 (Restaurants) + β5 (Institutions for Higher Education) Di +
β6 (Median Income) + β7 (Job Availability) + β8 (Metropolitan Region) Di + ε
Changes in human capital between 2008 and 2015 will be examined over all 290 Swedish municipalities using regression analysis. All independent variables are constructed with data from 2008, and the dependent variable show the change between the years of 2008 and 2015, this implies that we are using cross-sectional data. All independent variables show a linear relationship when plotted against the dependent variable. Therefore, we have chosen an ordinary least square regression as our econometric method.
14
To avoid multicollinearity problems, Person correlation coefficients (Appendix 1) and VIF values (Appendix 2) were inspected. When controlled for, multicollinearity issues were found between several of the independent variables. To solve this problem, we choose to run the Consumer Amenity variables independently along with a “base equation” of control variables. This issue is further discussed in section 5.
To test the legitimacy of the results a residual analysis was performed. We did not find any problem with heteroscedasticity. Normal distribution shows a mean value of zero, and standard deviation of 0.990. The regression seems to fit the data well as shown in Appendix 5.
4.2 Variables
4.2.1 Dependent Variable
Our dependent variable is the change in the share of highly educated individuals within a municipality between the years 2008 and 2015. This is constructed by subtracting the share of highly educated within the municipality in 2008 from the share in 2015. The variable is logged to assure normal distribution. In this paper, Human Capital is defined as the share of population with an educational attainment of at least three years of education from institutes of higher education. This is also the most conventional way of measuring human capital. The data from Statistics Sweden includes all highly-educated individuals within the age range of 25 – 64 for the years 2008 and 2015. Below in Table 2 we present the municipalities with the highest and the lowest change in human capital between 2008 and 2015. During this time-period, Lomma has experienced the highest change with 8.23% and Arjeplog the lowest with 0.41%. The common denominator for the municipalities with the highest change in the share of highly educated is that they are all located next to what is referred to as a main or principal municipality within their labor market, based on the FA definitions from Statistics Sweden.
15
Table 2: Municipalities with highest and lowest change in share of highly-educated, 25-64 years old, between 2008-2015
Municipalities
(Highest) ∆% of Highly Educated Municipalities (Lowest) ∆% of Highly Educated
Lomma 8.23 % Arjeplog 0.41 % Hammarö 7.27 % Munkfors 0.64 % Habo 6.34 % Norberg 0.76 % Härryda 6.02 % Bjurholm 0.85 % Staffanstorp 5.73 % Härnösand 0.90 % Solna 5.67 % Årjäng 1.09 % Lerum 5.59 % Boden 1.10 % Partille 5.49 % Övertorneå 1.11 % Vellinge 5.43 % Orsa 1.17 % Huddinge 5.09 % Sollefteå 1.22 %
Source: Statistics Sweden 2015
4.2.2 Independent Variables
Consumer amenities, economic opportunities and other location specific factors are selected as the independent variables in our model. The variables “Cultural & Recreational Amenities, Consumer Services, Retail Stores and Restaurants” are formed to represent consumer amenities. Several control variables are used to capture other factors influencing the locational choices of highly educated. Control variables such as Median Income and Job Availability are used to reflect the impact of economic opportunities in a region. Other location specific factors i.e. the presence of an institution for higher education or being located in the same labor market as Stockholm, Gothenburg and Malmö are used to capture the attributes of every individual municipality that can affect the location choice of highly educated individuals.
Consumer Amenity Variables:
Cultural & Recreational Amenities Consists of several different cultural amenities, such
as sport facilities, amusement parks, theaters, and museums. The variable is based on information from the SNI 2007 codes published by Statistics Sweden and calculated by counting which of the industry code categories are present in the municipality. Categories of cultural and recreational amenities that fall under this variable are included in the Appendix 4.
16
Consumer Services Consist of a range of different establishments offering services such
as hair dressers, beauty salons and other personal service establishments. They are mostly small focused businesses operating with only few employees. The services a service-based business offers are not like the physical product you can buy at retail stores, such as clothing or food items but instead services that are primarily composed of personal capabilities and labor to deliver the desired service. The data is from Statistics Sweden for the year of 2008 using various SNI 2007 industrial codes. Categories that fall under Consumer Services’ variable are included in the Appendix 4.
Retail Stores Consist of a range of different types of small retail stores in the municipality
and the data is taken from Statistics Sweden for the year 2008. The establishments covered are mostly specialised stores, as well as other grocery, drug and convenient stores. This variable is constructed by counting the categories of different retail stores that are present in a municipality out of the total retail stores classifications present in SNI 2007 industrial codes. The industrial codes are presented in Appendix 4.
Restaurants The variable is calculated to reflect the number of restaurants, bars and
nightclubs in a municipality. Numbers are taken using SNI 2007 industrial codes from Statistics Sweden which shows the total combined sum of the number of restaurants, bars and nightclubs within each municipality. This variable is created using intervals of 5 specifications, where 1 is the lowest number of restaurants and 5 the highest. Appendix 3 shows the different intervals that constructs the variable.
Control Variables:
Institutions for Higher Education Dummy variable that indicates if the municipality has
an institution for higher education or not. It is measured by taking the day-time population working at these establishments within each municipality. A municipality with 50 daytime employees or more is then indicated as a municipality that has an institution for higher education.
17
Median Income The median income has a significant relationship with the level of
educational attainment in most of the regions within EU, Eurostat (2014). This variable takes median income in SEK in each municipality in 2008. The data is from Statistics Sweden.
Job Availability Is the sum of people that are gainfully employed and reside in the
municipality at night, divided by the total population (aged 15-64) in 2008. Data for this variable is from Statistics Sweden. The variable is intended to capture economic opportunities of the municipality, something that according to Brown and Scott (2012) is the most important factor when highly educated decide on where to reside.
Metropolitan Area Dummy variable that indicates whether a municipality is within the
same labor market such as Stockholm, Gothenburg and Malmö. According to the theory, large urban markets also increase the welfare for high income consumers with access to goods which appear to have substantial scale economies such as sport teams, operas and niched restaurants.
18
5. Empirical Results
5.1 Descriptive StatisticsThe percentage change in the share of highly educated people has increased between 2008 and 2015 in every Swedish municipality at an average of 2.75 percentage units. The change in human capital differs a substantial amount between municipalities, with ‘Arjeplog’ municipality having the lowest change of 0.42% and ‘Lomma’ municipality having the highest change with 8.24%. Municipalities with the highest change varies more from the mean than the municipalities with the lowest change. Table 3 presents the descriptive statistics for both dependent and independent variables. The independent variables aim to explain some of the variations in the dependent variable.
Table 3: Descriptive Statistics
Variables Minimum Maximum Mean Std. Deviation
∆% of Highly Educated 0.0041 0.0824 0.0275 0.0111
Cultural & Recreational Amenities 1 12 6.34 2.293
Consumer Services 0 4 1.80 1.294
Retail Stores 6 58 31.89 12.5
Restaurants 1 5 2.96 1.44
Institutions for higher education 0 1 0.13 0.334
Median Income 203.6 338.4 247.96 17.337
Job Availability 0.5840 0.8194 0.7374 0.0350
Metropolitan Area 0 1 0.29 0.454
N=290;
Source: Statistics Sweden 2017, SMHI 2017
The Consumer Amenity variables: Cultural & Recreational Amenities, Consumer Services and Retail Stores are based on information from the SNI 2007 codes published by Statistics Sweden and calculated by counting which of the industry code categories are present in a municipality. The maximum of each variable shows the most number of categories present in a municipality under that respective variable, with some municipalities having as low as none as in Consumer Services for instance. The Restaurants variable was created using five intervals from the aggregate number. The mean value 2.96 indicates that most of the municipalities have restaurants at interval 3 which is around 21-30 number of restaurants, bars and clubs.
19
5.2 Correlation Analysis
The bivariate correlations between the dependent and the independent variables are provided below in Table 4. All independent variables show a significant correlation at a 1 percent level with the dependent variable. All variables are positively correlated as expected according to theory. Median Income shows the strongest correlation with dependent variable at 0.517, and Cultural & Recreational Amenities shows the lowest correlation at 0.292.
Table 4: Correlation with dependent variable
Variable ∆% Highly
Educated
Cultural & Recreational Amenities 0.292**
Consumer Services 0.414**
Retail Stores 0.356**
Restaurants 0.345**
Institutions for Higher Education 0.243**
Median income 0.518**
Job Availability 0.345**
Metropolitan Area 0.369**
** Significant 1% level N=290
Source: Statistics Sweden 2017, SMHI
When looking at Appendix 1 which shows the bivariate correlations between the independent variables, we can see that there is strong significant correlation between the Consumer Amenities’ variables. This indicates that there could be a multicollinearity problem in the regression analysis between these variables. 3
5.3 Regression Analysis
To examine the determining factors of change in share of highly educated, we used different combinations of independent variables. Because of the high correlations between the variables, they were first tested together in order to look at the VIF values. This regression is showed in Appendix 2 and shows high VIF values especially for the Retail Stores and Restaurants variables. In order to avoid the multicollinearity issues, we created something we
3 In an earlier version of this paper, we used Population Density as a control variable. As several of our
independent variables were correlated with this variable it was later removed from the regressions. The high correlation, especially with other consumer amenity variables led us to believe that they do explain similar variation in our dependent variable.
20
refer to as a base equation. The base equation consists of four control variables, namely Institution for Higher Education, Median Income, Job Availability and Metropolitan Area. We then test each consumer amenity variable independently against this base equation to see how they separately affect the variables in the base equation and our dependent variable. This can be seen in Table 5 starting with Cultural & Recreational Amenities referred to as Equation 1.
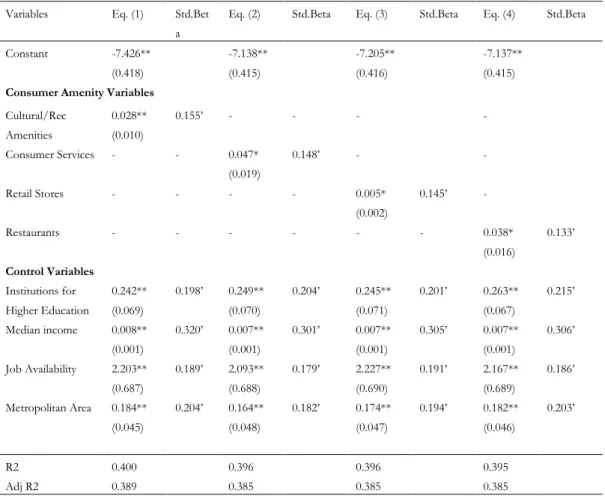
Table 5 Regression Results
Variables Eq. (1) Std.Bet a
Eq. (2) Std.Beta Eq. (3) Std.Beta Eq. (4) Std.Beta
Constant -7.426** (0.418) -7.138** (0.415) -7.205** (0.416) -7.137** (0.415) Consumer Amenity Variables
Cultural/Rec Amenities 0.028** (0.010) 0.155’ - - - - Consumer Services - - 0.047* (0.019) 0.148’ - - Retail Stores - - - - 0.005* (0.002) 0.145’ - Restaurants - - - 0.038* (0.016) 0.133’ Control Variables Institutions for Higher Education 0.242** (0.069) 0.198’ 0.249** (0.070) 0.204’ 0.245** (0.071) 0.201’ 0.263** (0.067) 0.215’ Median income 0.008** (0.001) 0.320’ 0.007** (0.001) 0.301’ 0.007** (0.001) 0.305’ 0.007** (0.001) 0.306’ Job Availability 2.203** (0.687) 0.189’ 2.093** (0.688) 0.179’ 2.227** (0.690) 0.191’ 2.167** (0.689) 0.186’ Metropolitan Area 0.184** (0.045) 0.204’ 0.164** (0.048) 0.182’ 0.174** (0.047) 0.194’ 0.182** (0.046) 0.203’ R2 0.400 0.396 0.396 0.395 Adj R2 0.389 0.385 0.385 0.385
** Significant at 1% level * Significant at 5% level; N= 290 for all variables (.) -Standard Deviation in parenthesis; ‘=Standardized Beta
In equation 1, the Cultural & Recreational Amenities variable is tested against the base equation and shows a significant positive relationship with the dependent variable at a 1 percent level. The model has an adjusted R2 of 0.389 which is the highest of all equations. All variables in the equation except Metropolitan Area are significant at a 1 percent level.
21
According to the standardized beta values the strongest predictor of the model is Median Income at 0.320 and Cultural Amenities the weakest at 0.155.
In equation 2, the Consumer Services variable is tested with the base equation and shows a significant positive correlation at a 5 percent level. The model has an adjusted R2 of 0.385 and all variables show a significant positive relationship with the dependent variable. All other variables are significant at a 1 percent level. Median Income is still the strongest predictor according to the standardized beta values at 0.301. The weakest predictors are Consumer Services and Metropolitan Area that both have a standardized beta value of 0.148. In Equation 3, the Retail Stores variable is tested with the base equation and shows a significant relationship to the dependent variable at 5 percent level. The model has an adjusted R2 of 0.385 and all variables show a significant positive relationship with the dependent variable. Retail Stores is significant at a 5 percent level and all other remaining variables at a 1 percent level. The strongest predictor according to the standardized beta values is still Median Income with a value of 0.305 and the weakest is now the Retail Stores variable with a value of 0.145.
In Equation 4, the Restaurants variable is tested with the base equation and shows a significant relationship to the dependent variable at 5 percent level of significance. The model has an adjusted R2 of 0.385 and all variables show a significant positive relationship to the dependent variable. Restaurants is significant at a 5 percent level and the remaining variables at a 1 percent level. According to the standardized beta values the strongest predictor in the model is still Median Income with a value of 0.306 and the weakest is the Restaurants variable with a value of 0.133.
Overall, we can see that the results do not change much between the different equations. All equations have a similar adjusted R2, the values of the base variables do not change much depending on which variable is included, and the added consumer amenity variables’ shows a relatively similar standardized beta value. This together with the high correlation between
22
the variables, indicates that they could explain almost the same variation in the dependent variable. Something that was taken into consideration in the analysis of the result.
6. Analysis of Results
In the analysis section, we will connect our hypotheses with the findings of our regression results, discussing the key variables respectively. Because of multicollinearity, the different consumer amenities variables were not tested together and instead run separately with a base equation existing of the following control variables: Institutions for Higher Education, Median Income, Job Availability and Metropolitan Area.
Cultural & Recreational Amenities
Hypothesis one states that a municipality with a greater range of Cultural & Recreational Amenities such as sport facilities, museums, theatres and other recreational activities should experience a larger positive change in the share of highly educated within the municipality. In equation 1, Cultural & Recreational Amenities are tested independently with the base variables and shows a significant positive relationship with the change in the share of highly educated at a 1 percent level. Our results are consistent with theory, such as Florida (2000) who had the same conclusion that cities and regions have a great deal to gain from developing a quality-of-place strategy and suggested that regions should invest in outdoor, recreational and lifestyle amenities. This should imply that municipalities that can provide a wider range of Cultural and Recreational Amenities will experience a greater increase in the share of highly educated individuals and thus this result gives support to our first hypothesis.
Out of the Consumer Amenity variables, the Cultural & Recreational Amenities variable seems to be the strongest one, being the only one significant at 1 percent level and having the strongest standardized beta value. Looking at the overall model we can see that Median Income seem to have the strongest relationship with our dependent variable while the rest of the variables show more equal values. The strong impact of the Median Income variable is consistent with scholars such as Brown and Scott (2012). They argue that the economical reason still seems to play the most important role when it comes to the locational choices of the highly educated. They further also argue that the importance of amenities is likely to rise with higher incomes. While the importance of Cultural & Recreational Amenities as an attractor
23
of highly educated can be discussed, our results indicate that it has relevance for municipalities trying to attract highly educated individuals.
Overall, our results can confirm the first hypothesis that a municipality with a higher variety of consumer amenities in form of entertainment and recreation options will have a higher change in share of highly educated people.
Diversity of Goods and Services
Our second hypothesis states that a municipality with diverse consumption opportunities will have a greater increase in the share of highly educated individuals. The Retail Stores variable measures the range of specialized retail stores in each municipality and is supposed to capture the presence of goods that can be consumed while the Consumer Services variable is created to capture the diversity of services that can be consumed. Both variables together give a complete picture of the presence of broad diversity of goods and services.
Consumer Services are tested in equation 2 and Retail Stores in equation 3. Both variables are significant at a 5 percent level and show a positive relationship with the share of highly educated individuals. Our results are somewhat in line with the theory that the variety of goods and services, i.e. products and services that an individual can consume, plays an important role for high-income educated people as acknowledged by Florida (2000), Glaeser (2000) and Clark (2002). Our results are also to some extent consistent with the empirical results from Mellander & Florida (2007) research which found service diversity as one of the factors in affecting the distribution of human capital. These results are also consistent with Glaeser’s (2000) theory, which states that highly educated individuals will demand more “normal” and especially more “luxury goods”.
We further see that both equations are similar, having almost the same adjusted R2 and very similar standardized beta values. This is the case for all 4 equations, while taking the high correlation between these variable into consideration this could indicate that both variables capture very similar variation in the dependent variable. Subsequently, we discuss that although an increase in Retail Stores and Consumer Services are positively associated with
24
the change in share of highly educated, Median income seem to play a more important role. Highly educated people having higher incomes on average could indirectly result in these people choosing locations that are rich in diversity of goods and services especially luxurious ones, as also acknowledged by Glaeser (2000). Taking this into consideration we argue that both Retail Stores and Consumer Services is playing a role for municipalities trying to attract highly educated, however the importance of it can be debated and examined further.
The municipalities with the greatest range of Retail Stores and Consumer Services is Stockholm, Uppsala, Malmö and Gothenburg, these are also the fourth largest municipalities’ population wise. As Glaeser (2000) also states, large urban markets increase the welfare of consumers as it enables establishments which appear to have substantial scale economies to operate, such as specialized stores. We can see in Table 1, the municipalities that had the largest change in share of highly educated individuals are not the largest municipalities’ population wise, though they are all located next to a large urban market. The location advantages of these municipalities imply that they have access to consumer amenities in other municipalities as well, an aspect that our research does not fully capture. The Metropolitan Area variable do give us some insight on this as it confirms that being within the same labor market as Stockholm, Gothenburg or Malmö has a positive impact in the change of share of highly educated individuals.
The findings of this paper confirm the second hypothesis and finds that diversity in goods and services increases the share in highly educated individuals within a municipality.
Restaurants and Nightlife
Our third hypothesis states that having more restaurants and nightlife establishments will increase the share of highly educated compared to other municipalities. This is tested in equation 4 where the Restaurant variable is tested with the base variables. This model shows the Restaurant variable significant at a 5 percent level and has a positive relationship as expected. Our result shows that greater number of restaurants, bars and nightclubs will increase the share of highly educated individuals within a municipality. This can give support to Compton and Pollack (2007) who suggest that highly educated seeks location which have
25
a significant presence of a vibrant nightlife as it increases the chances for highly educated singles to meet. Hansen et.al. (2003) say that a vibrant nightlife scene should attract newly graduates and although our results do not show such specific information, we can support that it attracts highly educated.
The data we used for our Restaurants variable was categorized by using class intervals off the aggregate numbers of establishments. This was done to avoid getting results that were fully correlated with population size. At first the variable was tested in per capita as a proportion of total establishments, however we changed our method after ending up with no linear relationship. In the SNI 2007 classification there is no differentiation between restaurant, bars and nightclubs, meaning it is only showing the aggregate number of establishments that serves food. Therefore, our research does not take into consideration the quality of the different establishment. The lack of this information, influences the quality of the results, as according to Glaeser (2000), it is the diversity of consumption and the availability of luxurious goods and services that should attract the highly educated, not the aggregate amount.
We can confirm the third hypothesis stating that municipalities with a higher number of restaurants and other night-life activities will have a higher change in share of highly educated individuals.
26
7. Conclusion
Municipalities in Sweden need to find ways to attract and retain human capital to address their long-term economic needs. Consumer amenities are becoming increasingly important for the highly-educated class when opting for their choice of location as suggested by the theories. This paper examines the role played by consumer amenities along with the other key determinants, in explaining the change in the share of highly educated people across different municipalities in Sweden. We performed OLS regressions to test predictions of the theories using the data from Statistics Sweden for all municipalities in Sweden.
A Municipality with a higher level of Consumer Amenities should result in attracting and retaining a higher share of Highly Educated individuals than other municipalities, according to the theory. The findings of our paper turned out to be in line with the theories, showing a positive relation between the change in share of highly educated and all categories of consumer amenities. Our results also support the theory, that economic opportunities do have a primary role in attracting the highly educated while amenities seem to play a secondary role. As we limited our research by taking human capital as in individuals with three years or more of higher education, this overlooks the possible increase in share of other high-skilled people who also contribute to the economy and consequently increase consumption.
In the light of the results of our paper, we should be able to advocate or suggest that increasing consumer amenities would lead to an increase in human capital across Swedish municipalities. However, locational choices for highly educated are a complex matter and many factors together explains the whole picture. Each municipality has different prerequisites and some have locational disadvantages that cannot be changed by policy making. The municipalities experiencing the highest change in highly educated individuals seem to all have a locational benefit of being located close to or within a large urban market. This implies that these municipalities share both the amenity benefits and economic benefits of the city, sharing the same labor market, infrastructure, and consumption opportunities etc. Further on, implementing a policy increasing the level of amenities in a region might not be very fruitful in the short run, and therefore should be looked as a long-term plan.
Although our results are favorable and in accordance with the major theories, taking some consideration would be beneficial when implementing new policies. We suggest that further research on how different factors can contribute in increasing the share of human capital is required on a regional/local basis, as every region has their own location specific qualities and challenges for attracting and retaining human capital.
27
List of References
Andersen, K. V., Hansen., H, K., Isaksen, A., Raunio, M., (2010), Nordic City Regions in the Creative Class Debate-Putting the Creative Class Thesis to a Test, Industry and Innovation, Vol. 17, No 2, pp. 215-240, April 2010
Backman, M. & Nilsson, P. (2016) The role of cultural heritage in attracting skilled individuals. Journal of Cultural Economy. DOI:10.1007/s10824-016-9289-2
Baker E. S., (2016), "The lure of big cities for the highly educated", Monthly Labor Review, U.S. Bureau of Labor Statistics, January 2016.
Brown, W. M., & Scott, D. M. (2012). Human capital location choice: Accounting for amenities and thick labor markets. Journal of Regional Science, 52(5), 787–808. Brueckner, J.K, Thisse, J-F. and Zenou, Y. (1999): “Why is Central Paris Rich and
Downtown Detroit Poor? An Amenity-based Theory”, European Economic Review, 43, 91-107.
Chen, Y., & Rosenthal, S. S. (2008). Local amenities and life-cycle migration: Do people move for jobs or fun? Journal of Urban Economics, 64(3), 519–537.
Clark T. et al (T.N. Clark, R. Lloyd, K.K. Wong, J. Pushpam, 2002). Amenities drive urban growth. (Journal of Urban Affairs, Volume 24, Number 5, pages 493-515)
Clark, T.N, ed (2004). The City as Entertainment Machine, special issue of Research in Urban Policy, 9: Chapter 3: Urban Amenities: Lakes, Opera, and juice bars: Do they drive Development? 103-140. Elsevier, Ltd.
Clark, T.N, ed (2004). The City as Entertainment Machine, special issue of Research in Urban Policy, 9: Chapter 8: Gays and Urban Development: how are they Linked? 221-234. Elsevier, Ltd.
28
Clark, T.N, ed (2004). The City as Entertainment Machine, special issue of Research in Urban Policy, 9: Chapter 12: Amenities Drive Urban Growth: A New Paradigm and Policy Linkage, 291-322 Elsevier, Ltd.
Compton, J & Pollak, R. A. (2007) "Why Are Power Couples Increasingly Concentrated in Large Metropolitan Areas?" Journal of Labour Economics, Vol. 25, No. 3, (July 2007), 475-512.
Costa, D. L. & Kahn, M. E. (2000) "Power Couples: Changes in the Locational Choice of the College Educated, 1940-1990." Quarterly Journal of Economics, Vol. 115, No. 4, (Nov 2000), 1287-1315.
Chatterton, P & Hollands, R. G. (2003) Urban Nightscapes: Youth Cultures, Pleasure Spaces and Corporate Power, London: Routledge.
Ezzet - Lofstrom, R. (2006). “Amenity Valuation and Migration Behaviour.” pg. 49 -78, Chapter 3 in book: Environmental Valuation: Interregional and Intraregional Perspectives, Edited by John I. Carruthers & Bill Mundy (Ashgate).
Florida, R. (2000). Competing in the age of talent: Quality of place and the new economy. In collaboration with R. K. Mellon Foundation, Heinz Endowments and Sustainable Pittsburgh.
Florida, R. (2002). The rise of the creative class. New York: Basic Books/Perseus.
Florida, R. (2005) Cities and the Creative Class. New York: Routledge.
Florida, R. (2005) The Flight of the Creative Class: The New Global Competition for Talent, 2005. HarperBusiness, HarperCollins.
Florida, R. (2008). Who's Your City? How the Creative Economy Is Making Where to Live the Most Important Decision of Your Life (Basic Books, 2008)
29
Gates, G., Arora, A., Florida, R. & Kamlet, M. (2000). "Amenities and the Location of Knowledge Workers." Working Paper, Carnegie Mellon University, January 2000. Glaeser, E. L., Scheinkman, J. A., & Shleifer, A. (1995). “Economic Growth in a
Cross-Section of Cities.” Journal of Monetary Economics 36 (1): 117-143.
Glaeser, E. L., (1998) The Journal of Economic Perspectives, Vol 12, No. 2 pp. 139-160. American Economic Association, March 1998
Glaeser, E. L., Kolko, J., & Saiz, A. (2000). Consumer city. National Bureau of Economic Research, Working Paper 7790, July 2000
Glaeser , E. L., & Saiz, A (2003) The Rise of the Skilled City. National Bureau of Economic Research, Working Paper 10191, December 2003
Glaeser, E. L., & Gottleib, J. D (2006) Urban Resurgence and Consumer City, Harvard University, Discussion Paper 2109, February 2006.
Gottlieb, P. D. (2004) “Labor Supply and the "Brain Drain": Signs from Census 2000, Brookings Institution, Metropolitan Policy Center, January 2004
Gottlieb, P. D. & Joseph, G. (2006), College-to-Work Migration of Technology Graduates and Holders of Doctorates within the United States. Journal of Regional Science, 46: 627–659.
Greenwood, M. (1997). Internal migration in developed countries. In M. Rosenzweig & O. Stark (Eds.), Handbook of population and family economics. Amsterdam: Elsevier Hanson, S. B., Ban, C & Huggins, L. (2003). Explaining the Brain Drain from Older
Industrial Cities: The Pittsburgh Region. Economic Development Quarterly (17). Heuer, R. (2004) Migration of recent college Graduates. Dissertation Abstracts International
30
Hicks, J. R. (1932), 2nd ed., (1963). The Theory of Wages. London: Macmillan.
Hoyman M. & Faricy C. (2008) It Takes a Village: A Test of the Creative Class, Social Capital and Human Capital Theories (December 2008).
Kahn, M. E. (2008), "Urban environment and quality of life." The New Palgrave Dictionary of Economics. Second Edition. Eds. Steven N. Durlauf and Lawrence E. Blume. Palgrave Macmillan, 2008.
Mellander, C. & Florida, R. (2007). The Creative Class or Human Capital? – explaining regional development in Sweden. CESIS Electronic Working Paper Series.
Mellander, C. (2016) Article: Stockholm är hem för 35 procent av alla högutbildade http://vertikals.se/charlotta/2016/07/26/stockholm-ar-hem-for-35-procent-hogutbildade/
Moretti, E. (2012). The New Geography of Jobs. (New York: Houghton Mifflin Harcourt) OECD (1996). The Knowledge based Economy, General Distribution OCDE/GD (96)
102, Paris.
Roback, J (Dec 1982). Wages, rents and the quality of life. The Journal of Political Economy, Volume 90, Issue 6
Roback, J (Jan 1988). Wages, rents and amenities: Differences among workers & regions. Economic Enquiry, Volume 26, Issue 1
RTK (2008). Livsstilar och konsumtionsmönster i Stockholmsregionen – ett regionalt utvecklingsperspektiv. Regionplane- och trafikkontoret, Stockholms Läns Landsting, Rapport 10:2008. (Regional planning & Traffic office: Stockholm County)
Eurostat (2014), Earning Statistics. Structure of earnings survey (SES), Eurostat, 2014. Shapiro, J. M. (2006). Smart Cities: Quality of Life, Productivity, and the Growth Effects of
31
Simon, C, J. (1998). Human Capital and Metropolitan Employment Growth, Journal of Urban Economics, 43, 223-243.
Sjaastad, L.A. (1962) The Costs and Returns of Human Migration. Journal of Political Economy, 70, 80-93.
SKL, (2017), Information from the web-page off: Sveriges Kommuner och Landsting. Statistics Sweden (2012)
http://www.scb.se/en_/Finding-statistics/Statistics-by-subject-area/Education- and-research/Education-of-the-population/Educational-attainment-of-the-population/Aktuell-Pong/9575/Behallare-for-Press/402491/ VG-Regionen (2012) http://www.vgregion.se/upload/Regionkanslierna/regionutveckling/analys/Kortrapport%20flyttare%20slut version%20rev%20120210.p
32
Appendix
Appendix 1
Appendix 1: Correlation Matrix Cultural
Amenities Consumer Services Retail Stores Restaurants Institutions for Higher Education Median Income Job Avail Metropolitan Area Cultural Amenities 1.000 Consumer Services 0.641 1.000 Retails Stores 0.768 0.781 1.000 Restaurants 0.770 0.775 0.916 1.000 Institution for Higher Education 0.543 0.514 0.562 0.500 1.000 Median Income 0.070 0.294 0.196 0.206 0.008 1.000 Job Availability 0.543 0.041 -0.069 -0.027 -0.203 0.582 1.000 Metropolitan Area 0.150 0.362 0.266 -0.016 -0.016 0.371 0.142 1.000
33
Appendix 2
** Significant at 1% level * Significant at 5% level; N= 290 for all variables (.) -Standard Deviation in parenthesis;
Appendix 3
Appendix 2: Equation with VIF
Variable Eq. VIF
Constant -7.341** (0.432)
-
Consumer Amenity Variables Cultural Amenities 0.020 (0.014) 2.812 Consumer Services 0.025 (0.026) 3.202 Retail Stores 0.001 (0.004) 7.602 Restaurants -0.005 (0.035) 7.246 Control Variables Institutions for Higher Education 0.208** (0.075) 1.747 Median income 0.007** (0.001) 1.857 Job Availability 2.193** (0.692) 1.657 Metropolitan Area 0.163** (0.048) 1.361 R2 0.403 Adj R2 0.386
Number of restaurants Category number
<10 1
11-20 2
21-30 3
31-60 4
60< 5