MASTER'S THESIS
Laboratory Test on Thermal Spalling and
Cracking Around Cylindrical Opening in
Rock under Bi-axial Loading Condition
Pouria A. Taleghani
2013
Master of Science (120 credits)
Civil Engineering
Luleå University of Technology
Laboratory test on thermal spalling and
cracking around cylindrical opening in rock
under bi-axial loading condition
iii
Table of contents
Introduction ... 1
Background ... 1
State of the art ... 2
Objective and approach... 5
Some fundamental issues ... 6
Geology of Fenno-Scandinavia ... 6 Rock description ... 7 Definition of spalling ... 8 Spalling ... 8 Thermal spalling ... 9 Fire curves ... 9 Pre-tests ... 12 First test ... 12 Position test ... 13
Burner and gas releasing tests ... 14
Steel plate ... 15
Curvature test ... 17
Other tests ... 17
Final set-up test ... 18
Fire test ... 21
Block preparation ... 21
Test setup ... 22
iv
Acoustic emission monitoring ... 24
Biaxial loading ... 24 Fire in an opening ... 27 Granite blocks ...28 Granite block, G7 ...28 Granite block, G8 ... 32 Granite block, G9 ... 35 Gabbro blocks ... 39
Gabbro block, A8... 39
Gabbro block, A9 ... 42
Schist blocks ... 45
Schist block, S7 ... 45
Schist block, S8 ... 47
Summary of tests timeline ... 51
Mass of spalling... 51
Discussion ... 53
Temperature distribution... 53
Temperature distribution inside the opening ... 53
Temperature distribution inside the blocks ... 54
Numerical modelling on temperature distribution ... 59
Thermal cracking and thermal spalling ... 62
Effect of rock type ... 63
Effect of water state ... 66
Effect of loading condition ... 67
The site effect ... 67
Conclusion ... 69
Appendix 1. Temperature-Time curves ... 71
Granite block, G7 ... 71
v Granite block, G9 ... 73 Gabbro block, A8 ... 74 Gabbro block, A9 ... 75 Schist block, S7 ... 76 Schist block, S8 ... 77 78 Functions ... 78
Interpolation, thermal conductivity ... 78
Interpolation, heating source ... 78
Material parameters ... 79
Geometry ... 79
Heat Transfer in Solids ... 80
Mesh ... 80 Plot Groups ... 81 Temperature ... 81 Isothermal contours ... 81 Plot Group 2cm ...82 Plot Group 4cm ...82 Plot Group 6cm ...83 Plot Group 8cm ...83 Bibliography ... 84 Appendix 2. COMSOL report for granite (G8) temperature distribution ...
vi
Acknowledgement
This work was financially supported by Formas, BeFo and Centre of Advanced Mining & Metallurgy at Luleå University of Technology (CAMM) which are gratefully acknowledged. I would like to express my gratitude to my supervisor Dr Ping Zhang at the Division of Rock Mechanics, Luleå University of Technology for the useful remarks and engagement through the learning process of this master thesis. Also, special thanks should be given to my examiner
Professor Erling Nordlund at the Division of Rock Mechanics, Luleå University of Technology for his professional guidance and valuable support.
Thanks are given to Lars Åström, head of Complab, Luleå University of Technology and Mats Petersson and Roger Lindfors who had assisted in conducting the experiments in the Complab. In particular, author would like to thank Professor Savka Dineva and Ganesh Mainali for their kindly help in acoustic emission monitoring and Dimitar Mihaylov for his kind comments on improving the test set-up.
Last but not least, I would like to thank my wife, Marjan for her kindness and support she has shown during the past two years to finalize this thesis.
Luleå, October 2013
vii
Abstract
In the last decade, fire safety of tunnels has become a point of major and international concern. One of the issues that have recently been studied in Sweden is fire-induced rock tunnel stability. A series of laboratory scale studies has been conducted at Luleå University of Technology, Sweden to assess the thermal response of common rock types in Fennoscandinavia. The main objective of this experiment was to investigate experimentally the effect of initial compressive stress on thermal spalling and determine the mechanism causing thermal damage (spalling and fracturing) in rock observed in laboratory experiments. Seven tests were carried out including oven-dried and water-stored rock blocks, with and without applying bi-axial stress on three rock types, granite, gabbro and schist. Rock blocks had the dimensions of 600 mm 500 mm 300 mm and a 75 mm borehole was drilled through the centre of each block to resemble the tunnel. Blocks were heated up by approximately following a hydrocarbon fire curve. Temperature measurement and acoustic emission monitoring were performed during laboratory tests to log the temperature development and track the fracture propagation. Tested rocks have shown different behaviours during fire tests due to different mineralization and thermal expansion coefficient. Granite presented explosive spalling under confined conditions for both oven-dried and water-stored conditions. Only small pieces flew off the fire exposed surface for gabbro. Since the layers of schist are located perpendicular to borehole axis, no obvious spalling was observed but the layers were still separated after test duo to expansion along borehole axis. Compare to oven-dried samples, water-stored samples caused more spalling on granite and gabbro. The tests also show that the initial compressive stress has significant effect on rock spalling by comparing the weight of spalling material.
1
Introduction
Background
There is an increased concern in the safety of tunnels in recent years due to the huge number of fatalities and material damage from fires in tunnels. During the past decades only in Europe, there have been at least ten major fires in roads and railways tunnels with human victims and most of them were caused by accidents. Catastrophic fires occurred in the European road tunnels of Mont Blanc (France-Italy; 39 fatalities) and Tauern (Austria; 12 fatalities) in 1999, and St Gotthard (Switzerland; 11 fatalities) in 2001. Indeed, significant and fatal accident fires in tunnels have occurred in almost every year since 1994 to 2004. These dramas brought the issue of tunnel safety to the fire and were the origin of a number of regulatory and research activities. Even more importantly, they have progressively led to new ways of thinking and ensuring safety in road tunnels and a new behaviour of all those involved [1].
According to the French statistics, there will only be one or two car fires (per kilometre of tunnel) for every hundred million heavy good vehicles (HGVs) passing through a tunnel; there will be about eight fires (per kilometre of tunnel), only one of which will be serious enough to cause any damage to tunnel itself and there will be between one and three very serious fire out of every thousand million HGVs per kilometre of tunnel. The chance of a serious accidental fire may sound vanishingly small from these statistics, but when one consider that many road tunnels have very high traffic densities, there are over 15000 operational road, rail and underground railway tunnel in Europe alone and that some of these tunnels are many kilometres long, the chance of serious fire incident in tunnel may be greater than is commonly thought [2].
Rock will quickly be exposed to high temperature in a tunnel fire where no, or a thin layer of shotcrete exists, hence the risks of instability in fire induced rock tunnel in Sweden is potentially high. Moreover with the growing of tunnels number and increasing of tunnels length, as well as increasing of traffic density and travelling speed, they will bring significant impact on the safety of tunnel. After couples of catastrophic tunnel fires several research
2
projects have been launched to study the behaviour of concrete lining during and after a fire, and much have been learned on how to make the concrete perform better; nevertheless, rock behaviour such as mechanism of thermal spalling that subjected to high temperatures is still poorly discussed issue even up to now [3]. This topic has not been considered necessary because most of European rock tunnels are usually protected by thick layers of concrete. But according to the recent statistic from [3], 6% of Swedish railway does not have any reinforcement at all, and 38% has only reinforced with spot bolting or a thin shotcrete skin for rock surface protection; hence research on thermal spalling of rock is therefore becoming more urgent as deeper horizons are being opened up.
The majority of tunnels in Sweden are constructed within strong rock and at shallow depths. Rock with thicker shotcrete may also be exposed to fire where spalling of the shotcrete occurs. Elevated temperature can result in changes in thermal, mechanical and physical properties of rock and rock reinforcement (shotcrete, bolt and concrete lining). During fire, damage of rock and concrete structure may occur due to thermal spalling and fracturing, and failure and collapse of tunnel may eventually occur. This research tries to answer the question of how thermal response of Fennoscandian rock types will be affected by elevated temperature and other key components.
State of the art
In 1996, Hettema conducted significant series of test on thermo-mechanical behaviour of sedimentary rock. The objectives of this research was to investigate the mechanism of thermal spalling and develop a model for its prediction as well as to assess dominant process responsible for stability and development of an underground cavity. This experiments have dealt with effects of thermal expansion, thermal stress, pore pressure, biaxial stress and etc. Three types of experiments were performed: 1) Uniform heating experiments on cylindrical cores under atmospheric pressure. Heat was supplied at a low rate from all directions. 2) Experiments under atmospheric pressure on cylindrical cores heated at one end plane. Heat was supplied at a linear heating rate or by thermal shock. 3) Experiments on cubic samples under biaxial stress. All cores were heated to final temperatures in the range of 400 to 1200C. By uniform heating experiments, he concluded that the presence of moisture is a necessary condition for the occurrence of explosive spalling. Additionally he figured out that at very low heating rates (of 2°C/min or below) up to 900 C, temperature cannot lead to spalling or to macroscopic fracturing. Thermal shock experiments, the second type of test on cores of Felser sandstone resulted in the formation of thermal cracks without spalling, while the thermal shock on air-dried shale laminated siltstone cores led to spalling at a low local steam pressure
3
caused by a combination of steam pressure and compressive stress. The third type of spalling experiments was performed on cubic rock samples under biaxial stress (of either 1 or 20 MPa), he recognised three regimes for the radiation temperature for these tests: 1) at low temperatures (roughly below 600°C), neither spalling nor fracturing occurs, 2) at intermediate temperatures (roughly between 700 and 900°C) the rock fractures, but spalling does not occur, and 3) at high temperatures (roughly above 1000 °C), spalling does occur. He concluded that although biaxial stress had some influence on the occurrence of spalling, the temperature was the main factor and spalling of the these type of samples took place by compressive buckling [4].
Series of tests were conducted by Zhang et al. at Lulea University of Technology to evaluate the behaviour of three Fennoscandian rocks granite, gabbro and schist in both oven-dried and water-stored conditions subjected to two different types of fire [3, 5]. The blocks were heated on a small furnace (uniform surface heating test) and by a small blowtorch (local surface heating test) for 25 minutes and 60 minutes respectively to simulate different fires in which the time-temperature curve approximately follows the hydrocarbon fire curve during the first several minutes and then slightly decreases. The temperature inside the tested rock blocks was measured by thermocouples in four drilled holes. As the result of these experiments, substantial explosive spalling was observed on granite, especially when it was water-stored, but only a few small chips flew off the surface of gabbro during heating. During the uniform surface heating test, schist blocks failed in sliding between the layers and further delaminating along the layers. However, during local surface heating test, chips were formed on the heated surface of schist. Zhang concluded that these different responses among different rocks can be attributed to the mineralogy and rock texture as well as restrained thermal dilation and pore pressure.
Smith & Pells evaluated the behaviour of rock blocks of Hawkesbury sandstone during a fire both in real scale and laboratory. For the field test, brick lined charcoal furnace was mounted against the rock cutting. Then air was blown through the furnace from the bottom to achieve the high temperatures required. The test was a reasonable approximation to a hydrocarbon fire. The furnace was operated for approximately 4 hours. Explosive spalling of the rock generated as the furnace temperature approached 900 C, approximately 22 minutes after application of heat. As the second real scale test and in order to study the effect of steam pressure, two holes at spacing of 75 and150 mm were drilled into the rock, with the aim of releasing steam pressure and limiting spalling. The results of the second test were almost opposite to the expectation. They observed spalling was recorded in the first twenty minutes of the test when the temperature measured in the middle of the furnace was only 150 C, while collected spalled material was different and larger. Hence, they concluded that substantial
4
explosive spalling does not required the extreme temperatures given in standard fire curves. Only a few hundred degrees may be sufficient. The mechanism causing spalling appears to be primarily the generation of steam pressure [6].
Another review of the spalling process, with detailed laboratory experimental results on three different rock types, was presented by Thirumalai. The heating source used in these experiments was small O2-H2 torch, which delivered a heat flux of 170104 watt/m2. Quartzite, granite and basalt samples were instrumented to record thermal gradient during spalling and shear stress and strain at rock failure were measured. The result shows relationship between formation of a thin heated layer in rock, with high thermal gradient, and good spallability for the three rock types tested [7].
Furthermore in another program, Thirumalai examined the efficiency of surface heating of small blocks of rocks, from several sides at once. The method of heating employed in this study is purely surface heating, either overall or over only part of surface of rock block. Heating elements employed have been electric heaters and oxygen-fuel jets. This set of expriments showed that fractures of the rock block are initiated by triaxial tensile stresses in interior of rock block. Furthermore the size of the resulting fragments can be varied by varying the intensity of the heat input [8].
The phenomenon of spalling in fire has been widely researched for concrete and to a lesser extent, shotcrete; for instance, fire tests of reinforced concrete tunnel linings by Yan et al. This test presented the full-scale experimental results of actual reinforced concrete shield of TBM tunnel linings exposed to a standard ISO834 curve. And initial vertical and horizontal loads were applied by hydraulic jacks to simulate ground pressure of a typical Shanghai tunnel. The conclusion drawn was severe explosive spalling of the tunnel lining segments occurs 6–20 min after the beginning of heating and within a range of 170–500 C of concrete temperatures. The measured maximum explosive spalling depth and area vary within a range of 26–51 cm and 13.1–55.7%, respectively [9].
In 2003 large-scale fire tests were carried out with semi-trailer cargos in the Runehamar tunnel in Norway with 1600 m long, 6 m high and 9 m wide. In total four tests were performed with fire in a semi-trailer set-up. In three tests mixtures of different chosen cellulose and plastic materials were used, and in one test real commodity consisting of furniture and fixtures was used. In all tests the mass ratio was approximately 80 % cellulose and 20 % plastic. The maximum heat release rates varied between 70.5 MW and 203 MW. The maximum gas temperatures varied between 1281 C and 1365 C which achieved less than 10 minutes. It was concluded that the fire curve best representing the test results was the RWS fire curve. The high temperatures and intense fire caused high radiation, which led to fast fire spread. The hot
5
gases also caused rocks falling down from the tunnel ceiling upstream of the fire. Downstream of the fire the road was covered with rocks that have fallen from the ceiling too [10].
Objective and approach
Briefly the objectives of this research are:
to assess dominant mechanism causing thermal damage (spalling and fracturing) in rock observed in laboratory experiments
to investigate the effect of rock type, water content and initial compressive stress on thermal spalling
The main questions addressed by this thesis is, how thermal spalling and fracturing of a cylindrical opening will be affected by bi-axial loading at elevated temperature. The approach adopted to realise this objective is to perform various types of laboratory experiment. Seven tests were carried out including oven-dried and water-stored rock blocks, with and without applying bi-axial stress on three rock types, granite, gabbro and schist. Rock blocks had the dimensions of 600 mm 500 mm 300 mm and a 75 mm borehole was drilled through the centre of each block to resemble the tunnel and blocks were heated up by approximately following a hydrocarbon fire curve.
Furthermore, the third objective is pursued by performing a numerical modelling to validate experimental results in term of heat transfer.
Results from this study may be useful for thermal spalling and fracturing analysis of rock tunnel under fire loading and further rock tunnel design under fire condition.
6
Some fundamental issues
Geology of Fenno-Scandinavia
In geological terms, Sweden forms part of the Fennoscandian (or Baltic) Shield, which also includes Norway, Finland and the north-western part of Russia, simplified geological map of the Fennoscandian Shield is shown in Figure 2-1. The oldest preserved continental crust in the Fennoscandian Shield was generated during the Saamian Orogeny at 3.1-2.9 Ga and is dominated by gneissic tonalite, trondhjemiteand granodiorite. Rift and volcanic arc-related greenstones, subduction-generated calcalkaline volcanic rocks and tonalitic-trondhjemitic igneous rocks were formed during the Lopian Orogeny at 2.9–2.6 Ga [11].
Most of northern and central Sweden with the south-western part of Finland belongs to the Svecofennian province. Here, the bedrock formed 1750-1900 Ma ago, during the Svecofennian (also known as Svecokarelian) orogeny. This bedrock includes both meta-sedimentary and meta-volcanic rocks and several generations of granitoids. This area also contains some younger (c. 1500-1650 Ma) Rapakivi granites as well as Jotnian. The continental crust of the eastern part of the Fennoscandian shield, a series of mesas-leucocratic gabbroid massifs are determined, and according to isotope age dating of zirconson the SHRIMP-II ion probe, their magmatic formation stage accounts for 2711 ± 25 million years. In northern Sweden, a Palaeoproterozoic succession of greenstones, porphyries and clastic sediments rests on deformed, 2.7–2.8 Ga, Archaean basement. Stratigraphically lowest is the Kovo Group. It includes the Central Lapland Greenstone Belt and Kuusamo and Peräpohja Schist Belts in Finland and the Kiruna and Masugnsbyn areas in Sweden [12].
7
Figure 2-1 Simplified geological map of the Fennoscandian Shield with major tectono-stratigraphic
Regarding to above description, the lab tests were planned to conduct on three types of rocks, granite; gabbro and schist in order to cover the most important rock types of Fennoscandinavian geology.
Rock description
Granite
: Massive, greyish, fine grained (0.3 mm), unevenly grained (1 mm) granite withfeldspar (microcline>plagioclase), quartz and mica (biotite) as main minerals [13].
Gabbro
: Massive, black, fine-to medium grained (0.5 mm), olivine, biotite caring diabase.8
Schist
: Foliated, grey, fine grained (0.05 mm), slightly unevenly grained quartz schist.Quartz, feldspar, mica (muscovite/chlorite) are the mine minerals [13].
Since there are different varieties of each type of rock, the mineral composition of tested rock blocks was determined using petrographic modal analysis [13] and is presented in Table 2-1.
Table 2-1 Mineral composition of granite, gabbro and schist (%) (From [13])
Rock Type Quartz Feldspar Pyroxene Olivine Mica Opaque minerals
Gabbro - 55.8 27.6 8.1 5.5 3.0
Granite 32 59.4 - - 7.2 1.4
Schist 57 6.1 - - -36.9* -
* Amount of mica plus other phases
Definition of spalling
Spalling
The theory of spalling is based on the concept of fracture mechanics, i.e. the term of spalling will be defined as loss of material from body by a fracturing process which is induced by stresses existing in the body [14]. These stresses may be due to mechanical loading, temperature changes, phase changes, change in moisture content, etc. Spalling expresses the spallability of material, where the criteria for crack initiation and crack propagation apply, in term of the material properties considered. The requirements of spalling are that the fracture completely separates materials from the main body. To do this the complete fracture must under and up to surface. In rock mechanics, when stresses at the excavation boundary reach the rock mass strength, a brittle failure occurs that is called spalling. The spalling phenomenon occurs as a strong compressive stress induces crack growth behind excavated surface, and buckling of thin rock slabs occurs. Spalling is initiated in region of tangential maximum stress, and it results in a V-shape notch. There is a spectrum of such spalling, ranging from slight cracking through to complete failure of the excavation.
In fact spalling or extensional failure is fracturing of micro-defects parallel to the major principal stress and perpendicular to minor principal stress [15]. This leads to extensional straining of the rock material parallel to minimum principal stress. Extension strains may occur even when all three principal stresses are compressive. This can be proved by Hooke’s law for ideal elastic materials. An extension strain will occur if:
9
𝜈(𝜎1+ 𝜎2 ) > 𝜎3 2-1
The extension strain corresponds to minimum principal stress, which is the least compressive (or largest tensile) principal stress and fractures will be formed in planes normal to direction of extension strain [16].
Thermal spalling
Thermal spallation can be broadly defined as fragmentation of the surface of a brittle solid into small disk-like flakes, called spalls or chips by rapidly beating a relatively small fraction of the solid (e. g. less than 10% of the exposed area) [17]. Thermal stresses arising from the tendency of the heated portion of the material to expand as temperature is increased cause failure to occur. Heating of rock usually causes spalling on the surface, called as Thermal Spalling. Large numbers of factors affect thermal spalling of rocks. Some of the most important factors are heating rate, maximum temperature level during the fire, duration of fire, and mechanical, geological and physical properties of rock. Heating rate influences the development of temperature, moisture and pore pressure gradient within the rock, while temperature level would affect physical-chemical relation in material and mineralization of rock [18].
Fire curves
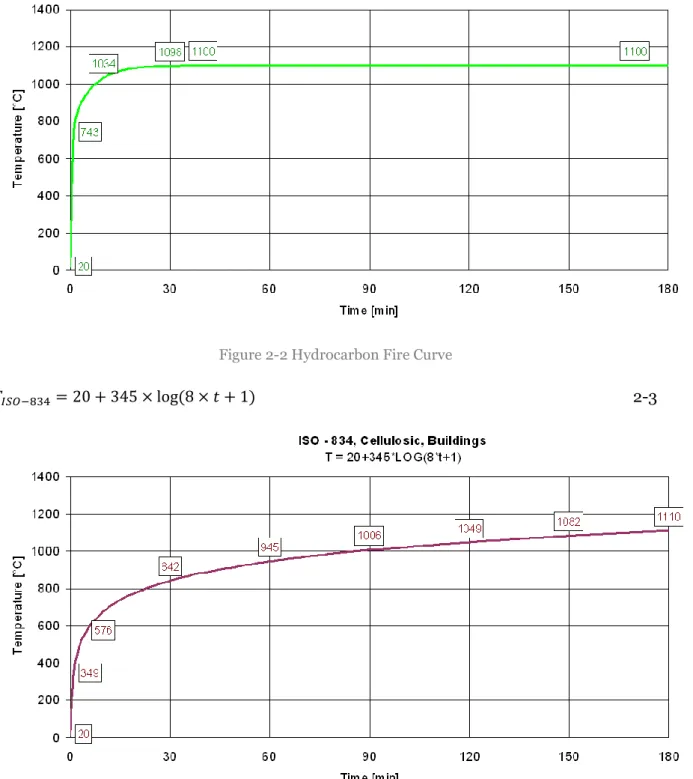
One of the factors affecting the tendency to spall is the rate at which the temperature rises. Using the nominal fire curves is the simplest way to represent a fire by pre-defining some arbitrary temperature-time relationships, which are independent on ventilation and boundary conditions. Fire tests are normally performed under heating conditions described in standardised time-temperature relationships (standard ISO 180-834 and Hydrocarbon). During ISO 834 fire, the temperature of the heated surface rises to 1000°C within 1.5 to 2 hours. While during a hydrocarbon fire, the temperature of the heated surface will rise to 1100 °C within 30 minutes and the mean heat flux during the first few minutes is about 120 kW/m2. ISO (cellulosic) fires are those that are sustained by cellulosic products (e.g. timber, fabrics, paper, etc.) while Hydrocarbon fires occur in petrochemical installations or oil and gas production facilities when hydrocarbon chemicals and fuels ignite. The temperature development of these fire curves is described by the following equations; where “T” stands for temperature and “t” represents time in minutes:
10
Figure 2-2 Hydrocarbon Fire Curve
𝑇𝐼𝑆𝑂−834= 20 + 345 × log(8 × 𝑡 + 1) 2-3
Figure 2-3 ISO - 834 Fire Curve
However, the fire curves do not represent real natural fires, but the simplest and most common performance-based approaches developed based on the results and observations from regulated fire resistance tests. The differences in the heating rate, fire intensity and duration between the fire curves and real fires can result in different structural behaviour. Although the temperatures during this set of experiment was designed to follow the
11
hydrocarbon curve, it was found impossible after several minutes heating due to inadequate heat input and combustion inside opening. However, the rapid start in the HC curve was still achieved, which seems to be important when considering spalling.
12
Pre-tests
The aim of this part of lab test was to find a suitable set-up to conduct the actual tests. Some
of equipment such as burners and thermocouples were purchased from supplier; however other
parts were made or developed at LTU CompLab. These set-up tests were supposed to answer
the questions like: how to apply heating uniformly inside the opening; how to follow the fire
curves practically; how to select the right type of equipment such as the burner and the
thermocouples; and how to find the appropriate position of burner, etc.
First test
First of all, to clarify differences, two kinds of drilled holes, called as “Opening” and “Thermocouple hole”, are defined here. Opening is a drilled hole in the centre of the rock block with diameter of 75 mm to resemble a circular tunnel. Thermocouple holes are group of small drilled holes with diameter of 10 mm in different depths and perpendicular to the opening boundary. The thermocouples later were installed into the thermocouple holes.
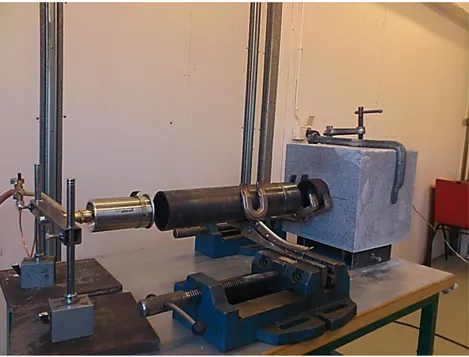
In order to find the acceptable condition for the real test, some set-up tests were conducted to evaluate assumptions and suitable equipment. For this purpose an opening with diameter 75 mm was drilled in the centre of granite blocks with dimension of 250 mm x 250 mm x 250 mm. In order to avoid damage on the outer surface of rock block, at the initial step a steel pipe with 65 mm diameter and 300 mm length was manufactured, which was located between the burner and the rock block. To check if the temperature around the opening is uniformly distributed and follows the fire curve, a thermocouple was attached to the opening boundary and placed at 5 cm far from the end of opening. A data logger was used to record the temperature during the test. Additionally in the initial test, a steel ring with 35 mm length was located close to block surface and coincided with the diameter of the steel pipe; with purpose of leading the fire flame into the opening directly. In order to prevent the separation of block during the tests due to crack propagation, two clamps were attached to the rock block as well, see Figure 3-1. The test was stopped after two minutes, when a crack appeared in rock block. During the test no spalling was observed. The recorded temperature was below ISO curve, which did not satisfy the requirement of test. The result of this test is shown in Figure 3-2. Low temperature on opening boundary was assumed as consequence of inappropriate position of equipment. So as the next attempt, it was tried to find the suitable position by changing the distance between burner and steel pipe.
13
Figure 3-1 First set-up with steel pipe, ring and clamps
Figure 3-2 Temperature-time curves for first set-up test
Position test
For this group of set-up tests, different positions were tested and recorded data were compared to find the best condition; that was supposed to apply to the afterwards tests. In this type of tests, two thermocouples used (Temp 1 and Temp 2 in following graph) and attached
0 100 200 300 400 500 600 700 800 900 0.10.20.20.30.40.50.60.60.70.80.90.91.01.11.21.31.31.41.51.6 temp e ra tu re ( °c) time (min)
Temperature-Time Curve
Temp 1 ISO Hydrocarbo n14
to the middle and 1/3 to the end of opening boundary respectively. This may help to figure out the temperature distribution along the opening. Totally five tests were conducted and according to the results, proper distance between pipe, burner and block were decided as follows:
Distance between block and burner = 450 mm Distance between pipe and burner = 50 mm
The temperature-time curves of the tests at suitable positions are shown in Figure 3-3.
Figure 3-3 Temperature-time curves (Position test)
Burner and gas releasing tests
During the last tests the opening boundary was covered by soot partly; hence as the next step, it was tried to figure out the best rate of propane consumption. Three tests have conducted to evaluate the maximum rate of propane consumption regard to achieving a complete combustion inside the opening. Additionally, two different types of burners were used to evaluate the influence of combustion chamber and size of nozzle on flame’s diffusion. Characteristics of the burners are shown in Table 3-1. However, as it is shown in Figure 3-4, no significant difference was observed by changing the burner, it was decided to use the power burner for the future test due to its better performance.
0 100 200 300 400 500 600 700 800 900 1000 0.0 0.1 0.2 0.4 0.5 0.6 0.7 0.8 0.9 1.1 1.2 1.3 1.4 1.5 1.6 1.8 1.9 2.0 2.1 2.2 2.3 temp e ra tu re ( °c) time (min)
Temperature-Time Curve
Temp 1 Temp 2 ISO Hydrocarbo n15
Table 3-1 Characteristics of the burners
Power Burner Small Burner
Burner diameter 60 mm 50 mm
Gas consumption, at 4 bar 8250 g/h 6700 g/h
Effect 114 kW 86 kW
Figure 3-4 Temperature-time curves (Burner Tests)
Steel plate
While conducting the tests, it was realized that the initial thermal cracks appeared in the front surface of rock block when it was directly exposed to fire prior to thermal spalling. Accordingly, to protect the front surface, a steel plate with the same dimension of rock block (25 cm × 25 cm) was manufactured. A hole was drilled with diameter of 68 mm in the middle of plate and a ring with the same diameter and 7 mm length was welded to one side of the drilled hole. The purpose of the welded ring was leading the fire directly through the opening. As it is shown in Figure 3-5 the steel plate was installed in front of the block with 5 mm distance from rock block surface.
0 100 200 300 400 500 600 700 800 900 0.10.10.20.20.30.40.40.50.50.60.70.70.80.80.91.01.01.11.1 temp er atu re ( °c) time (min)
Temperature-Time Curve
Temp 1 -Power Burner Temp 2 -Power Burner Temp 1 -Small Burner Temp 2 -Small Burner16
Figure 3-5 Installing steel plate in front of block
Results of two tests with and without steel plate had been compared. And it was figured out that by using the steel plate the temperature inside the tunnel was significantly increased.
Since no spalling was observed on the opening boundary, it raised the concern of conducting test on the surface of block without drilling holes to study the effect of boundary conditions. The steel plate was installed in front of the rock block and one thermocouple was used to record the temperature at the centre of heated area of the block surface. After about one minute heating, spalling started on the surface and significant amount of chips fell down from surface during heating (Figure 3-6).
17
Curvature test
Figure 3-7 The uncovered sample before and after test (left: before test, right: after test)
Figure 3-8 The protected sample before and after test (left: before test, right: after test)
Other tests
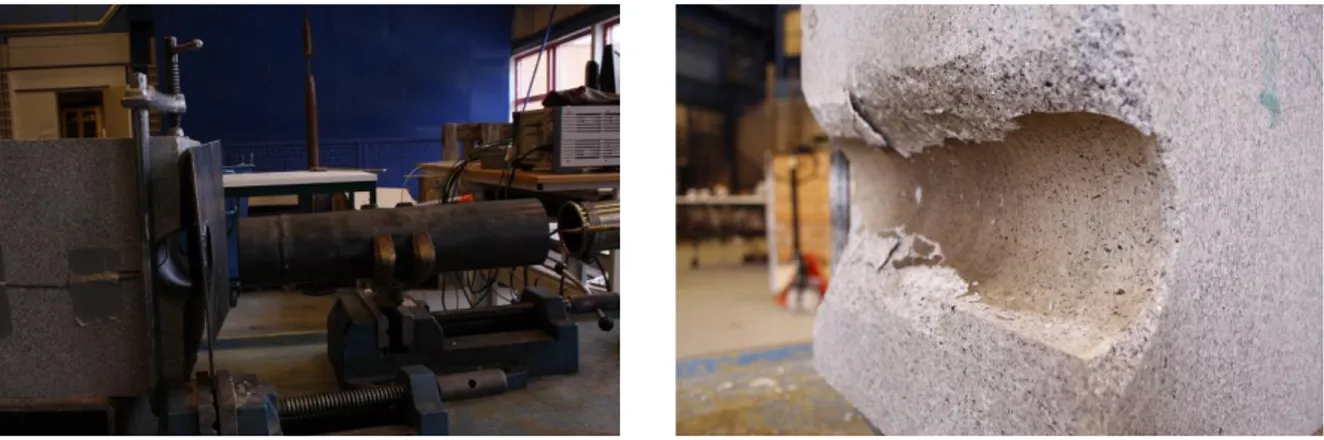
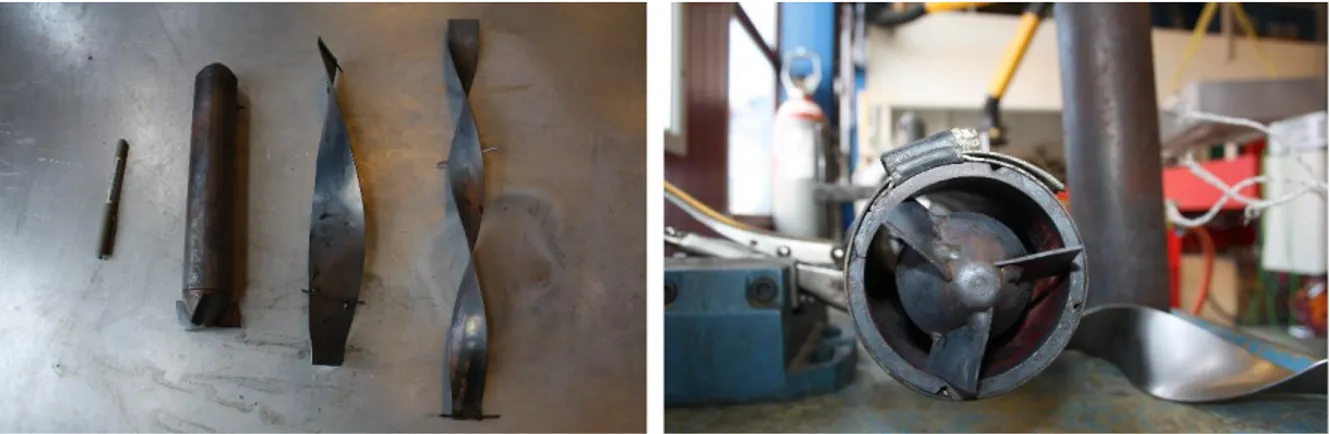
To increase the heat influx on the opening boundary, some tools were manufactured and tested as well (Figure 3-9); the idea was that if a barrier can be positioned in the centre of the According to the previous tests, it’s assumed that the curvature of the opening has significant effect on spalling. Hence a group of tests was designed and conducted to study the effect of curvature on thermal spalling while the rock block was exposed to high temperature. Initially two sample blocks were prepared and drilled. The drilled blocks are shown in the Figure 3-7 (a) and (b) The purpose of using “half hole” sample was to expose the opening boundary with certain curvature directly to the flame. During the tests one sample was kept uncovered and the other one was covered with steel frame. In the first sample thermal cracks initiated on the surface and near the edge of the opening boundary while for the second one, some small spalling was observed in the centre of the hole; however there were some observed cracks on the edge of the opening boundary as well, see Figure 3-8.
18
hole, the temperature on the boundary could be increased. The first one was such a hollow cylinder, with two welded cone at the two ends of the hollow cylinder. The cylinder was attached to a ring with three wings and fitted in the centre of the opening. The other one was a steel plate with the dimension of 50 mm in width and 300 mm in length. The steel plate was bended and rotated in order to change the flame direction. Three thermocouples were welded on outer surface of the steel pipe at 75, 125, and 175 mm from top of the pipe respectively, to measure the temperature. Almost in all tests with these manufactured tools, it was observed that propane gas was not burnt properly and fire shock occurred several times.
Figure 3-9 Prototypes to improve heating distribution inside the opening
Final set-up test
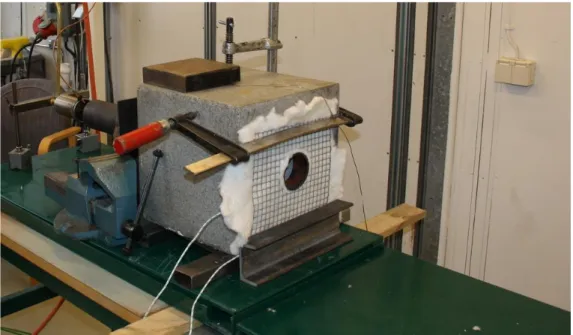
To achieve the most ideal set-up for the real tests, one more granite block was drilled and tested. In order to have a good comparison with previous results, it was tried to use the same position of steel pipe, protective plate and attached thermocouples, as well as rock block size and drilling hole diameter. Furthermore, in order to protect the backside surface, a steel pipe with a diameter of 70 mm and length of 15 mm, was installed into the drilling hole and the surface was covered by isolated material. The evaluation of the set up condition was considered as the main goal of this test, see Figure 3-10 and Figure 3-11.
19
Figure 3-10 Another trial set-up test (Front)
Figure 3-11 Another trial set-up test (Back)
As one of the main concern was incomplete combustion inside the opening, accordingly it was decided to conduct some more tests to improve the position of burner. Two burner positions were investigated between 5 cm and 10 cm far from the front surface. In all of these recent tests, steel pipe was removed from the normal set up and burner was just installed in front of protective plate at mentioned distances. Visually, it may conclude that, complete combustion was accrued at maximum capacity of burner which the outer flame was completely blue. While when tried to follow the standard fire curve the flame was quite yellowish. Also it
20
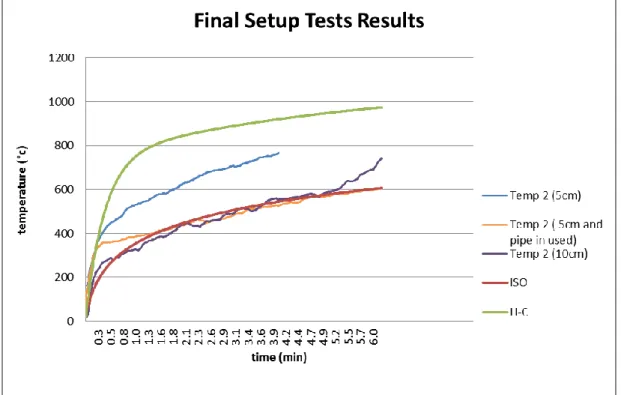
may figure out that, when the burner was 10 cm far from surface the temperature in the centre of flame was significantly low, which means that the flame was spread. Additionally the comparison of thermocouples temperature is presented in Figure 3-12, while it was tried to follow standard heating curve with and without installing steel pipe.
Figure 3-12 Final setup tests results
It may conclude, there is no benefit regarding increasing heating temperature and more concentrated flame by using of steel pipe. Finally it was decided to conduct the actual test by following set up;
1) No steel pipe between block and burner will be used.
2) 50 mm distance will be left between rock block and burner.
3) One protective steel plate will be installed in front of rock block surface, and the distance from this plate to rock block will be 10 mm. A steel ring with the length of 7 mm attached to the steel plate will be inserted into the drill hole for sake of leading flame into the opening.
21
Fire test
Block preparation
Totally seven blocks were tested in the lab. As described before blocks included granite (G7, G8, and G9), gabbro (A8, A9) and schist (S7, S8). Holes were drilled in the centre of the blocks to represent a tunnel by Hilti DD-130 Diamond Drilling Rig with 72 mm core bit, which is low-speed and non-percussive drilling method used to make smooth hole. As it is shown in
Figure 4-1 Diamond drilling (Left: Main hole; Right: Thermocouple hole)
Figure 4-1 the bit is mounted onto a drill stem, which is connected to a rotary drill. Water is injected into the drilling pipe, to cool the diamond segments and wash out the rock cuttings produced by the bit.
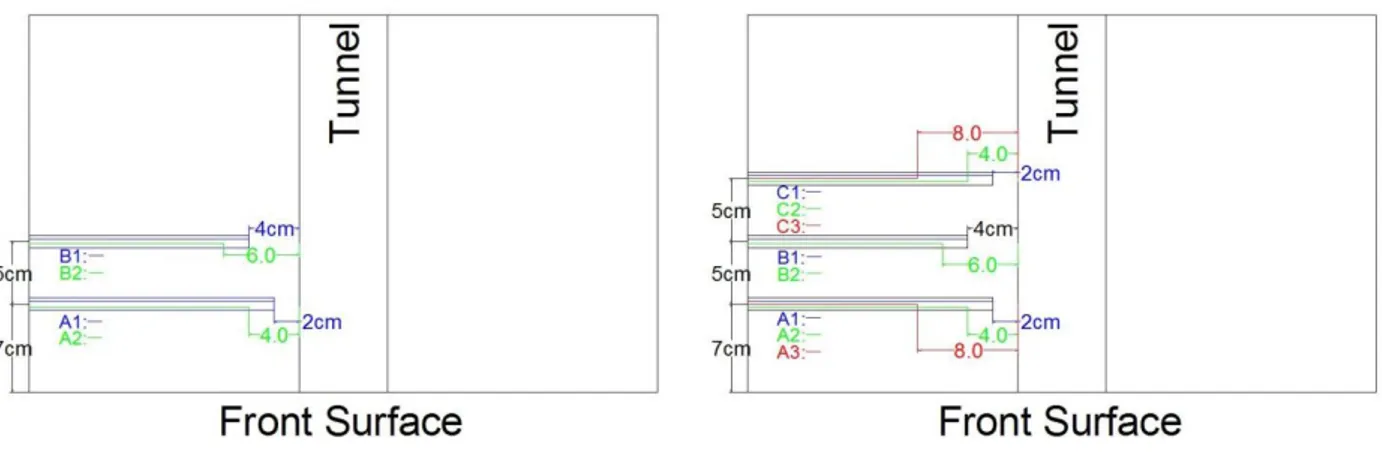
When the entire length of the block was drilled, the core was obtained. The cylindrical core of the rock was kept for future microscopic and rock properties test. To record temperature distribution inside each block, the thermocouple holes were drilled as well (Figure 4-1), which follows two different patterns while the diameter of the hole was the same as 10 mm. These drilling patterns and position of thermocouples are illustrated in Figure 4-2. It should be noted that the thermocouples A1, B1 and C1 were installed at the bottom of each hole. Pattern A was used for G7 and S7 blocks and pattern B was used for the rest. In order to study the influence of water saturation on spalling, two categories of rock blocks were prepared. One category of
22
blocks was oven-dried and the other was water-stored. Hence, when drilling was finished, the water-stored blocks were stored in a water tank and the level of water was increased at the speed of 10 cm per day. After 6 days the water level was above the rock blocks and the blocks were stored in the tank for 180 days.
Figure 4-2 Top view of thermocouple holes’ drilling patterns (Left: Pattern A; Right: Pattern B)
Four out of seven blocks were tested under oven-dried condition. To do this each block was placed into the furnace. Initially the temperature of the furnace was set at the room temperature of 20c. Temperature was increased steadily (10c per hour) until it reached 100c; then the block was kept in the furnace for 48 hours. After that the temperature was decreased with the same rate until 2oc. Blocks were wrapped in plastic sheets afterwards.
Test setup
A heavy frame with dimensions of 190 cm 190 cm 30 cm was designed and manufactured at LTU lab. The frame was assembled by using several H-shaped steel beams. In order to increase the stiffness of the frame, four plates were welded to the skeleton frame. With the aid of the frame bi-axial stress could be applied on the block by two hydraulic jacks which were attached to the frame. In order to distribute the load uniformly on the rock block surfaces, two H-shaped steel plates were placed between the hydraulic jacks and block surfaces. Additionally four low friction polyoxymethylene (Derlin) plates were attached to the surfaces of rock blocks in order to reduce the friction resistance between the rock block and platens (Figure 4-3). The number of installed thermocouples into each thermocouple holes varied according to the thermocouple pattern.
23
The thermocouple holes were filled with cement and little water for G7 and S7, but for the rest of the blocks the thermocouple holes were only filled with cement after placing the thermocouples at the right position.
Figure 4-3 Frame and position of block
After the thermocouples were installed and the holes were stuffed, the block was mounted to the frame and three thermocouples were attached on the opening boundary. In the later graphs the thermocouples were called as Temp 1, Temp 2 and Temp 3, which were located at 5 cm, 15 cm and 25 cm far from the front surface of blocks respectively.
Hydraulic Jacks
H-shaped steel plates Frame
24
Peripheral equipment
Acoustic emission monitoring
The rock failure process is associated with acoustic emission. Acoustic emission occurs by crack form in rocks under high stress, as a result of either dislocations at the micro-level or at the macro-level by initiation and propagation of fractures through and between mineral grains [19]. Generally speaking, AE is the phenomenon of emitting elastic waves as a result of irreversible or partially reversible changes in the structure of a solid under the action of various external and internal physical factors. Stored elastic energy is released suddenly when new cracks are generated or the existing cracks extend their length [20]. Acoustic emission accompanies with deformation and fracture of rock under various conditions of mechanical loading and thermal action and provides "real time" evidence of crack formation. Totally seven sensors (four in front and three in the backside) were attached to the surface and calibrated properly.
The AE results will be discussed in another report.
Figure 4-4 Acoustic emission sensor attached to the sample
Biaxial loading
The biaxial compression loading apparatus were used to supply the required pressure to the block. The load is applied to the surfaces of the block by stacks of semi-circular segments through two hydraulic jacks. These segments are located in a centre of each surface accurately. The load is applied onto the segments by hydraulic jacks, designed to exert a thrust of 500 kN each. These jacks are fixed in alignment by a set of clamps. Vertical and horizontal hydraulic jacks were used to apply constant axial load which was uniformly distributed through loading platens. The jacks were interconnected and fed by a single variable volume high pressure hydraulic pump. Load control was achieved by means of a needle bleed-off valve in the hydraulic circuit. Equation 4-1 simply gives the vertical and horizontal compressive stresses.
25 𝜎 =𝐹
𝐴 4-1
σx =2.77 MPa σy =3.33 MPa
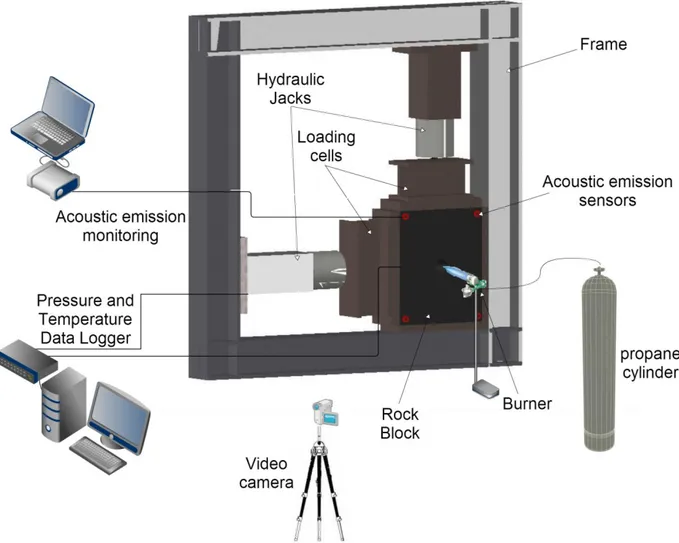
A schematic diagram of test setup is shown in Figure 4-5. A computer program controls the experimental conditions and stores the data. All computer commands for the temperature and pressure were converted into digital output in the data acquisition units. Totally, fourteen channels were used to control the temperature and pressure. Two of them were used for vertical and horizontal pressure induced by hydraulic jacks, one channel for flame temperature, three channels for the attached thermocouples on the opening boundary and eight channels for the thermocouples installed into the thermocouple holes. Furthermore, while conducting test a video camera was used to record the experiment.
26
Acoustic emission monitoring and temperature measurement continued after burner was shut down to allow recording the propagation of cracks during cooling process. After cooling back to ambient temperature (room temperature), thermal fracturing on the block surfaces and spalling on opening boundary was measured. The spalling material were collected after fire and the mass of spalling material was weighted and the largest chip size was measured too. In order to measure the volume of spalling material inside an opening, the opening boundary was first mechanically scaled by blowing gently through the opening. A home-made tool was used to measure the radius change along the periphery of the opening with 45° interval as well as 5 cm interval along the opening axis. Even though this measurement tool was not designed to provide accurate results, it is enough to use the measurement results to show the difference for blocks tested at different conditions, which can be seen in next section. The measurement procedure during and after test is presented in Figure 4-6. According to previous tests, spalling could be observed after 25 minutes heating [5], therefore each block was heated around 25 minutes in these tests.
Temperature Measurement
Acoustic Emission Monitoring
Video recording
Damage Measurement Test
Conduct
During Test Post-Test
Load Measurment
27
Fire in an opening
Table 4-1 Test Condition
Sample code G7 S7 G8 A8 S8 G9 A9
Rock type Granite Schist Granite Gabbro Schist Granite Gabbro
Water-stored
•
•
•
Oven-dried
•
•
•
•
Biaxial stress
•
•
•
•
•
•
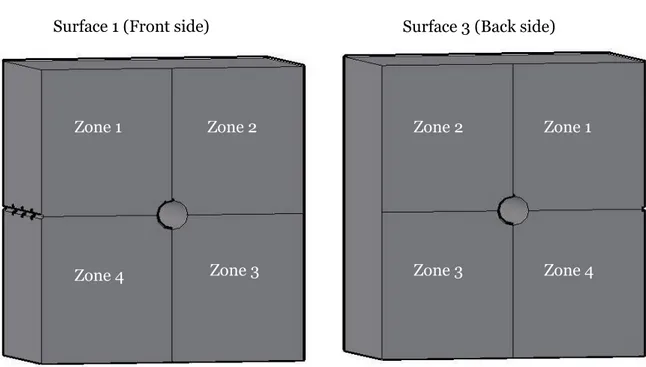
Figure 4-7 Zone division on front and back sides of a block
Zone 2 Zone 1 Zone 3 Zone 4 Zone 2 Zone 1 Zone 3 Zone 4
Surface 3 (Back side) Surface 1 (Front side)
As mentioned before, seven different rock samples were taken into consideration during these tests. The test design in respect of water condition and confinement is listed in Table 4-1.
Also in order to illustrate the crack position, a mesh-like layout with 4 zones is defined on block surfaces. The front surface which is exposed to the burner is called “Surface 1” and the back side of the block which is opposite to the Surface 1 is called as “Surface 3”, see Figure 4-7. Note that the written order in this chapter is based on lab observations, video recording and pictures review.
28
Granite blocks
Granite block, G7
The rock blocks - G7 was tested previously and exposed to high temperature concentrated flame in the centre of blocks; however the observed damage was located within a small area and was removed during the drilling. Therefore, it has been used as a “new block” in this test. Furthermore, four thermocouple holes were drilled in different depth from the previous tests and were filled with sand [3]. These thermocouple holes were positioned parallel to the opening axis in the current test.
2 minutes after ignition: thermocouple 1 (Temp 1) detached from the boundary of the
opening.
11 minutes after ignition: first crack was observed on Surface 1, Zone 2 at an approximate
inclination of 35 close to the right side of the surface. (Crack ① in Figure 4-9).
12 minutes after ignition: one horizontal and one vertical cracks propagated
perpendicularly through the central line of the opening (Cracks ② and ③ in Figure 4-9).
13 minutes after ignition: the amount of spalling material inside and outside the opening
increased significantly.
As it is shown in Table 4-1, G7 block was tested under biaxial stress condition. Before fire, the stresses were applied on rock surfaces and kept constant at 500 kN. As soon as the burner was ignited, data logger started to record temperature inside the opening and thermocouple holes as well as flame temperature. During the fire, the events were summarized in timeline as following. It should be noted that all red lines in following CAD drawings indicate the initiation positions of the cracks.
4 minutes after ignition: spalling starts. Small pieces of material jumped off the opening
29
Figure 4-8 Spalling material (G7)
17 minutes after ignition: the first crack appeared on zone 2 of surface 3, and propagated
horizontally toward the central line of the opening (Crack ④ in Figure 4-9).
18 minutes after ignition: thermocouples 2 (Temp 2) detached from the boundary of the
opening.
23 minutes after ignition: burner was turned off and the temperature on the opening
boundary started to decrease.
Spalling chips
30
Figure 4-9 Chronology of cracks propagation (G7)
Figure 4-10 Spalling inside the opening and ejection on the surface 1 (G7)
The boundary of the opening (mostly form the middle to the end) was covered with soot. Due to propagation of crack in a plane parallel to the opening alignment the whole block In addition to observed cracks during the test, an ejection was also observed after removing the protective plate (Figure 4-10). Color of granite around the opening was turned into beige; this color change was observed at about 20 mm from the opening boundary.
31
Figure 4-11 Damage mapping of back surface 3 (G7)
Table 4-2 Depth of spalling (G7)
Distance from front surface (mm) 1 - Roof (mm) 2 - 45° 3 - right wall 4 - 135° 5 - floor 6 - 225° 7- left wall 8 - 315° 50 9 4 7 2 2 8 14 10 100 15 13 9 4 2 8 17 17 150 24 20 15 8 3 9 29 28 200 24 19 16 5 4 8 24 29 250 16 12 8 4 4 7 19 15 G7
Opening Cross Section and Measurement Points
became unstable. This crack reached the top of the surface of the block. The image of the surface 3 is presented in Figure 4-11.
The remaining of spalling chips inside the opening was collected by gently blowing air into the openings. As it is mentioned before, in order to estimate the depth of spalling inside the opening, the measurements have been carried out at 50 mm intervals along the opening and the results are presented in Table 4-2.
The maximum depth of spalling for G7 was 29mm on left wall. Figure 4-12 presents the distribution of thermal spalling. As it is shown in Figure 4-12, most of spalling was occurred on the left wall boundary of the opening.
32
Figure 4-12 AutoCAD model of spalling distribution, left: top view, right: isometric view (G7)
Granite block, G8
The oven dried granite block, G8, was the only block tested without confinement otherwise the test condition was quite similar to the previous test. Block was disintegrated completely after five minutes heating and snapping sound could be heard frequently during the test. Timeline of G8 is presented as follows:
Figure 4-13 First crack initiates after two minutes heating (G8)
2 minutes after ignition: first crack initiated on zone 2 of surface 3 at an approximate
33
4 minutes after ignition: the whole block moved 2 cm due to high density of cracks and its
propagation. Some cracks with different alignment generated simultaneously which were propagated in plane (along the opening direction) and observed in both surfaces 1 and 3. All thermocouples inside the opening detached from the boundary.
Figure 4-14 Chronology of cracks propagation (G8)
7 minutes after ignition: spalling observed inside the opening.
8-24 minutes after ignition: existing fractures propagated toward the centre and amount
of spalling material increased slightly. Some pieces of spalling jumped off from the boundary of the opening.
3 minutes after ignition: a crack initiated on zone 2 of surface 1 at an approximate
inclination of 10(Crack ② in Figure 4-14).
5 minutes after ignition: one vertical crack propagated perpendicularly through the central
line of the opening on surface 1 (Crack ③ in Figure 4-14).
6 minutes after ignition: a crack generated on zone 4 of surface 1 at an approximate
inclination of 80 (Crack ④ in Figure 4-14).
8 minutes after ignition: a crack generated on zone 4 of surface 2 at an approximate
34
25 minutes after ignition: burner was shut down.
After test, two failure planes along the opening’s direction which divided the block completely (Figure 4-15).
Figure 4-15 Damage mapping (left: surface 1 and Right: surface 3) (G8)
The range of color change was expanded up to 60 mm from the opening boundary on front and back surfaces. The amount of spalling chips were quite low and mostly observed on the floor (Figure 4-16). After joint mapping and during transportation, block was collapsed entirely (Figure 4-17).
35
Figure 4-17 Pieces of granite after test (Left: surface; Right: opening boundary inside the block) (G8)
Granite block, G9
Granite block G9 was removed from the tank a day before the test, and thermocouples were attached in proper positions after that block was wrapped in plastic sheet and kept in room temperature. Timeline of the test is presented as follows:
2 minutes after ignition: small water stain appeared on surface 1.
3 minutes after ignition: spalling started and small pieces of spall material jumped off the
boundary of the opening. Thermocouple 3 (Temp 3) detached from the opening boundary.
4 minutes after ignition: fractures initiated on the surface 1. Two vertical and horizontal
cracks propagated toward the centre of block (Cracks ① and ② in Figure 4-18). A crack was generated on zone 3 of surface 1 with an inclination of 20(Crack ③ in Figure 4-18).
36
Figure 4-18 Chronology of cracks propagation (G9)
7 minutes after ignition: spalling occurred on the surface 1 close to the top of the opening,
where water stain was observed, see Figure 4-19.
Figure 4-19 Spalling and water stain on the surface of block (G9)
5 minutes after ignition: a crack was observed on the zone 3 of surface 3 at approximate
37
15 minutes after ignition: surface ejection occurred on the zone 4 of surface 3.
22 minutes after ignition: surface ejection occurred on the surface 3 at the bottom of the
opening.
25 minutes after ignition: burner was shut down.
After the test on block G9 with granite material, several cracks were observed on both sides (Figure 4-20). As it is mentioned before, while conducting the test, two ejections occurred on surface 3, but after shutting down the burner and removing the protective plate, two more ejections were observed on surface 1 (Figure 4-21).
Figure 4-20 Damage mapping (left: surface 1 and Right: surface 3) (G9)
8 minutes after ignition: a crack was generated on the zone 2 of surface 3 at approximate
38
Figure 4-21 Ejection on the surface 1, top of the opening (G9)
Despite the observed ejections and cracks, granite block remained stable. It was also observed that the color of water-stored block did not change significantly, however, it was changed very slightly around the opening’s boundary.
Figure 4-22 opening boundary after the test (G9)
Most of spalling occurred on both side of the opening walls, however, it was also observed that spalling occurred on the roof and floor (Figure 4-22). The depth of spalling material is presented at Table 4-3 and illustrated by AutoCAD (Figure 4-23).
39
Table 4-3 Depth of spalling (G9)
Figure 4-23 AutoCAD model of spalling distribution, left: top view, right: isometric view (G9)
Gabbro blocks
Gabbro block, A8
A8, is an oven dried gabbro block tested under bi-axial stress condition and thermocouples were installed by following “pattern B”. The test timeline is presented below.
2 minutes after ignition: thermocouple 2 (Temp 2) detached from the opening boundary. Distance from front surface (mm) 1 - Roof (mm) 2 - 45° 3 - right wall 4 - 135° 5 - floor 6 - 225° 7- left wall 8 - 315° 50 15 15 16 4 2 3 11 18 100 24 24 16 3 2 4 21 26 150 30 28 18 5 2 7 20 33 200 18 25 16 2 2 2 13 29 250 9 6 4 3 0 5 12 11 G9
Opening Cross Section and Measurement Points
6 minutes after ignition: spalling started inside the opening, however the spall materials
40
Figure 4-24 Spalling inside the opening (A8)
13 minutes after ignition: two cracks propagated through the centre of block horizontally
and almost in the same alignment on zone 1 and zone 2 of surface 1 (Cracks ① and ② in
Figure 4-25 Chronology of cracks propagation (A8)
Figure 4-25).
15 minutes after ignition: a crack was observed in zone 4 of surface 3 which propagated
41
21 minutes after ignition: spalling progressed inside the opening. 24 minutes after ignition: the burner was shut down.
As it is mentioned, during this test, some spalling was observed, but no spalling material jumped off from the opening. Two cracks were propagated along the plane parallel to the opening’s direction, and the color of gabbro block became slightly lighter in 30 mm distance from the opening (Figure 4-26).
Figure 4-26 Damage mapping (left: surface 1 and Right: surface 3) (A8)
As it can be observed in Figure 4-27, most of spalling occurred on the side walls of the opening, however less amount of spalling was observed on the roof and floor. Chips were attached to the opening’s boundary and external force was required to remove them, and the second half of the opening was covered by soot completely.
18 minutes after ignition: a crack was observed on zone 3 of surface 1 at an approximate
inclination of 45 close to the right edge of the surface (Crack ④ in Figure 4-25).
20 minutes after ignition: a crack generated in zone 2 of surface 3, almost horizontally
42
Figure 4-27 Opening boundary after the test (A8)
Gabbro block, A9
Gabbro block, A9 was tested under biaxial stress condition. The block was kept in the tank until the test day, and all the preparations were applied just before test in order to retain the water content. The test timeline is presented below.
Figure 4-28 Spalling inside the opening (A9)
43
Figure 4-29 Chronology of cracks propagation (A9)
8 minutes after ignition: thermocouple 1 (Temp 1) detached from the opening boundary.
10 minutes after ignition: water stain appeared on the surface 1.
13 minutes after ignition: more water stains appeared on the both sides of the block. 6 minutes after ignition: first crack initiated on zone 3 of surface 1 at approximate
inclination 50 (Crack ① in Figure 4-29).
7 minutes after ignition: the initiated “crack ①” propagated through the opening
alignment, hence a crack was observed on the zone 3 of surface 3 at the same inclination (Crack ② in Figure 4-29).
9 minutes after ignition: a vertical crack propagated on top of the opening on surface 1
(Crack ③ in Figure 4-29).
11 minutes after ignition: on the top of the opening a vertical crack initiated on the surface
3 (Crack ④ in Figure 4-29).
12 minutes after ignition: a horizontal crack initiated on the zone 2 of surface 1 (Crack ⑤
44
24 minutes after ignition: burner was shut down.
Figure 4-30 Damage mapping (left: surface 1 and Right: surface 3) (A9)
17 minutes after ignition: a crack initiated on the zone 1 of surface 1 at an approximate
inclination of 35 (Crack ⑥ in Figure 4-29).
As it is mentioned, during the test on A9 block with gabbro material, three cracks propagated along the opening’s direction, but block was remained stable; and the color of gabbro around the opening became slightly lighter at approximately 20 mm from boundary (Figure 4-30).
As it can be observed in Figure 4-31, spalling occurred on the boundary and was distributed on the side walls, roof and floor of the opening, but chips did not jump off or detached. After the burner was shut down, spalling materials were collected by blowing inside the opening.
45
Figure 4-31 Opening boundary after the test (A9)
Schist blocks
Schist block, S7
5 minutes after ignition: the first crack appeared on the top of surface 1, and then
propagated vertically through the centre of block (Crack ① in Figure 4-32).
7, is an oven dried schist block tested under biaxial stress condition. Thermocouple holes for S7 were drilled according to “Pattern A” of Figure 4-2 and the holes were filled with cement and water. During the fire, the events were summarized in timeline as follows.
46
Figure 4-32 Chronology of cracks propagation (S7)
6 minutes after ignition: snapping audible sound was generated.
9 minutes after ignition: a crack propagated on zone 3 of surface 1 at an approximate
inclination of 20 toward the centre and close to the right side of the surface 1 (Crack ② in
26 minutes after ignition: burner was shut down. Figure 4-32).
10 minutes after ignition: two cracks were generated on surface 1, one of them propagated
vertically toward the centre (Crack ③ in Figure 4-32) and second one propagated at inclination of 45 on zone 3 (Crack ④ in Figure 4-32).
11 minutes after ignition: first crack was observed near the top of surface 3, which
propagatedhorizontally through the central line of the opening (Crack ⑤ in Figure 4-32).
16 minutes after ignition: a horizontal crack was generated on the surface 3, zone 4 (Crack
⑥ in Figure 4-32).
21 minutes after ignition: a crack on zone 3 of surface 3 initiated at inclination of 45 (Crack ⑦ in Figure 4-32).
47
Figure 4-33 Damage mapping (left: surface 1 and Right: surface 3) (S7)
Figure 4-34 Opening boundary after fire (S7) Figure 4-35 Crack propagation on the top of the (S7)
Schist block, S8
The last tested block was the water-stored schist which was tested under bi-axial stress loading condition. Block was kept in water tank until the test date. After taking out the block, During this test spalling did not occur inside or around the boundary of the opening. As it can be observed in Figure 4-33, six main cracks propagated from the surface of block toward the boundary of opening, and the color of schist became slightly lighter around the opening.
The opening’s shape did not change (Figure 4-34). The opening’s axis was perpendicular to the schist layer. After the loading cells were removed, it was observed that the whole block and opening were split into two pieces from the location of the pre-existing schist layer (Figure 4-35).
48
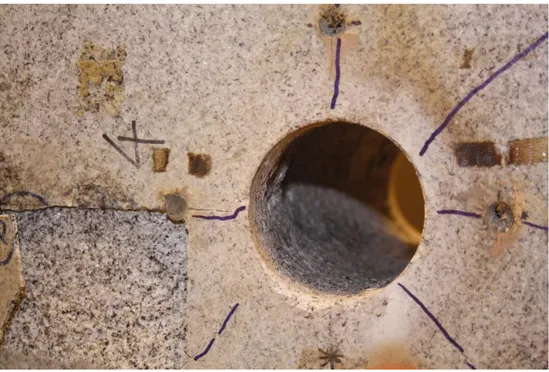
a crack was observed surrounding the surface of block along the layer. Moreover, due to drilling process, some damage was observed around the opening, see Figure 4-36.
Figure 4-36 up: pre-existed on the surface of block, down: damage around the opening (S8)
Following the test the timeline is presented below:
3 minutes after ignition: first crack initiated on zone 3 of surface 1 at an approximate
49
Figure 4-37 Chronology of cracks propagation (S8)
4 minutes after ignition: horizontal crack propagated on zone 4 of surface 1 (Crack ② in
7 minutes after ignition: water stain appeared on the surface 1.
8 minutes after ignition: vertical crack propagated toward the centre of block (Crack ⑤ in
9 minutes after ignition: thermocouple 1 (Temp 1) and thermocouple 2 (Temp 2) detached
from the boundary of the opening.
14 minutes after ignition: more water stains appeared on the surface 1. Figure 4-37).
5 minutes after ignition: crack initiated on zone 1 of surface 1 at an approximate inclination
of 70 (Crack ③ in Figure 4-37).
6 minutes after ignition: crack initiated on zone 2 of surface 1 at an approximate inclination
of 45 (Crack ④ in Figure 4-37).
Figure 4-37), and a crack initiated on the zone 4 at an approximate inclination of 40 (Crack ⑥ in Figure 4-37). Both cracks appeared on surface 3.
18 minutes after ignition: crack initiated on zone 1 of surface 3 at an approximate
50
25 minutes after ignition: burner was shut down.
Figure 4-38 Damage mapping (left: surface 1 and Right: surface 3) (S8)
Figure 4-39 Opening boundary after the test (S8)
After the test, it was observed that four main fracture planes propagated parallel to opening direction and the color of schist block became lighter within 20 mm from the opening boundary (Figure 4-38).
No spalling was occurred inside the opening, but some cracks were observed on the opening boundary along the opening’s direction (Figure 4-39).
51
Figure 4-40 Crack propagation on the surface (S8)
Summary of tests timeline
Table 4-4 Summary of test's timeline
Rock
type
Block
No.
Description
Time of
initiation of
spalling/pitting
(min)
Time of
initiation of
first surface
fracture (min)
Granite
G7
Oven-dried, Under Confinement
4
1
G8
Oven-dried, Without Confinement
7
2
G9
Water-stored, Under Confinement
3
5
Gabbro
A8
Oven-dried, Under Confinement
6
12
A9
Water-stored, Under Confinement
3
6
Schist
S7
Oven-dried, Under Confinement
No Spalling
5
S8
Water-stored, Under Confinement
No Spalling
3
Mass of spalling
After the burner was shut down and the loading cells were removed, block was totally separated due to open cracks along the pre-existing schist layer (Figure 4-40).
The summary of experimental results is presented in Table 4-4. As it is mentioned before, the data are gained by observation during the experiment and analysis of the photos and videos.
The mass of spalling material was measured in order to make a rough quantification of degree of spalling. For this purpose material both inside the opening and jumped off from opening, were collected and weighted separately (Figure 4-41).
52
Figure 4-41 Spalling materials collected after test (G9) Figure 4-42 Spalling chips (A9)
Figure 4-43 Mass of spalling material
Table 4-5 Size of the biggest spalling chip
Block G7 G9 A9
Size of the biggest chip (mm) 20 46 52
As it was mentioned earlier, the spalling was occurred on both water-stored and oven-dried granite blocks and water-stored gabbro under bi-axial stress condition. The mass of spalling material of these blocks are presented in Figure 4-43.
As it is shown in Figure 4-42, the biggest chip for each test was measured and results are presented in the Table 4-5.