NEW OPPORTUNITIES PROVIDED BY THE SWEDISH
ELECTRICITY METER REFORM
Fredrik Wallin
2010
Copyright © Fredrik Wallin, 2010 ISSN 1651-4238
ISBN 978-91-86135-54-6
Copyright © Fredrik Wallin, 2010 ISSN 1651-4238
ISBN 978-91-86135-54-6
Printed by Mälardalen University, Västerås, Sweden
NEW OPPORTUNITIES PROVIDED BY THE SWEDISH ELECTRICITY METER REFORM
Fredrik Wallin
Akademisk avhandling
som för avläggande av teknologie doktorsexamen i energi- och miljöteknik vid Akademin för hållbar samhälls- och teknikutveckling kommer att offentligen försvaras onsdagen den 24 februari, 2010, 10.00 i Kappa, Mälardalens högskola,
Västerås.
Fakultetsopponent: Professor David Natusch, Managing Director of Resource Development Ltd, Hunterville, Nya Zeeland
Abstract
The reduction of the impact of energy consumption is a priority issue and a major challenge that concerns every country in the world. This is a complex task that needs to be tackled from several angles in the search for areas where optimizations and savings can be made. In Sweden an electricity meter reading reform was fully implemented by 1st July 2009, including 5.2 million customers, and
this created new set of circumstances in the Swedish electricity market. The main purpose of this thesis work has been to investigate the possibilities of increasing the use of remote meter readings. Two research questions have been: “How can the electricity market benefit from remote collected meter readings?” and “Where do barriers appear when utilizing meter readings?”. The work started in 2000/2001 to study Internet based applications that visualize electricity consumption patterns. Over these years the daily internet users have increased from approximately 40 % to 73 % and new markets for web-based applications have evolved. These solutions can be important in the forthcoming years as energy portals that hold new energy services. Experiences from new installations indicate that at least interested customers do submit information concerning building and household properties through internet. Still, it is challenging to enable the majority of customers to take part in these new solutions. It may therefore be important to remind customers on a regular basis in order maintain the frequency using the application and to make it habitual. Further the introduction of demand-based pricing allows electricity distribution utilities to achieve a stronger correlation between peak loads in the distribution network area and their revenues.
ISSN 1651-4238
ISBN 978-91-86135-54-6
1
Abstract
The reduction of the impact of energy consumption is a priority issue and a major challenge that concerns every country in the world. This is a complex task that needs to be tackled from several angles in the search for areas where optimizations and savings can be made. In Sweden an electricity meter reading reform was fully implemented by 1st July 2009, including
5.2 million customers, and this created new set of circumstances in the Swedish electricity market. The main purpose of this thesis work has been to investigate the possibilities of increasing the use of remote meter readings. Two research questions have been: “How can the electricity market benefit from remote collected meter readings?” and “Where do barriers appear when utilizing meter readings?”. The work started in 2000/2001 to study Internet based applications that visualize electricity consumption patterns. Over these years the daily internet users have increased from approximately 40 % to 73 % and new markets for web-based applications have evolved. These solutions can be important in the forthcoming years as energy portals that hold new energy services. Experiences from new installations indicate that at least interested customers do submit information concerning building and household properties through internet. Still, it is challenging to enable the majority of customers to take part in these new solutions. It may therefore be important to remind customers on a regular basis in order maintain the frequency using the application and to make it habitual. Further the introduction of demand-based pricing allows electricity distribution utilities to achieve a stronger correlation between peak loads in the distribution network area and their revenues.
2 3
Svensk sammanfattning
Att reducera energiförbrukningens inverkan på bl.a. hälsa och miljö är en stor utmaning som berör alla länder. Uppgiften är komplex och den behöver angripas från flera olika håll i sökandet efter områden där besparingar och optimering av energiförbrukningen kan åstadkommas. I Sverige genomfördes den beslutade mätarreformen fullt ut den 1:a juli 2009. Den omfattar 5.2 miljoner mätpunkter och har skapat helt nya förutsättningar för den svenska elmarknaden. Kan denna nya teknik användas till något mer än att förse kunderna med en exakt faktura på den senaste månadens elförbrukning?
Detta arbetes övergripande syfte har varit att undersöka möjligheterna med de installationer av fjärravlästa mätsystem som nu genomförts i Sverige. Två forskningsfrågor är: ”Hur kan aktörer på den svenska elmarknaden tjäna på de genomförda installationerna av fjärravlästa elmätare?” och ”Var uppstår det barriärer när dessa insamlade mätvärden ska användas?”. Arbetet startade redan under 2000/2001 med att se vilka strukturer som behövdes för att hantera de insamlade mätvärdena. Redan från starten har en utgångspunkt varit att internetanvändningen kommer att öka, och webbaserade lösningar kan komma att bli viktiga även för energibranschen. Det har också visat sig att från 2003 till 2009 har den dagliga internetanvändningen ökat från 40 % till 73 % och detta i sig har skapat förutsättningar för helt nya tjänster. Den första tjänsten som skapades av oss var en tjänst som presenterade energiförbrukning till vanliga elkunder. I arbetet gjordes försök med att dela upp de enskilda kundernas elförbrukning på en temperaturrelaterad och icke temperaturrelaterad del. Vidare föreslogs att kunderna bör kunna jämföra elförbrukningen med tidigare månader. Positivt är att fem år senare, 2007, implementerades liknande regler i STEMFS 2007:5. Energimarknadsinspektionen har även angivit att elnätsföretag uppfyller det nu gällande energiinformationskravet om förbrukningen tillhandahålls via internet. Användningen av denna typ av tjänst har varit tvetydlig. Generellt kan sägas att användningen minskar efter det att kunderna använt informationstjänsten ett tag och det får anses vara en utmaning hur användningen av exempelvis energiinformation ska bibehållas och gärna öka. Sammanställd användarstatistik från tre olika systeminstallationer för presentation av energiinformation via internet, gjorda i Götene, Smedjebacken, Sala-Heby, har visat på att användningen efter endast en månads användande uppgår till cirka 5 % av samtliga kunder. Av dessa användare har hälften även angett ytterligare information om sitt hus och hushåll.
Vidare har analysverktyg för nya priser och tariffer föreslagits och utvecklats. Tre tariffer har utvärderats, varav två var effektbaserade. En av de effektbaserade tarifferna baserades på den
4
modell som implementerats i Sollentunas elnätsområde, med tre effekttoppar som beräknas mellan 07 och 19 varje vardag. Det ingår även en fast avgift för denna tariffkonstruktion. Den andra effektbaserade tariffen benämndes som säsongsbetonad variant och har inte varit differentierad över dygnets timmar eller veckans dagar. Effekttarifferna jämfördes mot en traditionell energitaxa. Resultatet visar att elnätsbolag kan få en starkare koppling mellan effekttoppar och intäkter samt att kunder med tillsynes något mer ofördelaktigt elförbrukningsmönster (höga effekter och lägre energianvändning) i högre utsträckning berörs av prisökningar.
Vidare har två olika metoder föreslagits. En metod syftar till att återskapa timförbrukningsprofiler i elnätsområden med begränsad tillgång på timvärden medan den andra metoden syftar till att dela upp elförbrukningen ytterligare på dellaster som exempelvis värme. För att generera timprofiler på en övergripande nivå har energianvändningen och en tidsstämplad effekttopp använts, d.v.s. i stället för 24 timvärden per dygn utgår modellen från endast två värden. Resultaten var goda och det bedöms att med förfiningar kan noggrannheten förbättras avsevärt. Ett användningsområde kan vara att reducera insamlad förbrukningsinformation. I arbetet med att på individuell basis detaljbestämma olika typer av förbrukning har vi tittat på 14 hus där endast eluppvärmning har varit installerat. Resultatet visar att det efter analyserna går att se ett samband mellan husets aktuella värmebehov och olika byggår. Detta ger en indikation på att metoden bör undersökas mot fler parametrar och med ett större urval av hushåll.
I detta arbete som utförts har även ett flertal barriärer upptäckts. Det finns idag elnätsbolag som samlar in information med en för låg upplösning på mätdata, d.v.s. med för få decimaler. Ibland beror detta på egenskaper hos hårdvaran, men ofta handlar det om mjukvarukonfigurationer. Effekten av detta är att värdefull information kan förloras utan att många elnätsbolag egentligen är medvetna om detta. Speciellt tydligt blir det då förbrukningsinformation ska presenteras på exempelvis timnivå, där småförbrukare får ett ojämnt, nästan slumpmässigt förbrukningsmönster. Vidare så har samtliga genomförda projekt fått svårigheter när det kommer till mätvärdeshanteringen och tillgång till mätvärden. Det är tydligt att vissa av problemen uppstår för att kompetensen om hur mätsystemen fungerar och hur mätvärden lagras inte finns inom den egna organisationen. Detta tyder på att det uppstått ett kunskapsglapp, och det är ett problem då vissa energiföretag inte heller har kompetensen inom företaget. Personerna med kunskap om energi och el är inte samma personer som de som behärskar datahantering och som kan förstå och utnyttja mätvärdena fullt ut. Detta kan på sikt leda till problem och bromsa utvecklingen av energitjänster som relaterar till insamlade mätvärden.
5
Acknowledgement
There are a number of people that I would like to thank for their contributions, discussions, help and encouragements over the years.
First of all I would like to express my sincere gratitude to Professor and main supervisor Erik Dahlquist for giving me the opportunity to start graduate studies at Mälardalen University, for his inspiration, ideas, positivism and inscrutable source of energy. I would also like to thank my co-supervisor Dr. Eva Thorin for invaluable guidance, structure and always having time for discussions, my co-supervisor Dr. Peter Roots for providing specific knowledge in building modeling and for understanding the challenge in using real meter readings.
I would also like to recognize the contribution of organizations that have funded and supported the research projects in different ways: Swedish Energy Agency, Mälarenergi AB, Eskilstuna Energi & Miljö AB, Smedjebacken Energi & Vatten AB, Sala-Heby Energi AB, Sollentuna Energi AB, Bostad AB Mimer and Eskilstuna Kommunfastigheter AB.
I would further like to extend my thanks to co-authors in the different papers, included in the thesis or not. Cajsa Bartusch, Andreas Kvarnström, Johan Kvarnström, Erik Dotzauer, Tobias Bäckström, Iana Vassileva, Monica Odlare, Jörgen Marks, Jan-Erik Mattsson and Mikael Larsson, all contributing with their specific expertise.
My gratitude also goes to all my colleagues, present and former, at the School of Sustainable Development of Society and Technology (HST), former Department of Public Technology (IST) and Department of Energy Technology (IET). To mention few of them: Anders Avelin, Johan Jansson, Fredrik Starfelt, Emma Nehrenheim, Ana Paz, Mia Kumm, Björn Widarsson, Ulf Sand, Jenny Nyström, Christer Karlsson, Adrian Rodriguez, Jan Sandberg, Lars Wester, Jinyue Yan, Robert Öman, Karin Spets, Gert Bard and Sune Lundin.
To Stefan Jonsson, Andreas Hjertström and Thomas Nolte, School of Innovation, Design and Engineering.
To Lennart Ytter, Elisabeth C. Andersson and Kjell Waltersson for many interesting discussions and years of negotiation in the name of SACO.
To my colleague, cousin and friend Peter Wallin and his wife Katarina Wallin for waiting for me in the running track, swimming lessons, dinners, many laughs and stupid ideas like Vasaloppet.
6
Finally, to my family and friends for giving me love and support. To Jill, the woman in my life, for love, patience and understanding. To our children William, Kajsa, Ella and Martin for just being so important to me. To my mother Annelie, for support, lunches and always helping out when time is not enough. To my father Kenneth, Karin, my sisters Anna and Emma, my brother Alfred, and of course little Liam, who I am looking forward to meet.
To all those I should have mentioned…
Fredrik Wallin Västerås, February 2010
7
List of publications
Publications included in the doctoral thesis
Paper A: Fredrik Wallin and Erik Dahlquist. A Web-based Dynamic Simulator for Applications in Process Industry and for Education. In Proceedings of the 43rd Conference on Simulation and Modeling, Oulu, Finland, September 2002.
Paper B: Fredrik Wallin, Cajsa Bartusch, Eva Thorin, Tobias Bäckström and Erik Dahlquist. The Use of Automatic Meter Readings for a Demand-Based Tariff. In Proceedings of the 2005 IEEE/PES Transmission and Distribution Conference & Exhibition: Asia and Pacific, Dalian, China, August 2005.
Paper C: Fredrik Wallin, Eva Thorin, Andreas Kvarnström, Johan Kvarnström and Erik Dahlquist. A Method to Refine Electricity Consumption Data from Automatic Meter Reading Systems. In Proceedings of the IEEE/PES POWERCON 2006, Chongqing, China, October 2006.
Paper D: Fredrik Wallin, Erik Dotzauer, Eva Thorin and Erik Dahlquist. Automatic Meter Reading Provides Opportunities for New Prognosis and Simulation Methods. In Proceedings of IEEE/PES Power Tech 2007, Lausanne, Switzerland, July 2007
Paper E: Fredrik Wallin, Cajsa Bartusch, Eva Thorin and Erik Dahlquist. Important Parameters for Prediction of Power Loads - A Bottom-Up Approach Utilizing Measurements from an Automatic Meter Reading System. In Proceedings of the IEEE PES PowerAfrica 2007 Conference and Exposition. Johannesburg, South Africa, July 2007.
8
Other publications not included in the thesis
Bartusch, C., Larsson, M., Wallin, F. and Dahlquist, E. Potential of hourly settlements in the residential sector of the Swedish electricity market – Estimation of risk reduction and economic result, The First International Conference on Applied Energy (ICAE09), Hong Kong, January 5 – 7, 2009.
Bartusch, C, Odlare, M., Wallin, F. and Dahlquist, E. Electricity consumption in single-family houses. In Proceedings of Energitinget Scientific sessions on Green energy and IT, Älvsjö, March, 2008.
Vassileva, I., Bartusch, C., Wallin, F, Dahlquist E. A simulation model of the interactions between power producers and customers. In proceedings of SIMS 2008, Oslo, Norway, October 7-8, 2008.
Dahlquist, E. and Wallin, F. Studie för att undersöka nyttan för nätägare med AMI/AMR (Investigating benefits with AMI/AMR for electricity distribution utilities), Elforsk rapport 09:97, Stockholm, Sweden, 2009. (In Swedish)
Wallin, F. Added Values of Remote Collected Electricity Consumption Data - Software solutions for demand-side management, Licentiate thesis, 2005, ISBN 91-88834-91-3. Marks, J., Mattsson, J.E. and Wallin, F. Träpulver i Torsångs värmecentral : Slutrapport från STEM-projekt P11122-1 Konvertering av oljepannor mindre än 1 MW till eldning med träpulver (Wood powder in Torsång Heat Plant: Final project report to Swedish Energy Agency, P11122-1 Conversion of oil-based heat plant less than 1 MW), DU-SERC--89-SE, 2005, ISSN 1401-7555. (In Swedish)
Dahlquist, E., Wallin, F. and Dhak, J. Experiences of online and offline simulation in the pulp and paper industry, COST-PTS Symposium on Simulation and Process Control for the Paper Industry, Munich, Germany, March, 2004.
Dahlquist, E. and Wallin, F. Dynamic simulators for process control and optimization as well as for operator training in pulp and paper industry, In Proceedings of the 43rd Conference on Simulation and Modeling, Oulu, Finland, September, 2002.
9
Table of contents
Abstract ... 1 Svensk sammanfattning ... 3 Acknowledgement ... 5 List of publications ... 7 Table of contents ... 9 Introduction ... 13 1.1 Background ... 131.2 Motivation and positioning of the work ... 15
1.3 Research questions ... 17
1.4 Methodology ... 17
1.5 Scope and limit ... 18
1.6 Related work ... 22
1.6.1 Europe ... 22
1.6.2 North America ... 25
1.6.3 Asia Pacific... 26
Towards meter reading systems ... 27
2.1 The Swedish Electricity Act ... 27
2.1.1 A transmission and distribution infrastructure ... 27
2.1.2 Deregulation and towards improved customer information ... 29
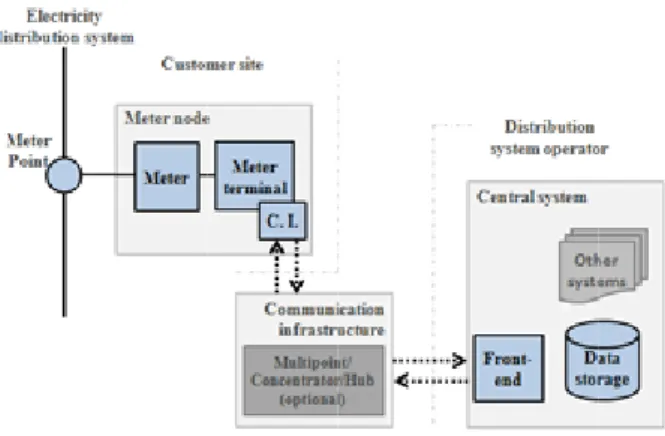
2.2 Remote electricity meter reading systems ... 30
2.2.1 Different names - what’s the difference? ... 30
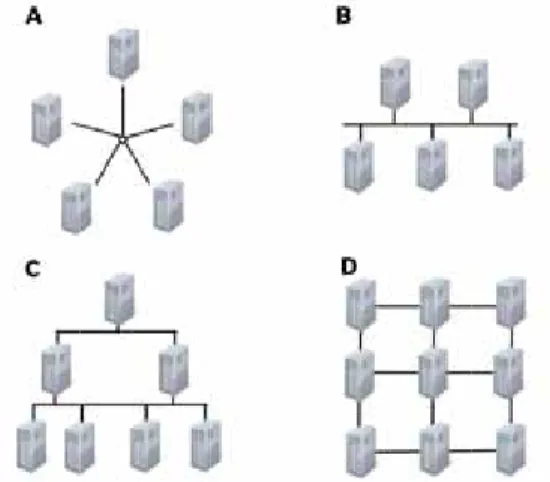
2.2.2 Communication infrastructures ... 32
2.2.3 About standardization ... 35
Results and discussion ... 37
3.1 Architectures and related issues (Mainly Paper A and Paper B) ... 37
3.1.1 Novel programming architecture for the energy sector ... 37
10
3.2 Implemented applications using remote meter readings ... 43
3.2.1 Visualizing energy consumption data (Mainly Paper A) ... 43
3.2.2 An electricity price evaluation tool (Mainly Paper B) ... 47
3.3 Result from economic evaluation of new price structures. (Paper B) ... 50
3.4 Implementation of methods and functions ... 53
3.4.1 Refining meter reading series (Mainly Paper C) ... 53
3.4.2 Extracting information from meter reading series (Mainly Paper D, Paper E and new results) ... 56 3.5 Barriers to implementations ... 65 3.5.1 Technical barriers ... 65 3.5.2 Non-technical barriers ... 66 Conclusions ... 69 Future works ... 71 References ... 73 Appendix ... 81 List of acronyms ... 81 List of notations ... 83
10
3.2 Implemented applications using remote meter readings ... 43
3.2.1 Visualizing energy consumption data (Mainly Paper A) ... 43
3.2.2 An electricity price evaluation tool (Mainly Paper B) ... 47
3.3 Result from economic evaluation of new price structures. (Paper B) ... 50
3.4 Implementation of methods and functions ... 53
3.4.1 Refining meter reading series (Mainly Paper C) ... 53
3.4.2 Extracting information from meter reading series (Mainly Paper D, Paper E and new results) ... 56 3.5 Barriers to implementations ... 65 3.5.1 Technical barriers ... 65 3.5.2 Non-technical barriers ... 66 Conclusions ... 69 Future works ... 71 References ... 73 Appendix ... 81 List of acronyms ... 81 List of notations ... 83 11
Part I
Thesis
12 13
Chapter 1
Introduction
This part presents the motivation and positioning of the work and the set of research questions that are addressed. Finally, there is a discussion of the methodologies used to address each research question and summary of related work.
1.1
Background
The reduction of the impact of energy consumption is a priority issue and a major challenge that concerns every country in the world. This is a complex task that needs to be tackled from several angles in the search for areas where optimizations and savings can be made.
Directive 2006/32/EC of the European Parliament and of the Council of 5 April 2006 on energy end-use efficiency and energy services and repealing Council Directive 93/76/EEC emphasizes the following important recommendations [1]:
- “The improvement of energy efficiency will benefit from an exchange of information, experience and best practice at all levels…”
- “Improved energy end-use efficiency can be achieved by increasing the availability of and demand for energy services or by other energy efficiency improvement measures…”
- “In defining energy efficiency improvement measures, account should be taken of efficiency gains obtained through the widespread use of cost-effective technological innovations, for instance electronic metering…”
- In order to enable final consumers to make better informed decisions as regards their individual energy consumption, they should be provided with a reasonable amount of information thereon and with other relevant information, such as information on available energy efficiency improvement measures, comparative final consumer profiles or objective technical specifications for energy-using equipment […]. In addition, consumers should be actively encouraged to check their own meter readings regularly.”
14
This work was started in parallel with the intensive discussions that initiated the Swedish electricity meter reform in 2001. The underlying drive for the meter reform was to improve on a previous reform, i.e. the deregulation of the Swedish electricity market. In the early years of the reformed electricity market (1996 – 1999), customers were forced to invest in measuring equipment themselves in order to take part in the deregulated market and replace their existing electricity retailer. The investment requirements for new electricity meter reading devices created an economic barrier for small and medium sized consumers and reduced the number of customers willing to be active in the new electricity marketplace. As a direct response to this barrier metering requirement was abolished in favor of a new profile-settlement system. A number of consumption patterns were applied in order to estimate the electricity consumption for each month. A total of 305 different consumption patterns were applied to different groups of customers within specific geographical areas [2].
Another important reason for the discussion about introducing more frequent meter readings was the fact that several studies indicated that there were potential energy savings to be made by improving customer feedback on energy consumption [3] [4] [5]. A major disadvantage of the profile settlement system is that there is no real connection between electricity consumption and the amount of electricity charged for during peak periods for small and medium sized customers. The Government also believed that more focus on electricity consumption could increase customers’ possibility to save energy [6].
The main purpose of this work has been to investigate the possibilities of increasing the use of remote meter readings, as many of the Swedish electricity companies initially focused only on providing monthly invoices based on actual electricity consumption. Improved customer information can lead to more active electricity users. Customer participation is believed to become an important feature in the future electricity system where variations in electric power output are expected to increase due to larger shares of distributed generation by renewable energy, such as solar and wind. To compensate for variable production from the alternative energy sources it is important to influence the consumption. New incentives for the customers could be new price models and a better understanding of the individual consumption patterns in order to decrease the imbalance between production capability and consumption demand.
15
1.2
Motivation and positioning of the work
The decision in 2003 to introduce more frequent meter readings is considered an important milestone in the development of the electricity market. The electricity distribution utilities were obliged to implement the regulations on hourly based metering and monthly meter reading by 1st July 2006 and 1st July 2009 respectively. As a result of the electricity meter
reading reform the distribution utilities have made large investments in different remote meter reading systems with two main aims:
To read and report consumer’s electricity meters at least once a month. To base customer invoices on actual electricity consumption.
During the initial discussions, meetings and seminars there was a strong focus on how to minimizing the investment cost. There were also concerns about which technical solutions that were actually able to fulfill the minimum requirements, and the authorities worked intensively to specify and improve the relevant regulations. At this time, in 2002/2003, the electricity market operators had very limited information and knowledge of the potential benefits of remote meter readings. Several activities were initiated at the time in order to create and assemble knowledge banks in different areas such as technologies, roll-out methods and business cases regarding added values that could be coupled to the forthcoming system installations. The increased requirements on electricity distribution utilities for improving meter reading indeed created new conditions for the electricity market. These corresponded well to the ongoing research and research strategy at School of Sustainable Development of Society and Technology at Mälardalen University, which became a natural discussion and working partner for the regional energy industry:
- “To develop innovative solutions and tools in the areas of energy, building and environment engineering.”
Excerpt from the research mission of the Process and Resource Optimization research group.
The work
emerging technologies. considered
applied
organization. Part of the work can be seen as a cross such as
illustrated via the Venn diagram in Figure 1.
Figure 1. Positioning of the work.
work accomplished emerging technologies. considered and evaluated
applied methods and tools from the different ation. Part of the work can be seen as a cross
such as such as data mining and economics. The intersection of different subject areas is illustrated via the Venn diagram in Figure 1.
. Positioning of the work.
accomplished during the course of this project emerging technologies. Current
and evaluated. The work
methods and tools from the different ation. Part of the work can be seen as a cross
ch as data mining and economics. The intersection of different subject areas is illustrated via the Venn diagram in Figure 1.
. Positioning of the work.
during the course of this project Current laws, reg
The work began methods and tools from the different ation. Part of the work can be seen as a cross
ch as data mining and economics. The intersection of different subject areas is illustrated via the Venn diagram in Figure 1.
16
during the course of this project laws, regulations and oth
began from the current state of knowledge and has methods and tools from the different existing
ation. Part of the work can be seen as a cross
ch as data mining and economics. The intersection of different subject areas is illustrated via the Venn diagram in Figure 1.
during the course of this project has been influenced by exi
ulations and other requirements have had to be from the current state of knowledge and has
existing fields of knowledge within ation. Part of the work can be seen as a cross-fertilization of naturally related fields
ch as data mining and economics. The intersection of different subject areas is has been influenced by exi
er requirements have had to be from the current state of knowledge and has
fields of knowledge within ertilization of naturally related fields ch as data mining and economics. The intersection of different subject areas is
has been influenced by existing and er requirements have had to be from the current state of knowledge and has
fields of knowledge within ertilization of naturally related fields ch as data mining and economics. The intersection of different subject areas is
sting and er requirements have had to be from the current state of knowledge and has fields of knowledge within the ertilization of naturally related fields ch as data mining and economics. The intersection of different subject areas is
17
1.3
Research questions
The research performed over this period can be summarized as a search for new possibilities at the intersection of a deregulated electricity market, regulated distribution utilities and a meter reading reform that is considered an important milestone for Swedish electricity customers. One reason to explore new solutions related to the meter reading reform has been to provide a broader and more comprehensive base to understand made decisions and to improve future ones.
A general question over this period has been how to maximize the use of detailed consumption data in order to increase the benefits of the investment in remote meter reading systems.
This general question can be divided into several important sub-questions that the individual efforts have each attempted to answer in some form.
RQ1: What are the primary applications possible using remote collected meter readings?
RQ2: How can the electricity market benefit from remote collected meter readings? RQ3: Where do barriers appear when utilizing meter readings?
In order to identify individual pieces of the puzzle and to contribute answers to the questions above, parts of the work have been performed together with regional electricity distributors.
1.4
Methodology
Several processes of change were initiated when the Swedish meter reading reform was established by the Parliament. These processes are creating incentives and opportunities to implement new methods and tools in the electricity market. The outcome of thesis developments will involve several stakeholders, including energy companies, industry and residential customers.
An important part of the methodology has been to work with regional energy companies through discussions, meetings and workshops in order to identify knowledge gaps, future needs and critical issues in the areas affected by the reforms, such as the installation of remote meter reading systems and their integration into daily operations.
18
In the search for answers to the global research questions stated in Section 1.3 several methods and tools have been proposed, analyzed and implemented as a result of this work. A number of these solutions have been evaluated and discussed in the appended papers, and each individual effort has also contributed to a holistic understanding of problems, limitations and structural obstacles that exist in the organizations – both in daily routines as well from a long term perspective.
A bottom-up approach has been used in several parts of the work. In a bottom-up approach the individual base elements of the system are first specified in great detail. These elements are then linked together to form larger systems or software tools.
More specifically, different programming methods have been used to create the necessary software tools described in the papers. The implemented programming methods are considered as state-of-the-art (object-oriented and later component-based) and have been incorporated via the use of Visual Basic, VB.Net and C#, the latter two as a part of the Microsoft .NET framework. In order to implement more advanced mathematical solvers a number of FORTAN libraries were used and routines wrapped in and made accessible via dynamic link libraries (dll). Databases were used to handle the large amounts of electricity consumption data. In the majority of work different versions of Microsoft SQL Server have been used in combination with related graphical user interfaces (Enterprise manager and Query Analyzer).
1.5
Scope and limit
The intended audience for the research described in thesis is researchers working on energy market questions and improved customer integration. As substantial parts of thesis deal with software applications related to remote meter reading and handling large amounts of consumption data it may also be of interest to workers in the area of computer science. The thesis presents an analysis of the effects of new electricity price structures, making it of potential interest to workers in the economics field.
Beyond the academic world the work is aimed to companies that operate primarily in the energy and metering fields, and also those involving future customer-oriented applications and other innovative solutions in the energy sector.
19
Five papers are included in the thesis. They are summarized below, including a description of my personal contribution to each paper.
Paper A – A web-based dynamic simulator for applications in process industry and for education – describes a web-based system architecture that encapsulates functionality in software applications situated on a server and makes it accessible to a user. One aim of this work was to present a system solution provide the following advantages:
To minimize the need for locally installed software and expand the use of the Internet and web browsers.
To streamline the maintenance and updating of software by using centralized installations.
To reducing administration costs and license fees.
The author’s contribution to this paper has been to suggest and implement a general system architecture that is suitable for several purposes, to develop and implement the energy related work both in relation to both the energy simulator and to the information system dealing with electricity consumption data, and to evaluate and customize a graphical user interface. Together with staff from the AMR system provider HM Power, I suggested solutions to refine and recalculate the electricity consumption data and implemented the solutions. Staff from Mälarenergi, especially Andreas Forsman, implemented the web based ASP-solution in their environment. Erik Dahlquist has been a discussion partner.
Paper B – The use of automatic meter readings for a demand-based tariff – describes an implementation and evaluation of a flexible pricing tool. The economic consequences of demand-based time of use (TOU) tariffs, and particularly the effect of the demand-based tariff on revenues of the electricity distribution utility over the year 2003 were analyzed. The paper also includes a study of the impact on individual consumers, which has been made possible by the implemented bottom-up approach.
This work was mainly performed by me. I developed design and structure of the software tool, with inputs from Tobias Bäckström. I subsequently implemented and analyzed the new tariff structures in discussion with Cajsa Bartusch. In the electricity tariff evaluation phase, new tariffs were discussed with Bartusch. Eva Thorin and Erik Dahlquist assisted the work as discussion partners.
20
Paper C – A method to refine electricity consumption data from automatic meter reading systems – describes a method to extract new information from less detailed energy consumption series. One reason for the work was to overcome the problem of missing information on an aggregated system level when estimating the effects of new price structures. Some AMR systems were not designed or configured to handle hourly based meter series and in these cases we wanted to use measured data from a system that reported just two values, total energy and peak load, to describe each 27 h interval. A system that reports hourly based meter series would report 27 values for the same interval.
This work was performed mainly by me with some assistance on the validation from Eva Thorin. Andreas Kvarnström and Johan Kvarnström provided support with knowledge in the programming and database configurations used to implement the method. Erik Dahlquist assisted as a discussion partner.
Paper D – Automatic Meter Reading Provides Opportunities for New Prognosis and Simulation Methods – describes the possibilities of using meter readings to build bottom-up models for prognosis and simulation, and describes an approach to using meter readings for modeling and simulation. This article contributes with a discussion of how to breakdown meter reading series to identify heating properties. It also considers potential problems with the suggested methodology.
I was the main contributor to this work. Erik Dotzauer contributed with experience of statistical models that are useful for modeling household related consumption such as moving average (MA), weighted moving average (WMA), autoregressive moving average (ARMA). Eva Thorin and Erik Dahlquist assisted the work as discussion partners.
Paper E
Approach Utilizing continuation of that could be used information discuss the
obtain more accurate models The work
was main the past year model structure
Mälarenergi, Smedjebacken Energi and Skånska Energi contributed to the
results from partners
Figure 2 questions
Paper E – Important Parameters for Prediction of Power Loads Approach Utilizing
continuation of Paper D. However, in this that could be used
information. Sections of
discuss the usefulness of questionnaires when creating new prognosis models obtain more accurate models
The work was based
was main responsible for conducting several surveys past years, and in this work we have discussed model structure. Bartusch
Mälarenergi, Smedjebacken Energi and Skånska Energi contributed to the
from these surveys. partners
2. An illustration of the relationships between papers questions.
Important Parameters for Prediction of Power Loads
Approach Utilizing Measurements from an Automatic Meter Reading System Paper D. However, in this
that could be used to disaggregate Sections of previous
ness of questionnaires when creating new prognosis models obtain more accurate models.
was based mainly on my previous though responsible for conducting several surveys
and in this work we have discussed Bartusch contributed
Mälarenergi, Smedjebacken Energi and Skånska Energi discussions with
these surveys. Eva Thorin and Erik Dahlquist assisted the work as discussion
An illustration of the relationships between papers
Important Parameters for Prediction of Power Loads
Measurements from an Automatic Meter Reading System Paper D. However, in this
to disaggregate the meter reading series previously performed surveys
ness of questionnaires when creating new prognosis models
mainly on my previous though responsible for conducting several surveys
and in this work we have discussed contributed with
Mälarenergi, Smedjebacken Energi and Skånska Energi s with Bartusch
Eva Thorin and Erik Dahlquist assisted the work as discussion
An illustration of the relationships between papers
21
Important Parameters for Prediction of Power Loads
Measurements from an Automatic Meter Reading System Paper D. However, in this paper we
the meter reading series performed surveys
ness of questionnaires when creating new prognosis models
mainly on my previous thoughts responsible for conducting several surveys and in this work we have discussed
with her experience Mälarenergi, Smedjebacken Energi and Skånska Energi
Bartusch during the
Eva Thorin and Erik Dahlquist assisted the work as discussion
An illustration of the relationships between papers
Important Parameters for Prediction of Power Loads
Measurements from an Automatic Meter Reading System we shifted the
the meter reading series
performed surveys were included in the paper in order to ness of questionnaires when creating new prognosis models
ts on bottom responsible for conducting several surveys, collecting
and in this work we have discussed how questionnaires could be used in a xperience from
Mälarenergi, Smedjebacken Energi and Skånska Energi electricity distribution areas during the preparation
Eva Thorin and Erik Dahlquist assisted the work as discussion
An illustration of the relationships between papers-papers and
Important Parameters for Prediction of Power Loads
Measurements from an Automatic Meter Reading System shifted the focus to different parameters the meter reading series in order to
included in the paper in order to ness of questionnaires when creating new prognosis models
m-up modeling. Cajsa , collecting household information how questionnaires could be used in a
from surveys
electricity distribution areas preparation and analysis
Eva Thorin and Erik Dahlquist assisted the work as discussion
and between the papers
Important Parameters for Prediction of Power Loads - A Bottom Measurements from an Automatic Meter Reading System
different parameters to extract additional included in the paper in order to ness of questionnaires when creating new prognosis models in order to
up modeling. Cajsa Bartusch household information how questionnaires could be used in a
surveys performed in electricity distribution areas
and analysis part of Eva Thorin and Erik Dahlquist assisted the work as discussion
between the
papers-A Bottom-Up Measurements from an Automatic Meter Reading System – is a different parameters additional included in the paper in order to in order to
Bartusch household information over how questionnaires could be used in a performed in the electricity distribution areas. I part of the Eva Thorin and Erik Dahlquist assisted the work as discussion
22
This thesis uses a relatively broad approach meaning that proposed applications have been suggested and evaluated in order to confirm the usefulness. The author is aware that some of the proposed methods can be further evolved and needs additional validation. This is a limitation. This thesis has partly focused on implementations in close cooperation with partners and on solutions that may be automated. Working with persons in various positions in the companies, and with different types of meter reading systems increased the probability to detect different barriers and to understand how these systems are used.
1.6
Related work
1.6.1Europe Sweden
There are several actors investigating the potential in applications and services related to remote meter reading in Sweden. Lund University has been one of the pioneers in this area and started early to investigate the potential of demand-side activities, this included both direct and indirect load control. They have performed related investigations into electricity use and control [7] [8], load demand activities and new price structures [9] [10]. Further the research has concerned presentation and customer perception of electricity consumption statistics [11]. The researchers have continuously used different statistical indicators, and also discussed how these contribute to the evaluation of specific consumption properties, such as coincidence factors, demand factors and load factors [12] [13].
One general experience based on years of work is concluded in the following statement [14]: - “One general conclusion from this research is that there is a lack of knowledge and
information on load demand variation and its consequences both on the demand (consumer) side and the supply (utilities) side. As the case studies show, consumers, especially residential consumers, mostly do not clearly distinguish between load demand (power, kW) and energy use (kWh)”


![Figure 4. The number of distribution system operators/utilities/companies (DSO) has decreased over the years through acquisitions and mergers [37][40][41]](https://thumb-eu.123doks.com/thumbv2/5dokorg/4913050.135240/34.718.95.621.426.711/figure-distribution-operators-utilities-companies-decreased-acquisitions-mergers.webp)