NEAR-INFRARED SPECTRAL
MEASUREMENTS AND MULTIVARIATE
ANALYSIS FOR PREDICTING GLASS
CONTAMINATION OF BOILER FUEL
KIRAN THEKKEMADATHIL SIVARAM
OLIVIA WINN
School of Business, Society and Engineering
Subject: Degree Project in Sustainable Energy Systems Level: A2E
ECTS: 30 hp
Program: Master of Science in Energy Engineering Course Code: ERA401
Supervisor: Dr. Ioanna Aslanidou Examiner: Prof. Erik Dahlquist Date: 2017-05-24
Email: ktm15002@student.mdh.se own15001@student.mdh.se
ABSTRACT
This degree project investigates how glass contamination in refuse-derived fuel for a fluidised bed boiler can be detected using near-infrared spectroscopy. It is motivated by the potential to reduce greenhouse gas emissions by replacing fossil fuels with refuse-derived fuel. The intent was to develop a multivariate predictive model of near-infrared spectral data to detect the presence of glass cullet against a background material that represents refuse-derived fuel. Existing literature was reviewed to confirm the usage of near-infrared spectroscopy as a sensing technology and determine the necessity of glass detection. Four unique background materials were chosen to represent the main components in municipal solid waste: wood shavings, shredded coconut, dry rice and whey powder. Samples of glass mixed with the background material were imaged using near-infrared spectroscopy, the resulting data was pre-processed and analysed using partial least squares regression. It was shown that a predictive model for quantifying coloured glass cullet content in one of several background materials were reasonably accurate with a validation coefficient of determination of 0.81 between the predicted and reference data. Models that used data from a single type of background material, wood shavings, were more accurate. Models for quantifying clear glass cullet content were significantly less accurate. These types of models could be applied to predict coloured glass content in different kinds of background materials. However, the presence of clear glass in municipal solid waste, and thus refuse-derived fuel, limit the opportunities to apply these methods to the detection of glass contamination in fuel.
PREFACE
This degree project was a collaborative effort between Kiran Thekkemadathil Sivaram and Olivia Winn at Mälardalen University in Västerås, Sweden. The combustion of waste as a fuel source is something that was new to both of us when we each arrived in Sweden. This project was motivated by our interest in the problems faced when using waste as fuel; we also wanted to contribute directly to knowledge that reduces the use of fossil fuels.
The total work output was divided equally and all portions were contributed to by both parties: problem definition, literature review, experimental design, data acquisition, data analysis and modelling, discussions and conclusions.
It gives us great pleasure to acknowledge the support and help of everyone who has assisted us while working on this degree project. We would like to give special mention to Dr Ioanna Aslanidou, Professor Konstantinos Kyprianidis, Professor Erik Dahlquist, Dr Jan Skvaril and Joakim Jansson; the knowledge, experience and guidance you have provided has been invaluable during our research. Our fellow student Henric Andersson has also been a fantastic source of feedback during this project.
I, Olivia, would also like to thank my family for supporting me in my studies, in particular my partner Julian, you have been amazing in your support and providing motivation when I needed it most.
I, Kiran, would like to thank and dedicate all my efforts of studies to my parents, brother and in particular my wife Asha, who have been my inspiration, and support.
Olivia Winn Kiran Thekkemadathil Sivaram
SUMMARY
Fossil fuel combustion is a major source of greenhouse gas emissions. In order to limit the global rise in temperatures, it is necessary to severely limit the production of greenhouse gases. Although combustion of refuse-derived fuel emits greenhouse gases, the amount emitted per unit energy is lower than that of fossil fuels and is thus an option for replacement. Glass cullet is often present in refuse-derived fuel, and can cause problems in fluidised bed boilers; thus, it is necessary to find a continuous, fast, cost-effective and reliable process for quantifying glass content in refuse-derived fuel. There is very little research into using near-infrared spectroscopy in this application, but existing literature indicates that it may be a suitable technology, so this technique was chosen for analysis in this work.
This degree project investigates how glass contamination can be detected in individual background materials using near-infrared spectroscopy, and how this technique might be applied to detecting glass in refuse-derived fuel. The intent was to develop a multivariate predictive model of pre-processed near-infrared spectral data with varying amounts of glass in different background materials, which each represent a component of refuse-derived fuel. The near-infrared spectral data was collected experimentally. Samples of clear glass cullet and coloured glass cullet were separately mixed with four different kinds of background materials in varying volume fractions. The background materials tested were wood shavings, shredded coconut, dry rice and whey powder. These samples were placed in a rotating tray and a series of near-infrared spectral scans were captured of each sample. The resulting data was pre-processed using a variety of chemometric techniques and analysed using partial least squares regression. The calibrated models from the partial least squares regression analysis were validated using a full cross-validation process and key regions of the near-infrared spectrum were identified.
Six basic models were developed; three models utilised samples with all four background materials and three models utilised samples with wood shavings as the background material. In each set of three models, one model quantified clear glass content, one quantified coloured glass content, and one used data from the clear glass samples and the coloured glass samples to quantify the total content of both types of glass. The models that used all background materials were able to predict with high accuracy which of the four background materials had been used.
The resulting prediction models for glass content had varying accuracy, the type of glass was found to have a greater effect on model accuracy than the background material. It was shown that predicting the content of coloured glass cullet could be done with high accuracy by the validated models, with coefficients of determination between 0.80 and 0.90; the models of clear glass cullet had a much lower accuracy, with coefficients of determination less than 0.60. The models encompassing both types of glass were of moderate accuracy. The models with only wood shavings as the background material were more accurate than the models using all types of background materials; the coefficients of determination were on average greater by 0.1 for the models with just wood shavings.
It is believed that the differences in accuracy between the different types of models are due to a number of factors. Differences in the prediction accuracy of different glass types are believed to be due to colourants increasing the absorbance of glass in certain regions of the NIR spectrum. For the differences between wood shavings alone and all background materials, chemical differences in the near-infrared spectral data between background material types were found to dominate certain regions of the spectra. This limited the usefulness of a key region identified in the analysis of wood shavings alone.
The types of models investigated in this degree project could be applied to quantitatively evaluate coloured glass content in different kinds of background materials, with the possibility to extend to heterogeneous background materials. Clear glass has been shown to be more difficult to predict using these methods; this limits the potential of applications in detecting glass in refuse derived fuel, due to the presence of mixed type glass in municipal waste.
CONTENTS
1 INTRODUCTION ...1
1.1 Research Outline ... 1
1.2 Aim and Objectives ... 2
1.3 Contribution to Knowledge ... 2
1.4 Delimitations ... 2
1.5 Structure ... 2
2 LITERATURE REVIEW ...3
2.1 Effects of Fuel Contamination ... 3
2.1.1 Fluidised Bed Combustion Boiler Operation ... 3
2.1.2 Agglomeration in Fluidised Bed Boilers ... 3
2.2 Near-Infrared Spectroscopy for Process Monitoring ... 3
2.3 Near-Infrared Spectroscopy and its Applications ... 4
2.3.1 Agriculture and Soil Properties ... 5
2.3.2 Food Science and Food Processing ... 5
2.3.3 Animal Feed Science ... 5
2.3.4 Pulp and Paper ... 5
2.3.5 Waste Management ... 6
2.3.6 Thermochemical Energy Conversion Processes ... 6
2.3.7 Heat and Power Production ... 6
2.3.8 Bio-Crops ... 7
2.3.9 Contaminant Detection in Fuels ... 7
2.3.10 Summary of Near-Infrared Spectroscopy Applications ... 7
2.4 Properties of Refuse-Derived Fuel ... 7
2.4.1 Chemistry of Food ... 8 2.4.2 Chemistry of Paper ... 9 2.4.3 Chemistry of Glass ... 9 2.5 Chemometrics ...10 3 METHODOLOGY ... 11 3.1 Sample Preparation ...12
3.2 NIR Spectra Acquisition ...16
3.3 NIR Spectral Signal Pre-Processing ...17
3.4 Multivariate Analysis ...18
4 RESULTS AND DISCUSSION ... 19
4.1 Multivariate Analysis Including All Background Materials ...20
4.1.1 Near-Infrared Spectra of Samples ...20
4.1.2 Application of Pre-processing to Raw Spectral Data ...23
4.1.3 First Iteration Predictive Model of Pre-Processed Spectral Data ...25
4.1.4 Second Iteration Predictive Model with Removal of Outliers...27
4.1.5 Third Iteration Predictive Model with Data Smoothing ...29
4.1.6 Fourth Iteration Predictive Model using Limited Range of NIR Spectra ...30
4.2 Multivariate Analysis of Clear and Coloured Glass in Wood Shavings ...35
4.2.1 Application of Pre-Processing to Raw Spectral Data ...35
4.2.2 Predictive Model of Pre-Processed Spectral Data ...37
4.3 Comparison of Multivariate Analyses of Clear and Coloured Glass ...39
4.3.1 Wood Shavings as Background Material ...39
4.3.2 All Background Materials ...42
4.4 Summary of Model Accuracy ...44
5 CONCLUSIONS ... 46
6 FUTURE WORK ... 47
REFERENCES ... 48
APPENDIX A: NIR SPECTRA FOR DEPTH TESTING APPENDIX B: SAMPLE VOLUME AND VELOCITY DATA APPENDIX C: OPUS 7.5 MEASUREMENT PARAMETERS
APPENDIX D: MULTIVARIATE ANALYSIS OF FOOD COMPOSITION
APPENDIX E: S-G TRANSFORM ON DATA FOR ALL BACKGROUND MATERIALS APPENDIX F: SPECTRA FOR GLASS TYPE COMPARISON
LIST OF TABLES
Table 1. Minimum Required Depth of Each Sample Type ...14
Table 2. Composition of Tested Samples (suffixes A-F denote coloured glass; suffixes V-Z denote clear glass) ... 15
LIST OF FIGURES
Figure 1. Fractional Composition of Municipal Solid Waste as per data from Patumsawad and Cliffe (2002) ... 8Figure 2. Chemical Composition of Food Types as stated on each food’s packaging ... 13
Figure 3. Measuring Required Sample Depth ... 13
Figure 4. Background Material Samples (clockwise from top left: wood shavings, shredded coconut, whey powder, rice grains)...14
Figure 5. Rice and Coloured Glass Cullet in Test Tray ...16
Figure 6. Capturing Background Scan of Teflon Control ...16
Figure 7. NIR Spectra Capture of Rotating Sample of Wood Shavings ... 17
Figure 8. Examples of Absorption Spectra Clear and Coloured Glass Cullet ...19
Figure 9. Near-Infrared Spectra of all Samples ... 20
Figure 10. Near-Infrared Spectral Data without Overloaded Region ...21
Figure 11. Effects of Data Scatter across all Background Materials ...21
Figure 12. Effects of Data Scatter in each Background Material (clockwise from top left: wood shavings, shredded coconut, whey powder, rice grains) ... 22
Figure 13. Standard Normal Variate Transform applied to Raw Spectra ... 23
Figure 14. Effects of Data Scatter in each Background Material after Standard Normal Variate Transform (clockwise from top left: wood shavings, shredded coconut, whey powder, rice grains) ... 24
Figure 15. Effects of Data Scatter across all Background Materials after Standard Normal Variate Transform ... 24
Figure 16. First Model Iteration Parity Plot for Background Material Prediction... 25
Figure 17. First Model Iteration Explained Variance (left); Parity Plot for Glass Content Prediction (right) ... 26
Figure 18. First Model Iteration Influence Plot ... 26
Figure 19. First Model Iteration Outlier Identification in Raw Spectra ... 27
Figure 20. Second Model Iteration Explained Variance (left); Parity Plot for Glass Content Prediction (right) ... 27
Figure 21. Second Model Iteration Influence Plot ... 28
Figure 22. Second Model Iteration Regression Coefficients ... 28
Figure 23. Third Model Iteration Regression Coefficients ... 29
Figure 24. Wavenumber Range for Fourth Model Iteration Selection ... 29
Figure 25. Fourth Model Iteration Explained Variance ... 30
Figure 26. Fourth Model Iteration Parity Plot for Background Material Prediction ... 31
Figure 28. Fourth Model Iteration Regression Coefficients ... 32 Figure 29. Modelled Wavenumber Range of Pre-Processed Spectra with Known Glass Content ... 33 Figure 30. Summary of Accuracy Improvements by Iteration for Model of Glass in All Background Materials ... 34 Figure 31: Near-Infrared Spectra of Samples used for Glass in Wood Shavings Analysis ... 35 Figure 32: Effects of Data Scatter for Glass in Wood Shavings ... 36 Figure 33: Effects of Data Scatter after Pre-Processing: with SNV (left) with First Derivative S-G after SNV (right) ... 36 Figure 34: Standard Normal Variate and First Derivative Savitzky-Golay applied to Spectral Data ... 36 Figure 35: Regression Coefficients for Full Spectra of Glass in Wood Shavings ... 37 Figure 36. Glass in Wood Shavings Explained Variance (left); Parity Plot (right) ... 38 Figure 37: Regression Coefficients (left) and Influence Plot (right) for Model of Glass in Wood Shavings ... 38 Figure 38: Explained Variance for Models of Clear Glass (left) and Coloured Glass (right) in Wood Shavings ... 39 Figure 39: Parity Plots for Models of Clear Glass (left) and Coloured Glass (right) in Wood Shavings ... 40 Figure 40: Regression Coefficients for Models of Clear Glass (left) and Coloured Glass (right) in Wood Shavings ...41 Figure 41. Representative Range of Pre-Processed Spectra with Known Coloured Glass Content in Wood Shavings ...41 Figure 42. Explained Variance for Models of Clear Glass (left) and Coloured Glass (right) in All Background Materials ... 42 Figure 43. Parity Plots for Models of Clear Glass (left) and Coloured Glass (right) in All Background Materials ... 43 Figure 44. Comparative Summary of Model Accuracy ... 44
LIST OF ABBREVIATIONS
FT-IR Fourier transform infrared FT-NIR Fourier transform near-infrared
IR infrared
mid-IR mid-infrared
MSW municipal solid waste
NIR near-infrared
NIRS near-infrared spectroscopy PAT process analytical technology PLS-R partial least squares regression RDF refuse-derived waste
MSC multiplicative scatter correction SNV standard normal variate
1
INTRODUCTION
The Paris Agreement adopted in December 2015 calls for the mitigation of greenhouse gas emissions in order to keep “global temperature rise this century well below 2 degrees Celsius above pre-industrial levels and to pursue efforts to limit the temperature increase even further to 1.5 degrees Celsius” (United Nations, 2017). The combustion of fossil fuels is a major source of greenhouse gas emissions, thus the global usage of fossil fuels needs to be drastically reduced to assist in fulfilling the aims of the Paris Agreement. Replacement fuel options are being investigated and developed by the scientific community; commercially viable options are adopted by companies. One such fossil fuel replacement is refuse-derived fuel (RDF) from municipal solid waste (MSW) for combined heat and power plants. It should be noted that RDF is not a complete replacement as it often includes components of fossil origin such as plastic, but the amount of carbon dioxide emissions per unit energy provided is lower by comparison and is thus an improvement (Obermoser et al., 2009).
1.1
Research Outline
The chemical and physical properties of MSW are subject to variation, due to its variety of household and commercial sources, and there is a risk of contamination with incombustible substances. One such substance that can cause problems with standard operation is glass. During the incineration of RDF in fluidized bed boilers, glass present in MSW can react with various other compounds in the fuel to form low melting point compounds; glass is also itself a low melting point compound. These compounds can cause agglomeration of the boiler sands and subsequent failure of the boiler due to bed defluidization.
The ability to detect the presence of glass contamination in fuels has the potential to improve operating conditions such as improved maintenance schedule for the sands in a fluidized bed combustion boiler or additives to reduce rate of agglomeration (Khan et al., 2009). A continuous, fast, cost-effective and reliable measurement process of the fuel is needed to fulfil the operational requirements of a commercially operating boiler.
The intent of this research project was to develop a predictive model for finding glass contaminants amongst a uniform background material based on multivariate analysis of near-infrared spectroscopy (NIRS) data. The detection material consisted of glass in varying amounts. The background materials used include materials that are likely to exist in municipal waste, biomass and food waste.
1.2 Aim and Objectives
The intent of this research was to develop a multivariate predictive model to detect the presence of glass contamination in waste-based fuel using NIRS. The following research questions were answered:
1. How can glass contamination in unique background materials be detected using NIRS? 2. How can this technique be applied to detecting glass in RDF for a fluidised bed boiler? This was accomplished through fulfilling the following objectives:
1. Capture NIR spectral data for samples of glass with various background materials. 2. Investigate appropriate options for pre-processing spectral data.
3. Develop a predictive model of contamination using multivariate analysis of the resulting NIR spectral data.
1.3 Contribution to Knowledge
The literature review in Section 2 found that glass is likely to produce different NIR spectra against many kinds of waste material. However, there is little existing research for the application of NIRS to the detection of contaminants in boiler fuel; thus, this is the primary focus of this study.
1.4
Delimitations
In this degree project, NIRS was used with the intention of detecting glass against different background materials; actual waste was not used in this research. Additionally, sensors for on-line testing were not developed nor were the developed models tested in on-on-line applications.
1.5
Structure
Section 1. Introduces the topic of study, including the aim, scope, contribution and necessity of the research.
Section 2. Covers key research of existing literature necessary for defining the gap in existing knowledge and investigates required scientific and technical knowledge. Section 3. Describes the methods used for gathering, pre-processing and analysing NIRS
data.
Section 4. Presents and discusses the results of the study, including examples of spectral data gathered and pre-processed, the resulting models and the accuracy thereof. Section 5. Presents the conclusions of this study.
2
LITERATURE REVIEW
Section 2.1 describes the problems associated with glass contamination in fluidised bed boiler fuel. Section 2.2 justifies the use of near-infrared spectroscopy when compared with other sensing technologies, while section 2.3 describes applications of near-infrared spectroscopy and identifies the gap in existing research. Section 2.4 reviews the properties of refuse-derived fuel that are relevant to this research project. Section 2.5 describes the pre-processing techniques available for analysing NIR spectral data.
2.1
Effects of Fuel Contamination
2.1.1 Fluidised Bed Combustion Boiler Operation
Fluidised bed combustion boilers are suitable for the incineration of various solid, liquid and gaseous fuels and are a well-understood technology. They have many advantages such as simple construction, flexibility in the fuel selection, high combustion efficiency and low environmental impacts; coal, biomass, waste and RDF are some of the fuels that can be used. Fluidised bed boilers typically operate at low combustion temperatures, 750°C to 950°C, this minimises the production of NOx compounds during combustion. (Khan et al., 2009; Kovacs, 2001)
2.1.2 Agglomeration in Fluidised Bed Boilers
There can be various operational and environmental issues in fluidised bed boilers due to the presence of various non-combustible substances in RDF. Agglomeration is one such problem that has been investigated for many years. Silica bed material can react with various elements in the fuel to form low-melting compounds and low-melting mixtures of compounds that have a lower melting point than that of any of the individual constituents (Khan et al., 2009). Soda-lime glass is also a low-melting compound, with a glass transition temperature lower than the boiler combustion temperature; the presence of soda-lime glass in RDF is therefore undesirable. Glassy compounds, both in the fuel and formed during combustion, can adhere to the bed sands and form agglomerates. This in turn leads to defluidization of the bed requiring replacement of the bed material, and clogging problems during extraction of ash and sand, which in extreme cases can require unscheduled shutdowns of the plant (Kovacs, 2003).
2.2
Near-Infrared Spectroscopy for Process Monitoring
Process analytical technology (PAT) is mainly used for on-line, in-line or at-line applications of continuous process monitoring. Real time information helps to reduce production costs, to optimise processes and to monitor process status. Spectroscopy, chromatography and other multi-signal sensors are typically used for these PAT applications. (Ihunegbo et al., 2012)
Various sensors and actuators have been used for on-line process monitoring in different applications. Self-powered biosensors have been used for online water quality monitoring (Pasternak et al., 2017) and sensors based on capacitive, inductive, acoustic, and optical methods were used for online measurements of oil properties including sulphur content, corrosion and viscosity (Zhu et al., 2017). NIR spectroscopy has been widely used for on-line monitoring of solids in biogas production, but acoustic chemometrics has also been investigated for predicting total solids in bioslurry and has been utilized for on-line biogas process monitoring with the intent of avoiding the construction of optical apertures in the process line (Ihunegbo et al., 2012). NIR spectroscopy has been successfully utilized for the detection of glass and on-line process monitoring (Skvaril et al., 2015) but there is little other research into this application, thus NIR spectroscopy was chosen as the PAT tool for this work.
2.3 Near-Infrared Spectroscopy and its Applications
In the early 1800s, Herschel discovered light in the infrared (IR) region; however, the potential applications of IR were not investigated in depth until the 1940s. The NIR region of the electromagnetic spectrum as an academic field of interest started gaining popularity during the 1950s, where it was utilized in smaller application domains. However, the real breakthrough came in early 1960s, when Karl Norris used NIRS in agricultural applications. Since then, the advancements in electronic and optical fields, along with evolution of powerful computers to process spectra, allowed for NIR to be applied to a wide range of industries, analysing both liquid and solid materials (Blanco and Villarroya, 2002).
The electromagnetic spectrums of the near- and mid-infrared (mid-IR) regions lie between 750-2500 nm and 2500–25000 nm respectively (Chadwick et al., 2014). Vibrations of covalent chemical bonds in the sample absorb wavelengths in the mid-IR region; combinations and overtones of the chemical bond vibrations absorb wavelengths in the NIR region. Different bonds absorb different wavelengths; this allows characterisation of sample composition based on reflected light captured by a sensor. NIRS has some advantages over mid-IR which allow for minimal sample preparation and higher moisture content of samples (Wilks, 2006). NIR and mid-IR spectroscopy are techniques that are widely accepted and extensively used in many industrial sectors for rapid material characterisation, process control, quality and monitoring. These sectors include pharmaceuticals, agriculture, pulp and paper, food science, animal feed science, polymer science, textiles, environmental and waste management, petrochemicals, clinical science and biochemical energy production (Blanco and Villarroya, 2002; Skvaril et al., 2017). NIR and mid-IR spectroscopy are also used for quantitative and qualitative evaluation of materials and various processes. The non-destructive nature of the analysis has made the techniques popular among many industries (Jamrógiewicz, 2012). The following sub-sections describe some of the existing applications of NIR techniques. These examples show the versatility and range of industrial applications for NIRS.
2.3.1 Agriculture and Soil Properties
Visible-NIR techniques can be used in the agriculture sector to determine the soil properties in a rapid and cost effective way. Morellos et al. (2016) used visible-NIR to estimate the total nitrogen, organic carbon, and moisture content in the soil. NIRS is also widely used on agricultural products to predict their biochemical properties for energy production. NIRS has been used to find the cellulose, hemicellulose, and lignin contents in rice straw (Huang et al., 2010). One study investigated the utilization of NIR reflectance spectroscopy to predict the chemical composition of maize plants. Properties such as dry matter, crude protein, acid detergent fibre, neutral detergent fibre, in vitro organic matter digestibility and ash were predicted using modified partial least squares regression models (Cozzolino et al., 2001).
2.3.2 Food Science and Food Processing
Food researchers have used NIR analysis for food quality and safety evaluation. NIR techniques are used to find the adulteration of beverages in the beverage industry and in the determination of quality of milk and dairy products in diary sector. NIRS has also been used to predict the constituents in food products (Cen and He, 2007). Gowen and O’Donnell (2013) conducted a study on the detection of foreign bodies among grains; NIR hyperspectral imaging was used to find plastic, glass and rubber foreign bodies among the grain samples. The results obtained were good for plastic and rubber detection but were less reliable for glass.
2.3.3 Animal Feed Science
In animal feed science, NIR techniques were implemented to determine the quality of cattle feeds (de Boever et al., 1995). The chemical composition and the energy value of compound feeds for cattle were studied using NIRS and the moisture content, dry matter basis for crude protein, fibre and fat could be successfully predicted.
2.3.4 Pulp and Paper
In recent years, NIRS has been widely used in the pulp and paper industry. Poke and Raymond (2006) used NIRS with partial least squares regression (PLS-R) for the prediction of extractives and lignin content in Eucalyptus globulus. The authors developed a model that could predict extractive content, Klason lignin content, and total lignin content with reasonable accuracy and moderate correlation. Brink et al. (2010) used an on-line fibre-based NIR spectrometric analyser for the quantitative predication of aspen fibre and birch bark content in unbleached hardwood pulp. Principal component analysis and PLS-R were used to process the NIR spectra data; the resulting model has potential applications for on-line process analysis in paperboard manufacturing. Antti et al. (2000) used NIRS with multivariate calibration for the detection of kappa number distributions in kraft pulps.
2.3.5 Waste Management
One of the potential applications of NIRS is in waste management. As waste composition is heterogeneous in nature, the detection of its molecular structure is difficult. Smidt et al. (2011) studied the applications of Fourier transform infrared (FT-IR) spectroscopy in waste management. The chemical structure of various elements in waste were explained and the possibilities and difficulties in the interpretation of generated spectra were discussed. The potential advantages of long-path FT-IR spectroscopy in monitoring the large landfills were also discussed.
On-line material analysis with NIR hyperspectra cameras is a developing technology which has been used in the analysis of plastics and other recyclables (LLA Instruments GmbH, n.d.). Bonifazi and Serranti (2006) studied the ceramic glass contaminants in glass recycling and how NIR imaging spectroscopy could be utilized for the detection of glass pollutants. A variety of experiments were carried out on glass and ceramic glass with different shapes, colours, sizes and composition; results showed that detection of selected wavelength ratios was possible.
2.3.6 Thermochemical Energy Conversion Processes
NIR techniques have been utilised for the rapid material characterisation and monitoring in thermochemical energy conversion process such as related to torrefaction, pyrolysis, and gasification (Skvaril et al., 2017). Lestander et al. (2014) used NIRS coupled with multivariate calibration models to predict various properties of biomass; energy and ash content, volatile matter, fixed carbon, and atomic ratios of hydrogen to carbon and of oxygen to carbon. This data is useful when performing torrefaction, pyrolysis or gasification treatments. The study could also effectively predict the properties of torrefied biomass, biochar and the solid residue after gasification.
A detailed review of infrared techniques for the qualitative evaluation of biomass and biofuel was carried out by Chadwick et al. (2014). The applications of infrared spectroscopy in predicting the biomass and biofuel characteristics in various energy production methods such as combustion, torrefaction, pyrolysis, gasification and anaerobic digestion were summarised by reviewing research in the field of study.
2.3.7 Heat and Power Production
There has been a large amount of research in to the applications of NIRS for the rapid characterisation of woody biomass, which is often used as a fuel for heat and power production. Lestander and Rhén (2005) studied the energy of various covalent bonds between carbon, sulphur, hydrogen and oxygen. A multivariate model was developed for the prediction of the calorific value, moisture content and ash content using 16 samples of Norway spruce using NIRS in combination with bi-orthogonal PLS-R models.
Skvaril et al. (2016) performed experiments to study biofuel properties such as moisture content, ash content and higher heating value of different biofuel sample mixtures with stem wood chips, forest residue chips, bark, sawdust, and peat. Fourier transform NIR spectroscopy
(FT-NIRS) coupled with PLS-R was used to predict the biofuel properties. Multiplicative scatter correction was used for the spectra data pre-processing. This multivariate prediction model has the potential to be used for accurate control of thermochemical energy processes.
2.3.8 Bio-Crops
NIRS has been used to determine the properties of various bio-crops. The gross calorific values of miscanthus and two short rotational coppice willows were predicted by (Everard et al., 2012) using visible and NIR spectroscopy in the range of 400-1100 nm and 880-1680 nm. PLS-R applied to these spectra ranges could predict gross calorific value with a coefficient of determination greater than 0.96. The potential for using NIRS in optimizing the biomass-to-energy process by evaluating characteristics of biomass was demonstrated.
2.3.9 Contaminant Detection in Fuels
A recently considered application of NIRS is in the detection of contaminants like glass in boiler fuels, which has been briefly studied by Skvaril et al. (2015). The utilisation potential of NIRS in quantitative detection of soda-lime glass in biomass-based fuel was investigated. Various pre-treatment methods were applied to the data to obtain reliable results from the spectra data. The correlations between spectra data and glass content were studied using principal component analysis. The prediction models were developed using principal component regression. However, the application of detecting contaminants in boiler fuels using NIRS is a field of research that has not yet been investigated in detail; hence, this was chosen as the focus of this degree project.
2.3.10 Summary of Near-Infrared Spectroscopy Applications
The existing research studied here show the versatility and range of industrial applications for NIRS in on-line measurements for process control and monitoring. The features of NIR techniques like non-destructiveness, non-invasiveness, cost effectiveness and rapid response time contribute to the wide variety of applications. There is little existing research for contaminant detection in fuels when compared to other applications; thus, intent of this work is to apply NIRS to the detection of contaminants in boiler fuel, specifically glass.
2.4
Properties of Refuse-Derived Fuel
RDF is combustion fuel from MSW, which has been processed to remove unwanted components. MSW is sorted with a number of processes, removing most of the metal, plastics and glass; however these processes have inefficiencies, so small amounts of these components can contaminate the final RDF product (Rogoff and Williams, 2012).
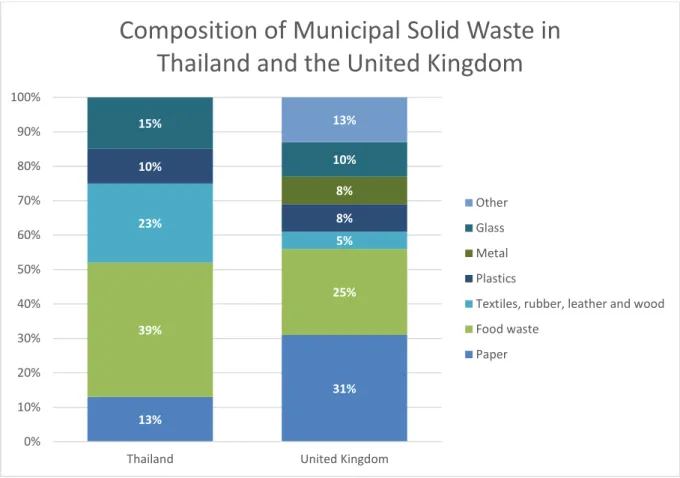
Patumsawad and Cliffe (2002) found that over 50% by weight of MSW in both Thailand and the United Kingdom consists of paper and food waste; a full breakdown of the components in
MSW is shown in Figure 1 following. Similar data was not available for Swedish waste. Once the MSW is converted to RDF, paper and food waste are the largest components by a significant fraction, with some textiles, rubber, leather and wood also remaining. Due to the biological hazards of using MSW or RDF in testing, food waste and paper were chosen as the main background materials to investigate in this study.
Figure 1. Fractional Composition of Municipal Solid Waste as per data from Patumsawad and Cliffe (2002)
2.4.1 Chemistry of Food
There are four main types of molecules present in food: water, lipids, carbohydrates, and proteins. The chemical bonds present in each food will absorb different wavelengths of NIR light, it is important to test the different foods to ensure that the model is capable of handling input data from different types of waste.
Water consists primarily of O-H bonds; the peaks in NIR absorption spectra are distinctive. Fats and oils are a type of lipid called triglycerides, and are the most common type of lipid in foods. Triglycerides consist of a glycerol molecule bonded to three fatty acid molecules, which are long chains of hydrocarbons. The main bonds present are C-C and C-H, although unsaturated triglycerides also contain C=C. Carbohydrates consist of carbon, hydrogen and oxygen, usually with a 2:1 ratio between the hydrogen and oxygens. The most important carbohydrate in food is starch, a polysaccharide; the main bonds present include the single bonds in triglycerides, with the addition of C-O and O-H, with some C=O. Proteins contain carbon, hydrogen, oxygen and nitrogen; the main bonds present include those in starch, with
13% 31% 39% 25% 23% 5% 10% 8% 8% 15% 10% 13% 0% 10% 20% 30% 40% 50% 60% 70% 80% 90% 100%
Thailand United Kingdom
Composition of Municipal Solid Waste in
Thailand and the United Kingdom
Other Glass Metal Plastics
Textiles, rubber, leather and wood Food waste
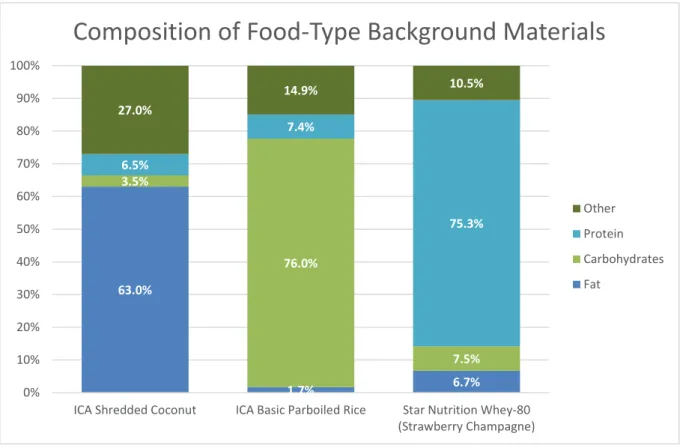
Previous work has shown that NIRS is appropriate for determining the composition of bran wheat with respect to carbohydrates, ash content, fat and water, while mid-IR spectroscopy is better for protein (Hell et al., 2016); it was inferred that NIRS should also be appropriate for finding glass contamination against a background of these types of molecules. Three types of food were selected as background materials, each representing a food group: rice consisting of 76% carbohydrate, shredded coconut containing 63% fat, and whey powder containing 75% protein.
2.4.2 Chemistry of Paper
Paper consists primarily of cellulose, a polymeric saccharide, which is usually derived from wood. It differs from wood in that it lacks lignin and hemicellulose, which is removed during the pulping process. A large volume of wood shavings was already available for test purposes, so this was used instead of paper to save time in the project. Cellulose, hemicellulose and lignin are all polysaccharides, thus the chemical bonds present are similar to those present in starch; C-C, C-H, C-O, O-H and C=O. NIRS has been used extensively in the pulp and paper industry, as described in Section 2.3.4.
2.4.3 Chemistry of Glass
Glass production involves three rudimentary ingredients: formers, fluxes and stabilizers. Formers are the ingredients that provide the largest percentage of mass to the final product; the most common former is silica (SiO2). Fluxes are added to lower the melting point of the
former and decrease the amount of energy required for manufacture; common fluxes are soda (Na2O), potash (K2O) and lithia (Li2O). Stabilizers are required to make glass stronger and
improve durability; the most commonly used stabilizer is lime (CaO) (Kolb, n.d.). Glass can be coloured by adding certain oxides during manufacture. The addition of iron oxides give glass green and brown colours; carbon oxides and sulphur oxides result in amber and brown colours (Helmenstine, 2017).
The most prevalent type of glass is soda-lime glass; it is relatively inexpensive to manufacture, chemically stable and reasonably hard, but has poor thermal and thermal shock resistance (Editors of Encyclopaedia Britannica, 2008). The chemical composition of soda-lime glass is usually 70% - 74% SiO2, 12% - 16% Na2O, 5 – 11% CaO and less than 5% of other metal oxides
(British Glass, n.d.). Soda-lime glass is commonly used for food and beverage containers, and windows; thus, it is likely to appear in municipal solid waste, construction waste and demolition waste. The majority of chemical bonds present in glass are ionic bonds, which cannot be detected by NIRS. It was thus inferred that the presence of glass is detected through impurities containing covalent bonds. Gowen and O’Donnell (2013) and Skvaril et al. (2015) have each had some success with using NIRS to detect glass contamination.
2.5
Chemometrics
Chemometrics is a mathematical and statistical tool for analysing different physical and chemical information in NIR spectra with noise and overlapping bands. The useful chemical details on NIR spectra can be extracted using various chemometric tools (Skvaril et al., 2017); chemometrics is mainly used for multivariate data analysis. Kumar et al. (2014) reviewed different chemometric tools used in analytical chemistry and categorised into multivariate regression and multivariate calibration methods.
Raw NIR spectra have baseline shifts and non-linearities due to light scatter effects. Various spectral data pre-processing techniques have been used to minimize these effects and improve the quality of the spectra and thereby to enhance the performance of predictive models. Pre-processing methods are classified into two categories, namely scatter correction and spectral derivatives. Multiplicative scatter correction and its extensions, standard normal variate (SNV), orthogonal signal correction, normalization, and de-trending are the main scatter-correction pre-processing techniques. Spectral derivate methods include Savitzky-Golay (S-G) polynomial derivative filters and Norris-Williams transforms. Derivative methods have been found to be better for eliminating additive and multiplicative effects in spectral data. (Rinnan et al., 2009). Multivariate analysis methods such as PLS-R and principal component regression can be applied to the resulting data to develop predictive models for finding the material properties (Skvaril et al., 2016).
3
METHODOLOGY
The testing and modelling process can be described by the following steps; these are detailed further in the following sub-sections:
Samples of background material and glass were prepared NIR “spectral snapshots” of moving samples were captured
Pre-processing chemometric techniques were applied to the NIR absorption spectra Outlier samples were investigated and discarded
Certain regions of the NIR absorption spectra were defined as predictors The known amount of glass in each sample was defined as a response
The model was calibrated using the relevant data and validated using a full cross-validation due to the limited number of samples captured.
3.1 Sample Preparation
Each sample of background material was imaged with a control sample containing no glass, and then glass was incrementally added to have increasing glass fractions. The mixed samples of background material and glass were shaken through multiple axes before placement in the test tray in order to replicate random distribution of glass particles within waste material. According to the Beer-Lambert Law, the absorbance of a material is proportional to the thickness of the sample and the concentrations of absorbent components in the material. Thus, the key dimension in sample analysis is length rather than mass; it follows that the fraction of glass present in each test sample was defined by volume percent rather than weight percent. Four main types of background materials were chosen for investigation: wood shavings, shredded coconut, rice, and whey powder. These represent the major components in MSW, i.e. paper and food waste. Wood shavings were chosen as a substitute for paper, due to the similarity in chemical composition and the availability of wood shavings. The wood shavings used were approximately 0.5mm thick, with some pieces up to 30 mm x 30 mm but most pieces less than 10 mm in each dimension. Each of the three food types tested is dominated by one of the major food groups. The shredded coconut with a high fat content had particle sizes of up to 2 mm x 2 mm in cross-section, and up to 10 mm in length, although pieces less than 1 mm in all dimensions also occurred. The rice had a high carbohydrate content, and individual grains had a diameter of approximately 1.5 mm and length usually between 6-8 mm. The high protein whey powder consisted of grains less than 0.5 mm in all dimensions. Figure 2 following shows the chemical composition of each food type as per the given nutritional information. Two types of soda-lime glass were used for testing, clear glass and coloured glass; the coloured glass cullet was a mix of green, amber and brown glasses. The size of the pieces of glass cullet was limited using mesh sieves. Each particle needed two dimensions greater than 4 mm and two dimensions less than 16 mm, although particles could be less than 4 mm in one dimension and greater than 16 in another. The lower limit was introduced to avoid injury from fine glass shards and glass dust; the upper limit was to prevent the particle size of the glass from dimensionally dominating that of the background materials.
Figure 2. Chemical Composition of Food Types as stated on each food’s packaging
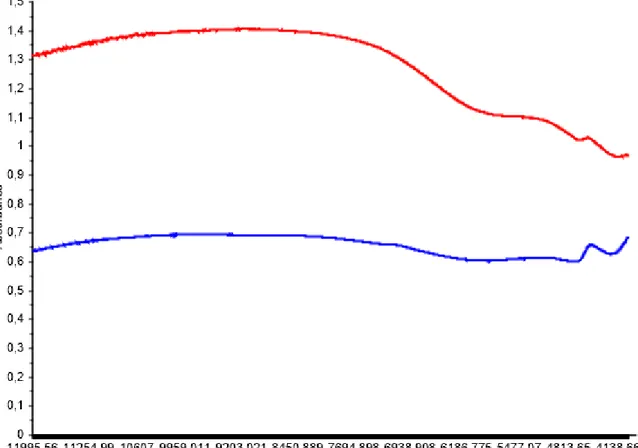
It was necessary to find the required depth of the samples in the tray to avoid absorption of incident light by the tray, which would interfere with the spectral results. The required depth of each type was determined in the following manner. First, an NIR absorbance plot of a plastic tray was captured. Then an NIR absorbance plot of a thin layer of sample material was captured. The thickness of the sample material in the plastic tray was gradually increased, capturing several NIR absorbance plots, until sharp peaks in the absorbance plot of the plastic were no longer visible and the sample material dominated the absorbance spectra. Figure 3 following shows an example of how the depth of each sample was measured; the NIR spectra observed for each sample type are shown in Appendix A.
Figure 3. Measuring Required Sample Depth
63.0% 1.7% 6.7% 3.5% 76.0% 7.5% 6.5% 7.4% 75.3% 27.0% 14.9% 10.5% 0% 10% 20% 30% 40% 50% 60% 70% 80% 90% 100%
ICA Shredded Coconut ICA Basic Parboiled Rice Star Nutrition Whey-80 (Strawberry Champagne)
Composition of Food-Type Background Materials
Other Protein Carbohydrates Fat
Table 1 below shows the required depth for each sample to avoid absorption or reflectance interference from the test tray. It was decided that a minimum depth of 20 mm should be used for testing, corresponding to a minimum test volume of 1500 cc as calculated using the known size of the test tray, even for background materials with a small minimum depth. This was to make measuring volumes of glass easier, and to ensure that the test tray was not captured by the spectrometer when testing samples with a high volume percent of glass. Figure 4 following shows examples of each of the four background materials tested, each bag contains 1500 cc of background material with about 4-5% clear glass by volume.
Table 1. Minimum Required Depth of Each Sample Type
Sample Minimum Depth
Coloured Glass Cullet 6-10 mm Clear Glass Cullet 30-40 mm Wood Shavings 6-10 mm
Rice 2-5 mm
Shredded Coconut 1-2 mm Whey Powder <1 mm
Figure 4. Background Material Samples (clockwise from top left: wood shavings, shredded coconut, whey powder, rice grains)
Table 2 following shows the full range of tested samples with clear and coloured glass cullet in four different background materials. Several samples of wood shavings were prepared with nominally identical volume fractions at each increment of added glass in order to find the level of repeatability, while only one of each of the food samples with each glass type was prepared. The NIR spectra for each sample was captured only once, although the average of 32 scans is taken every test as described further in Section 3.2.
Table 2. Composition of Tested Samples (suffixes A-F denote coloured glass; suffixes V-Z denote clear glass)
Sample Percentage of Glass by Volume
Wood A 0.00% 0.05% 0.11% 0.21% 0.42% 0.88% 1.74% 2.76% 3.86% 4.76% Wood B 0.00% 0.05% 0.11% 0.21% 0.42% 0.88% 1.73% 2.77% 3.84% 4.69% Wood C 0.00% 0.05% 0.11% 0.21% 0.42% 0.88% 1.73% 2.75% 3.79% 4.65% Wood D 0.00% 0.05% 0.11% 0.21% 0.42% 0.88% 1.73% 2.74% 3.76% 4.62% Wood E 0.00% 0.05% 0.11% 0.21% 0.42% 0.88% 1.75% 2.78% 3.83% 4.70% Wood F 0.00% - - 0.23% 0.50% 1.07% 2.10% - 3.82% - Wood V 0.00% - - 0.23% 0.50% 0.99% 2.04% 2.99% - 4.77% Wood W 0.00% - - 0.25% 0.51% 1.04% 2.09% 3.07% - 4.87% Wood X 0.00% - - 0.24% 0.50% 1.00% 2.04% 3.02% - 4.78% Wood Y 0.00% - - 0.25% 0.52% 1.02% 2.04% 3.02% - 4.63% Wood Z 0.00% - - 0.24% 0.50% 1.06% 2.12% 3.14% - 4.85% Coconut A 0.00% - - 0.25% 0.54% 1.06% 1.99% - 3.72% - Coconut Z 0.00% - - 0.24% 0.50% 1.00% 2.06% 3.03% 4.08% - Rice A 0.00% - - 0.25% 0.54% 1.09% 2.11% - 3.95% - Rice Z 0.00% - - 0.24% 0.50% 1.01% 2.05% 3.02% 4.07% - Whey A 0.00% - - 0.23% 0.48% 1.01% 2.00% 2.86% 3.91% - Whey Z 0.00% - - 0.23% 0.48% 0.95% 2.17% 3.18% 4.27% -
The volume fraction of glass in each sample shown in Table 2 was calculated as following:
𝑉𝑜𝑙% 𝐺𝑙𝑎𝑠𝑠 =
𝑚𝑔𝑙𝑎𝑠𝑠
𝜌𝑔𝑙𝑎𝑠𝑠
𝑚𝑔𝑙𝑎𝑠𝑠
𝜌𝑔𝑙𝑎𝑠𝑠 + 𝑉𝑏𝑎𝑐𝑘𝑔𝑟𝑜𝑢𝑛𝑑
Where: 𝑉𝑏𝑎𝑐𝑘𝑔𝑟𝑜𝑢𝑛𝑑 is the volume of background material in each sample
𝑚𝑔𝑙𝑎𝑠𝑠 is the mass of glass cullet in each sample
𝜌𝑔𝑙𝑎𝑠𝑠 is the density of glass cullet as calculated by measuring the mass of a
large sample of glass cullet and the volumetric displacement of water for that sample The relevant measured data for each sample is available in Appendix B. The uncertainty of the volume fraction measurements is approximately 5% of each fraction, with the largest contribution due to the uncertainty in the glass cullet density measurement. Figure 5 following
shows 1500 cc of rice grains with 3.95% coloured glass cullet in the test tray to show the amount of glass observable in visible light. The doughnut-shaped area of sample placement was used to minimise the amount of material required, as the region captured by the NIR sensor describes an arc near the outer edge of the tray.
Figure 5. Rice and Coloured Glass Cullet in Test Tray
3.2 NIR Spectra Acquisition
NIR spectra data was acquired using a Fourier transform-NIR (FT-NIR) spectrometer with an illumination head. This was connected to a computer running OPUS 7.5 software; the input parameters used in the software for data capture are available in Appendix C. Before each set of samples were tested, a background scan was captured of a white Teflon control piece, shown in Figure 6 below. The samples were tested in a circular metal tray rotating at a speed corresponding to a linear velocity at the diameter of the imaged circumference of 0.93 ms-1
with a standard deviation of 0.13 ms-1; this was in order to replicate the actual movement of
boiler fuel in conveyor belt. The velocity of each sample during scanning is available in Appendix B.
Figure 7 following shows the equipment set-up while capturing NIR spectra. The distance between the top surface of the sample and the sensor head was maintained at 17±2 cm, corresponding to the 170 mm focal length of the sensor. NIR absorbance spectra were captured between the wavenumbers of 4000 cm-1 and 12000 cm-1, with a resolution 8 cm-1 and 32 scans
for each sample. The ambient room temperature during testing was 21±1 ◦C.
Figure 7. NIR Spectra Capture of Rotating Sample of Wood Shavings
3.3 NIR Spectral Signal Pre-Processing
The NIR spectra recorded as relative absorbance via the contactless sensor head had baseline shift, additive effects, and multiplicative effects; these are due to a number of factors including light scatter and particle size. Thus, it was necessary to apply spectral pre-processing techniques before analysis. Several pre-processing techniques were investigated for application to the NIR spectra, namely: S-G smoothing, S-G derivatives, MSC and SNV transforms. These are widely used pre-processing methods to eliminate additive and multiplicative effects in spectral data (Rinnan et al., 2009). The most suitable pre-processing techniques were then used for multivariate analysis and model development. All the pre-processing was done in Unscrambler® V10.3.
3.4 Multivariate Analysis
Two sets of models were developed in this degree project, these were pre-processed and analysed separately. One set of three models analysed data from all four background materials; the other set of three models analysed samples of glass with wood shavings as the background material. In each set of models, one model quantified clear glass content, one quantified coloured glass content, and one used data from the clear glass samples and the coloured glass samples to quantify the total content of both types of glass. This was to compare the accuracy of the multiple and single background material models, and the different types of glass. Wood shavings were chosen as the single background material to analyse as there was more of the raw material available, yielding more samples for analysis.
PLS-R was used to develop regression models for quantitative prediction. This method was chosen because is commonly used in chemometrics than principal component regression, and there is usually not much difference in prediction error between the two methods (Dumancas et al., 2015). PLS-R finds the relationship between independent X variables and dependent Y samples, in this work the NIR absorbance values and the glass content respectively. Two kinds of algorithm were used to analyse the data; a wide-kernel PLS-R algorithm was utilized to analyse the full range of spectra used for the models involving all types of background material, while a NIPALS algorithm was used for the models of glass in wood shavings with a smaller range of variables in the NIR spectra. All of the samples and variables were weighted equally in the initial analyses.
The small number of glass content samples warranted the use of a full cross-validation, and the samples were sufficiently independent to not require segmentation. A full cross-validation is used to individually compare each of the calibration samples with calibrated sub-models when the total number of samples is insufficient to remove some for independent validation. Cross-validation is considered a reliable method to confirm the predictive performance of calibration model (Wold et al., 2001). Martens’ Uncertainty Test, built into the Unscrambler software, was included in the cross-validation to allow for easy identification of the significant variables in the model.
The accuracy of each of the developed PLS-R models was evaluated using the slope, offset and coefficient of determination of the parity plots for the calibrated and validated models.
4
RESULTS AND DISCUSSION
Spectra of the glass cullet used were captured with no background material, examples of these spectra are shown in Figure 8 below. The key features of the spectra include the high absorption in the region of 12000 cm-1 to around 6500 cm-1 and the peak around 4500 cm-1.
Figure 8. Examples of Absorption Spectra Clear and Coloured Glass Cullet
The results of the spectral pre-processing and multivariate analysis of the samples is described in the following sub-sections. An initial analysis was attempted encompassing all of the background materials, but the resulting models were found to be less accurate than desired, as described in Section 4.1. Section 4.2 describes the efforts in modelling clear and coloured glass cullet content in wood shavings alone in an attempt to improve upon the model of glass against different background materials. Section 4.3 investigates comparative modelling between clear and coloured glass. Section 4.4 summarises the resulting models from the previous sections and discusses differences in model accuracy.
4.1
Multivariate Analysis Including All Background Materials
The first analysis performed involved using all 128 samples of the acquired NIR spectral data across all of the used background materials to try to develop a robust model that could be applied to detect glass amongst any of these individual background materials.
4.1.1 Near-Infrared Spectra of Samples
Figure 9 below shows all of the collected spectra for the glass detection analysis involving all background materials. Visual inspection of the NIR spectra indicated that the sensor might have been overloaded in higher wavenumbers for coconut and rice; Figure 10 following shows the same spectral data with the overloaded sensor data removed. There are clear differences between the different types of background materials; a supplementary analysis was performed on multiple different foods to investigate whether the proportions of the three key food molecules could be predicted using NIRS. The results of this incidental analysis are available in Appendix D.
Figure 10. Near-Infrared Spectral Data without Overloaded Region
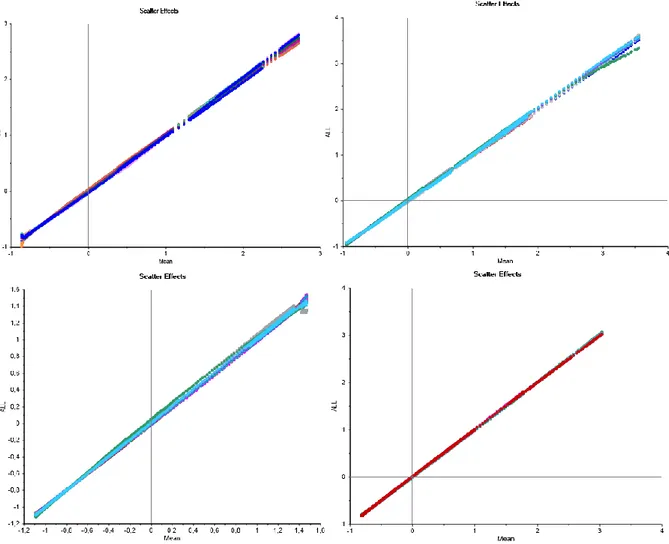
Figure 11 below shows the data scatter, which is how much each data point varies from the mean of the spectral data selection; this relates to the statistical distribution and noise in the data. The swirls and loops in the scatter plot indicate differences in chemistry between each background material. In order to more easily interpret the plot, the scatter effects of each background material was inspected individually, as shown in Figure 12 following.
Figure 12. Effects of Data Scatter in each Background Material (clockwise from top left: wood shavings, shredded coconut, whey powder, rice grains)
The two apparent datasets for shredded coconut were collected on two different days. The datasets for wood shavings were collected over several days, but did not display the same range of measurements as the coconut. The rice data collected had the largest amount of variation, while the measurements for whey powder had very little variation. The stacking of the datasets apparent in the wood shavings and shredded coconut scatter effects plot is indicative of additive effects in the spectral data. The fanning visible in all datasets, to a greater or lesser extent, is indicative of multiplicative effects. The pre-processing techniques investigated were chosen on the basis of which effects would be removed.
4.1.2 Application of Pre-processing to Raw Spectral Data
A first derivative S-G transformation was applied to the data to remove the additive effects; while it was apparent that the S-G transform removed stacking effects from the data scatter, it was also evident that further or different pre-processing techniques were required. Figures of the pre-processed data and the resulting data scatter are available in Appendix E.
An SNV transformation was applied to the original data in order to remove the multiplicative effects observed; the resulting pre-processed spectra are shown in Figure 13 below. Figure 14 following shows the significant improvement to the scatter effects for each individual background material. Figure 15 shows observable improvements to the scatter effects across all background materials. Thus, the SNV transformed data without the oversaturated wavenumbers was chosen for the first attempt at developing a predictive model of glass content.
Multiplicative scatter correction was also investigated, but there was no significant difference between the results of these two pre-processing techniques. This is consistent with the findings of Dhanoa et al. (1994).
Figure 14. Effects of Data Scatter in each Background Material after Standard Normal Variate Transform (clockwise from top left: wood shavings, shredded coconut, whey powder, rice grains)
4.1.3 First Iteration Predictive Model of Pre-Processed Spectral Data
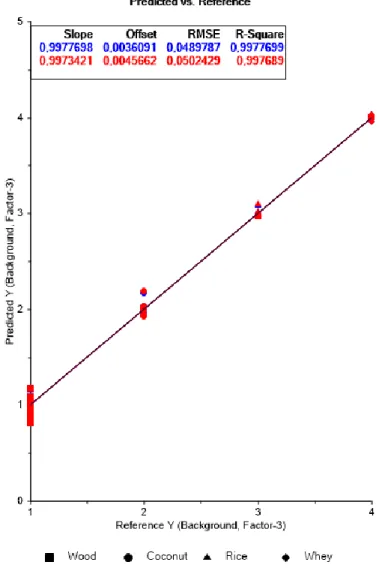
The first iteration of modelling with wide-kernel PLS-R yielded a very poor prediction of glass content, however only three factors were required to give reasonable prediction of background material type, as shown in Figure 16 below. The explained variance is shown in Figure 17 following, and it is apparent that six factors were necessary to capture the most relevant information for modelling glass content; the corresponding parity plot for the glass content is also shown.
The blue line in the explained variance plots shows how much variation is explained by the calibrated model; the red line shows how well the variation is explained in the validated model. Similarly, in the parity plots, the blue data is for the calibrated model and the red data is for the validated model. The lines show the respective lines of best fit, and the black line is the target for parity between prediction and reference.
Figure 17. First Model Iteration Explained Variance (left); Parity Plot for Glass Content Prediction (right)
The influence plot in Figure 18 was inspected to find which samples were possible outliers or gave high influence; three samples were marked for further investigation, these are also marked in Figure 17. Inspection of the original spectra in Figure 19 supports the conclusion that the selected samples are outliers.
Figure 19. First Model Iteration Outlier Identification in Raw Spectra
4.1.4 Second Iteration Predictive Model with Removal of Outliers
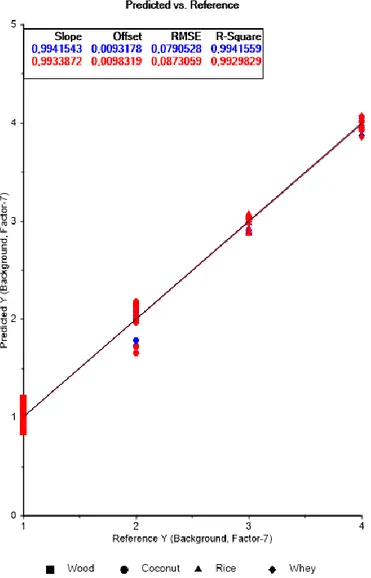
The second iteration of model development involved an analysis with the identified outliers removed. The resulting explained variance plot is shown in Figure 20 below; it was again decided that six factors was the best number for further investigation; the corresponding parity plot for glass content prediction is also shown.
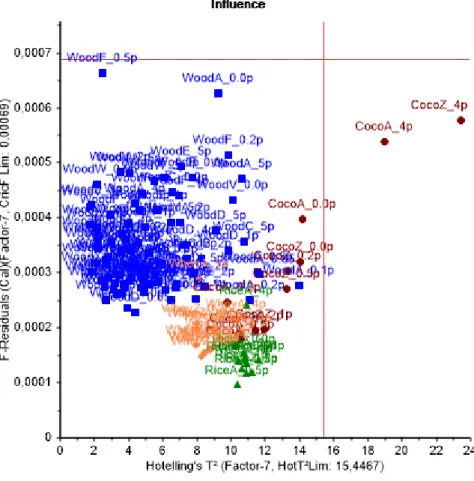
The influence plot in Figure 21 below was inspected for further outliers, the sample RiceZ_4p was identified as a low-risk outlier and retained in the model.
Figure 21. Second Model Iteration Influence Plot
Figure 22 below shows the regression coefficients in the model. The uncertainty test yielded the following important variables marked in black. It was observed that the important variables are higher wavenumbers and that the effects of noise are apparent in the regression coefficients, so 11-point S-G smoothing was applied to the SNV transformed data matrix.
4.1.5 Third Iteration Predictive Model with Data Smoothing
Applying the S-G smoothing to the data yielded a similar explained variance, parity plot and influence plot, although the residual of sample RiceZ_4p improved and it moved out of the outlier region of the plot. The number of smoothing points was varied and models built to check the suitability of 11 points. The plot of regression coefficients, Figure 23 below, showed improved data quality in the region of higher wavenumbers; the uncertainty test marked in black certain wavenumbers as important. When these wavenumbers were compared with the glass cullet absorption spectra in Figure 8, they were noted to correspond to the broad absorption peak between 10000 cm-1 and 9000 cm-1. It was decided that the model should be
limited to the wavenumbers in the range 10151 cm-1 to 8405 cm-1, shown as marked in black in
Figure 24 following. Modelling with the region of marked low wavenumbers was unsuccessful.
Figure 23. Third Model Iteration Regression Coefficients
4.1.6 Fourth Iteration Predictive Model using Limited Range of NIR Spectra
With the unmarked wavenumbers in Figure 24 down-weighted, the data was analysed again, resulting in the explained variance in Figure 25 below. Seven factors were identified as important for reasonable predictions of glass content; the parity plot is also shown in Figure 25. Inspection of the parity plot shows that glass content predictions for the non-wood background material samples deviate further from the reference than the wood-based samples. Multivariate analysis of only the wood-based samples is investigated further in Sections 4.2 to see whether prediction is more accurate for a single background material.
The limited range of the wavenumbers utilized for this iteration of the prediction model resulted in more factors required for prediction of the background material, but the model is still quite successful, as shown in Figure 26 following.
Figure 26. Fourth Model Iteration Parity Plot for Background Material Prediction
The influence plot in Figure 27 following shows no outliers, and higher influence from all of the food-type background material samples than the wood samples. This was as expected given the larger number of the wood-based samples. The previously identified outliers were still excluded as the accuracy of the model decreased when these were included in a test model. The final selection of regression coefficients is shown in Figure 28 following. Noise in the data is believed to contribute to the rapidly changing values for regression coefficients, but the general trend between positive and negative regression coefficients is apparent.
Figure 27. Fourth Model Iteration Influence Plot
Figure 29 following shows a plot of the pre-processed spectra in the region of the wavenumbers identified for modelling. The darker colours represent lower glass content, and the lighter colours are higher glass content; it is apparent that the effects of the different background materials are still highly dominant in this range.
Figure 29. Modelled Wavenumber Range of Pre-Processed Spectra with Known Glass Content
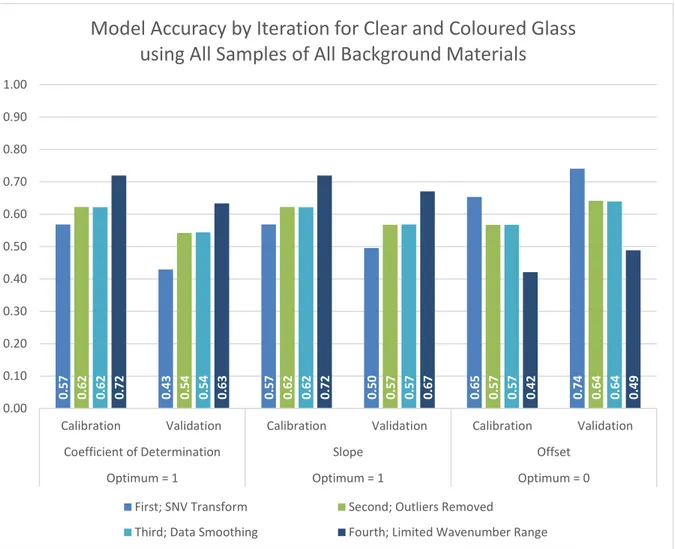
Further manipulation of data yielded little improvement to the accuracy of the model, thus the fourth iteration was selected as the final version. The pre-processing methods used for the samples with only wood as the background material, described in Sections 4.2.1, yielded a model for all background materials that was less accurate than the one described here. Figure 30 following summarises the improvements to model accuracy at each iteration using the parity plot data. For a parity plot, the ideal coefficient of determination is 1, the ideal slope is 1, and the ideal offset is 0. The significance of methodical data selection and judicious application of pre-processing techniques in model development is apparent. While the importance of data smoothing is not immediately obvious with regards to improving accuracy, this technique allowed for the selection of important wavelengths, which in turn improved model accuracy.
Figure 30. Summary of Accuracy Improvements by Iteration for Model of Glass in All Background Materials 0.57 0.62 0.62 0.72 0.43 0.54 0.54 0.63 0.57 0.62 0.62 0.72 0.50 0.57 0.57 0.67 0.65 0.57 0.57 0.42 0.74 0.64 0.64 0.49 0.00 0.10 0.20 0.30 0.40 0.50 0.60 0.70 0.80 0.90 1.00
Calibration Validation Calibration Validation Calibration Validation
Coefficient of Determination Slope Offset
Optimum = 1 Optimum = 1 Optimum = 0
Model Accuracy by Iteration for Clear and Coloured Glass
using All Samples of All Background Materials
First; SNV Transform Second; Outliers Removed
4.2 Multivariate Analysis of Clear and Coloured Glass in Wood Shavings
The multivariate analysis performed involved using all of the acquired NIR spectral data across one type of background material, i.e. wood shavings, to develop a predictive model that can be applied to glass detection.
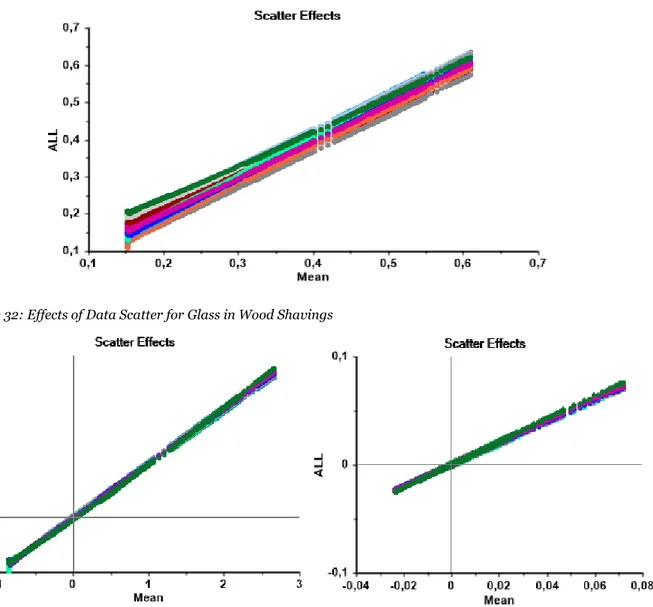
For this analysis, 60 samples of wood shavings were analysed for glass detection. Out of 60 samples, there were 30 samples of each of clear and coloured with glass volume percentage between 0.21% - 4.87%, excluding the 3.7% set. This was done to have the same number of samples with same glass content in clear and coloured glass. Figure 31 following shows all of the collected spectra for the glass detection analysis which have wood shavings as the background material. The spectral data with wavenumbers less than 4200 cm-1 was
oversaturated and thus not included in the analysis. In the high wavenumber region of the NIR spectra there is some variation apparent; these samples were captured on different days.
Figure 31: Near-Infrared Spectra of Samples used for Glass in Wood Shavings Analysis
4.2.1 Application of Pre-Processing to Raw Spectral Data
A Descriptive Statistics analysis was applied to the data to inspect the data scatter. The scatter plot of raw spectra in Figure 32 clearly shows the presence of additive and multiplicative effects on the spectral data. The raw spectral data was first pre-processed with an SNV transform to remove the multiplicative effects, and followed with an S-G first derivative transform with a second-degree polynomial and 13 smoothing points to remove the additive effects. The comparative effect of processing is shown in Figure 33. Figure 34 following shows the pre-processed spectra used for multivariate analysis; the high wavenumber region of the spectra includes a large amount of noise and in the low wavenumber region of the spectra shows significant variation in absorbance.