Department of Business Administration International Business Program
A Comparative Study on
Green Mutual Equity Fund’s
Financial Performance
International vs Domestic Fund
Composition
Abstract
In this thesis the relationship between regional composition and risk-adjusted performance is evaluated concerning Swedish issued green mutual equity funds. By using three different indices; Sharpe, Jensen and Treynor, a relationship has been able to establish. The study finds no strong relationship between geographic composition and performance concerning any of the indices and thus the impact of diversifying one's portfolio has little impact. By using the Modern Portfolio Theory, Stewardship Theory, Home Bias Theory and Behavioral Finance Theory a theoretical discussion has been established in order to further examine and analyze the fundamental dynamics of this relationship. Lastly, model risk and other variables impact on performance has been investigated. Our study finds a potential model risk since our three indices results disparate. Further, ESG related factors and Morningstar ratings seem to impact performance greater than regional composition.
Keywords: Risk-adjusted rate of return, mutual fund, performance, green investing,
international diversification, Modern Portfolio Theory, Stewardship Theory, Home Bias Theory, Behavioral Finance, Sharpe Index, Jensen Index, Treynor Index
Acknowledgements
We firstly like to express our deep gratitude to our supervisor Catherine Lions, Senior lecturer (Associate Professor) at Umeå School of Business and Economics, for all her generous support, constructive feedback, and encouragement throughout the process of writing this thesis. With her expertise, deep knowledge in finance, involvement, and willingness to help us during this nearly five-month long process, we have been able to complete this degree project that contributed to further research within sustainability and finance.
We would also like to express appreciation and gratitude to each other for good cooperation and teamwork which has made the writing of this thesis feasible. With two different backgrounds, experience, and knowledge this thesis has developed into its final result. With the commitment, engagement, and encouragement from each other the project has been achievable.
Stockholm, May 14th, 2020
Table of Contents
1. Introduction 1 1.1 Problem Background 1 1.2 Problematization 3 1.3 Research question 5 1.4 Research purpose 5 1.5 Theoretical contributions 5 1.6 Practical contributions 6 1.7 Delimitations 71.8 Choice of Subject and Preconceptions 7
2. Theoretical Point of Reference 9
2.1 Return, Risk, and Performance Index 9
2.2 Diversification Strategies 10 2.3 Performance Indices 11 2.3.1 Assumptions 11 2.3.2 Sharpe Index 11 2.3.3 Jensen Index 12 2.3.4 Treynor Index 13
2.3.5 Critique and Acknowledgements on Performance Indices 13
2.4 Mutual Fund 14
2.4.1 Mutual Equity Funds 15
2.4.2 Index Mutual Fund 15
2.4.3 Green Mutual Equity Funds 15
2.5 Sustainability rating for mutual funds 15
2.5.1 Morningstar Sustainability Rating 16
2.5.2 Morningstar Portfolio Sustainability Score 16
2.5.3 Morningstar Historical Portfolio Sustainability Score and Globe Rating 17
2.5.4 Drivers for Green and Sustainable Mutual Funds 17
2.6 Funds and International diversification 18
2.7 Equity fund performance and seasonality 19
3. Theoretical Framework 21
3.1 Traditional Theories in Finance 21
3.1.1 Modern Portfolio Theory 21
3.1.2 Stewardship Theory 23
3.2 Modern Controversies 24
3.2.1 Home Bias Theory 24
3.2.2 Behavioral Finance 26 4. Scientific Method 28 4.1 Research Philosophy 28 4.1.1 Epistemological assumption 28 4.1.2 Ontological assumptions 29 4.1.3 Axiological assumptions 29 4.1.4 Rhetorical assumptions 29 4.1.5 Methodological assumption 30
4.2 Research Approach 30
4.3 Research Design 30
4.4 Research Strategy 31
4.5 Literature Search 32
4.6 Source Criticism 33
4.7 Social and Ethical Considerations 35
5. Research Method 37
5.1 Hypotheses 37
5.2 Population and Sample 38
5.3 Variables 39
5.3.1 Dependent variables (Sharpe, Jensen and Treynor Index) 39
5.3.1.1 Risk-adjusted Performance Index 40
5.3.1.2 Benchmarks 40
5.3.2 Independent variable 42
5.3.3 Control variables 42
5.4 Two-sided T-test 43
5.5 Regression Analysis 44
5.5.1 Ordinary Least Square 45
5.5.2 Regression Model 45
6. Data and results 47
6.1 Data gathering 47
6.2 Descriptive statistics 48
6.2.1 Multicollinearity 52
6.2.2 Final regression model 54
6.3 Results of the T-test 55
6.3.1 T-test Sharpe Index 55
6.3.2 T-test Jensen Index 56
6.3.3 T-test Treynor Index 57
6.4 Linear regression with control variables 57
6.4.1 Linear Regression Sharpe Index 58
6.4.2 Linear Regression Jensen Index 59
6.4.3 Linear Regression Treynor Index 60
7. Analysis 61
7.1 Green Fund and Performance 61
7.2 Theoretical 64 8. Conclusion 66 8.1 Concluding Remarks 66 8.2 Truth Criteria 66 8.2.1 Reliability 66 8.2.2 Validity 67 8.2.3 Generalizability 67
8.3 Societal and Ethical Implications 68
8.4 Theoretical and Practical Contributions 69
8.5 Suggestions for Further Research 70
Appendices 77
Appendix 1: Net saving after saving category (2000-2018) in billion SEK 77
Appendix 2: Swedish fund wealth development 2000-2018, in billion SEK 77
Appendix 3: Full list of keywords 78
Appendix 4: OMX30 top ten list of companies, weight and industry breakdown, December 2019. Source:
NASDAQ OMX 79
Appendix 5: Calendar year performance, Source: NASDAQ OMX 79 Appendix 6: Full list of funds 80
List of Figures
Figure 1. Valant pharmaceutical stock price 2015-2020 (Feb) (Yahoo Finance, 2020). 2
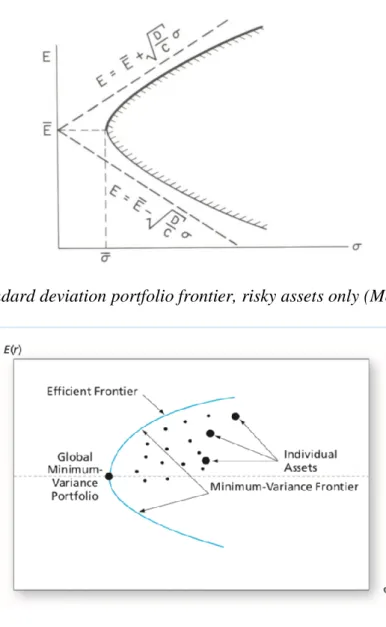
Figure 2. The minimum-variance frontier of risky assets (Bodie et al., 2011, p. 211) 10
Figure 3. Portfolio standard deviation and number of funds (Penman, 2012, p. 648) 22
Figure 4. Mean-standard deviation portfolio frontier, risky assets only (Merton, 1972, p. 1857) 22 Figure 5. OMX30 January 2019 to December 2019, Source: NASDAQ OMX Nordics 41
Figure 6. Two-sided t-test (Studenmund, 2016, p. 135) 44
Figure 7. Histogram of ESG Risk Rating 50
Figure 8. Histogram of Morningstar Rating (Star) 51
Figure 9. Histogram of Issuing Year 52
List of Tables
Table 1. Morningstar Sustainability Rating Distribution (Morningstar Methodology, 2019, p.3) 17
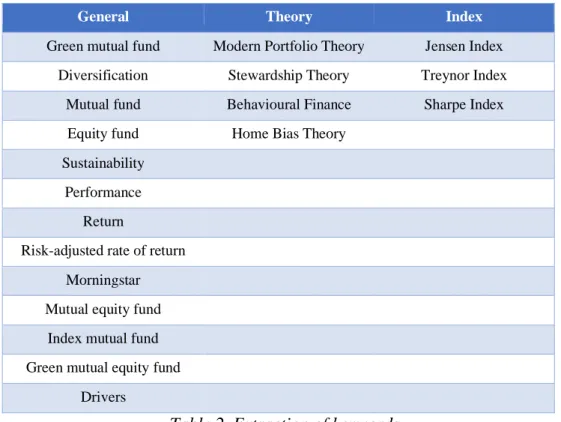
Table 2. Extraction of keywords 33
Table 3. Academic Journal list 34
Table 4. List of variables 39
Table 5. Return of portfolio 48
Table 6. Descriptive Statistics 49
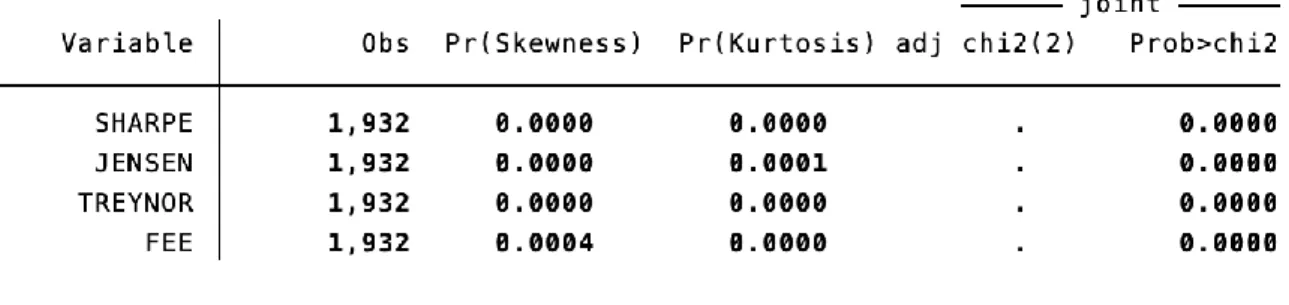
Table 7. Skewness/kurtosis test for normality 49
Table 8. Frequency table of Morningstar Sustainability Ratings (Globe) 50
Table 9. Frequency table of Invested capital 51
Table 10. Correlation Matrix 53
Table 11. Variance Inflation Factor test 53
Table 12. Means of residuals for linear regression 54
Table 13. Two-sample T-test Sharpe Index 55
Table 14. Two-sample T-test Jensen Index 56
Table 15. Two-Sample T-test Treynor Index 57
Table 16. Linear regression Sharpe 58
Table 17. Linear regression Jensen 59
Table 18. Linear regression Treynor 60
Glossary
Beta Sensitivity of the portfolio or single security to the market
movements. The market has a beta of 1.00. Beta measures the volatility or systematic risk (Brealey et al., 2011, p. 174).
Beta coefficient Change in the dependent variable that is measured in standard
deviation to the independent variable. The higher the value of the beta coefficient results in a higher strength between the two variables (Schroeder et al., 1986, p. 32).
Black peers Funds within fossil energy and natural resources (Ibikunle &
Steffen, 2014, p. 353).
Correlation coefficient Degree of association between the variables measured. Correlation coefficient measures both the strength of the correlation and the direction of the linear relationship. The range is from +1 to -1. If the two variables are perfectly positively correlated then the correlation will be +1 if the two variables are perfectly negatively correlated than the correlation will be -1, lastly, if the two variables are uncorrelated then the correlation will be 0 (Studenmund, 2016, p. 232-233).
Diversification Many securities and assets held in a portfolio making the exposure to any particular asset or security restricted (Bodie et al., 2011, p. 10).
ESG factors Environmental, Social, and Governance factors. ESG scores
are often associated with sustainable investing, socially responsible investing, mission-related investing, or screening (MSCI, n.d.).
ETFs Exchange-traded funds, that is an investment fund that is
traded on stock exchanges (Kanuria & McLeod, 2015, p. 250-251).
Financial performance In this thesis, financial performance is associated with funds return and risk-adjusted rate of return.
Green Fund A fund that makes investments in companies which are
considered to be environmentally friendly (Morningstar Glossary, n.d.).
Mutual Equity Fund Equity funds are primarily in stocks (Morningstar Glossary, n.d.).
Mutual Fund When money is invested in a mutual fund the investors’ money is pooled together with other investors to buy shares of stocks, bonds or other securities creating a portfolio. This is managed by professional fund managers (Morningstar Glossary, n.d.).
Portfolio A combination of assets owned by an individual, institutional
investor or mutual fund portfolio manager. A portfolio can be made out of only one type of security or may contain a combination of different securities such as stocks, bonds and other types of investment securities (Morningstar glossary, n.d.).
Standard deviation Measures the dispersion or spread of a fund's return around its average return over a certain period. The most widely used measure to determine the risk of mutual funds and ETFs are standard deviation. Standard deviation is the square root of the variance (Stain & Charest, 2017).
Sustainable Fund Funds that use environmental, social and corporate
governance (ESG) benchmarks to evaluate and assess an investment's social effect (Hale, 2018).
Systematic risk The risk that cannot be diversified away between the fund and
the market. It is the risk that affects the market and is independent of the fund (Penman, 2012, p. 648).
Total risk In this thesis, total risk is associated with the sum of systematic
risk and unsystematic risk.
Unsystematic risk The risk that can be put aside due to diversification is the diversifiable risk or unsystematic risk (Penman, 2012, p. 648).
“Someone is sitting in the shades today because someone else planted a tree a long time ago.”-
(Warren Buffett, n.d., cited in Friedman, 2018)
1. Introduction
In this chapter, we will first present the background and the problematization of green investing and our intended study. Continuing, we will address the research purpose and our chosen research question. Moreover, desired theoretical and practical contributions will be explained and lastly, we will acknowledge the delimitations of the study.
1.1 Problem Background
In order to achieve U.N.´s seventeen global goals for sustainable development set to 2030; to eliminate extreme poverty and solve the climate crisis among others, it is crucial and essential to invest in companies that make socially favourable decisions (UNDP, n.d.). A study made by the
Swedish Investment Fund Association has looked into the importance of sustainability when
choosing funds in the pension system and for investors’ private savings in 2018 among Swedes. The results show that one out of three investors have decided to invest in a sustainable fund, an increase from the previous year, 2017, when it was only 24%. The survey indicates that there are three main reasons for conducting sustainable investment; (I) (49%) to avoid a certain type of company or industry that is believed to be unethical, (II) (38%) to have an impact on the environment, working conditions, human rights, etc. (III) (10%) it will yield a higher return. Interestingly, compared to the previous year the proportion that believes in a higher return has decreased by 6% (Swedish Investment Fund Association, 2019, (a)).
Ethical values and unethical investments have previously been seen as a hazard to profit, but this view has changed and an increased number of corporations, institutions as well as individuals are progressively considering ethical aspects. Conducting projects that affluence ignorance, prejudice, and discrimination have become increasingly disadvantageous for firms and the capability to spread information promptly around the world, due to the internet and social media among others has increased both customers and shareholders’ knowledge about the existence of ethical issues (Glomsrød & Wei, 2016). An example is the big pharma scandal that took place in 2015. The pharmaceutical company Valeant's CEO had a strong belief that the company could increase its efficiency by only focusing on distribution and not on research and development by acquiring other small pharmaceutical companies. At the same time, Valant decided to increase the price of their drugs. After the news hit, the stock price dropped immediately (Surowiecki, 2016) and the firm has yet not recovered and is far from reaching the previous stock price, as shown in figure 1.
There is yet no taxonomy on the impact that sustainability considerations have on the stock market, but various and repeated times we can see examples of stock market movements that arise from scandals, such as the Volkswagen, BP and Facebook scandal which all conducted to a big short term drop in the share price (Hall-Smith, 2018).
Figure 1. Valant pharmaceutical stock price 2015-2020 (Feb) Source: Yahoo Finance, (2020).
According to Khorana, Servaes & Tufano (2005), the fund industry can differentiate between countries and has an increased possibility to embellish in some countries. In regions where there are more robust rules, laws as well as regulations to protect and assure the right for investors, the fund industry is often larger. Furthermore, regions where the population is more educated and more well-off in terms of wealth also tend to have a larger industry for mutual funds (Kharona et al., 2005, p. 145-185). Sweden is the country where fund saving is the most popular compared to the rest of the world. 80% of Swedes save in funds and if the mandatory premium savings are included, 100% of Swedes are fund savers. In 1994, the premium pension became a part of the public pension system and 2.5% of a person’s salary would go to the premium pension. This has had a big impact on the fund market in Sweden, and all individuals that have an income and were born after 1938 have become fund savers automatically. In 2012, the investment saving account (ISK) was introduced to encourage and trigger saving in funds as well as in equity. ISK has no tax on the capital gain but instead, the investor pays a standard tax rate annually (Swedish Investment Fund Association, n.d., (b)). As the premium pension is mandatory for working Swedish individuals, one could argue that the so-called Greta effect, as well as social awareness, could create pressure for the regional composition of the premium pension fund to be more sustainable. Furthermore, there are different types of mutual funds that can be divided up into subcategories such as mutual equity funds and index mutual funds, which increases the rage of possible investment decisions.
In 2018, when excluding the premium pension, Swedes exceedingly saved their funds using an ISK account, 23 billion out of the 63 billion of the total net saving. Moreover, investments in mutual funds via ISK mainly went to mixed and equity funds and have had the highest net inflow since 2014, compared to direct savings in funds that have had a negative net inflow since 2015 (see Appendix 1). Interestingly, the fund wealth has a steep upward slope and when comparing the wealth from 2000 to 2018 it has increased by approximately 440% (see Appendix 2) (Swedish Investment Fund Association, 2019, (c)).
How do savers spread the risk of their savings? To manage the risk that could occur when saving for example in funds or stocks a favourable way is to diversify the portfolio of securities. Diversification is the process of spreading the risk or minimizing the risk of savings or investments. There are several types of risk that can be reduced in different ways, however important to note is that all risks cannot be vanished due to diversification and there will always be some risks remaining. Some examples of diversification are to spread the risk with several securities, for example by buying several shares, funds, among others. This belief is that if for example if one stock drops significantly in value, other stocks might keep their value or increase their value and therefore the total value of the portfolio of securities is not dependent on one single security. Furthermore, another way to spread the risk is to diversify on several markets, where the same belief goes here, having different branches or counties that are invested in will not make the portfolio depend on the performance of one single security. Historically, higher return has been gained when owning securities that are spread in different markets (Avanza, n.d.). Modern Portfolio Theory explains how investors should spread their securities where diversification is the
central theme in order to maximize once risk-adjusted rate of return. In the case of “putting all the eggs in one basket”, the return of the portfolio is dependent on the presentation of one security (Markowitz, 1952). In contrast to the traditional theories in finance, that emphasise one diversifying a portfolio, a more controversial idea of modern controversies has developed. The idea behind these theories is the exact contradiction where Behavioural Finance can explain the influence of psychology on the behaviour of investors and why investors choose to invest domestically and therefore spread the risk to a smaller extent (Brealey et al., 2011, p. 326).
A previous dominant debate concerning whether green mutual funds’ performance differentiates to their conventional peers has been discussed extensively. However, the results differentiate drastically from each other. There are arguments that are both in favour and against the performance of green mutual funds, but also the impact that the funds have dependent on the market conditions disparate. However, less consideration and emphasis have been put to compare green mutual funds’ performance in different regional investment compositions. This is especially interesting for three main reasons, firstly; we live in a time where sustainability and sustainable investments are a much debated and top prioritized topic, secondly; economic expansion generally increases the demand for funds (Smith, 2020) and lastly; to see how well the geographical composition of mutual green funds affects performance. Furthermore, home bias is an important factor to consider, since the majority of investors have a tendency to invest domestically due to the feeling of being “safe” and being familiar with legal restrictions and lower transaction costs, impacting the systematic risk. Karlsson & Nordén (2007) have studied home bias and international diversification among Swedish investors and found a significant relationship between individual characteristics and the likelihood of home bias, a higher probability of home bias is found for employees in the public sector compared to the private sector. Furthermore, a relationship could be found between previous work experience and gender where men have a higher tendency to be more home biased (Karlsson & Nordén, 2007, p. 330-331).
In addition, Coval & Maskowitz (2001) find results saying the local fund managers create abnormal higher returns in their local domestic investments. The results say to suggest that the managers earn higher returns as compensation for the greater knowledge of local companies and their stocks. It can be explained by either greater monitoring skills or access to more information on the geographically close firms (Coval & Maskowitz, 2001, p. 838). It is noteworthy that at the time of the study information was more difficult to gather because of less developed digitalization. However, the point of the home bias in fund management needs to be taken into consideration.
1.2 Problematization
Funds are important for several reasons; it is important for personal finance, financing an investment of a company and socioeconomic growth. For individuals, fund saving is crucial for long-term savings as it can support pension or make an economic buffer to buy a new home or to e.g. travel, renovate, etc. Funds are generally said to be very good for regular saving especially for those who lack knowledge of stock market development. Funds also spread the risk, and the diversification effect is dependent on the chosen fund itself. Since the 1980s, funds have become a natural part of the private Swedish household savings by the so-called allemans funds that were created to stimulate private savings, specifically in funds. Even today the importance of funds for the welfare of households is clear to observe by the pension premium that was created to secure the livelihood and income after pension. This clearly shows the importance of funds in the Swedish welfare system for households in order to obtain a well-functioning scheme and structure. In sequence, this contributed the state and companies to make investments that are essential for a society to grow, making it a substantial part of funding. Consequently, this helps to create more job opportunities, develop new products, among others. Furthermore, by investing in funds that
invest in other countries, investors can devote and contribute to growth in other countries as well. This has resulted in an increase in Swedish people’s financial assets, primarily due to development and an increase in the fund and stock market. For the last 25 years, the fund market in Sweden has grown rapidly and the fund ownership on the Swedish stock exchange has doubled from 6% to 12% (Swedish Investment Fund Association, n.d., (d)).
There has been wide-ranging previous research that compares the performance of green funds and their conventional peers and their sensitivity to the market during different time horizons and extensive research that compares green mutual funds and their conventional peers. For example, Ibikunle and Steffen (2014) have looked into European green mutual fund performance and compared it to their conventional and black peers during 1991-2014. Their results showed a significant negative risk-adjusted abnormal return when compared with the broad global market benchmark for the green, black, and conventional funds. This research also indicates a slight underperformance of green mutual funds when comparing it to its conventional peers. Furthermore, this research indicates no risk-adjusted difference in performance between green mutual funds and black mutual funds. However, interestingly their research shows that for the latter part of the period, 2012-2014, green funds significantly outperform their black peers (Ibikunle & Steffen, 2014, p. 353).
Furthermore, a previous study made by Silva & Cortez (2016) investigated the performance of US and European green mutual funds in different market conditions. Their results indicate that green funds have a tendency to underperform the market benchmark concerning both All-world index, FTSE, and socially responsible global market index, FTSE4GOOD, moreover, European green funds underperform to a larger extent. Furthermore, the underperformance has a higher tendency to accrue during a bust economy, and green fund performance is higher during periods of crisis. Furthermore, it indicates that there is small to no differences in the performance of green funds with a so-called SRI label which is a tool for choosing sustainable and responsible investments. and green funds without the label (Silva & Cortez, 2016, p. 564-565).
Moreover, there has been previous research that compares the green fund performance in two markets, the US and Europe, in different market conditions (Silva & Cortez, 2016). Furthermore, other studies look specifically into different regions, for example, Dahlquist et al. (2000) that investigated the performance and characteristics of Swedish mutual funds and Matallin-Saez et al. (2018) analysed the performance of US socially responsible mutual funds over different business cycles.
Lastly, studies have been made to examine and determine the benefits of international portfolio diversification. Diversification is defined as many securities and assets held in a portfolio making the exposure to any particular asset or security restricted (Bodie et al., 2011, p. 10). There are several ways to diversify a portfolio; it can be done through using different types of assets, investing in different markets geographically or in different branches. Regardless of how the diversification is conducted the goal is to spread the risk. This method of diversifying the risk is a simple way to lower the risk without impacting the return negatively. Restrictions in the ability to diversify once portfolio will make it challenging for the investors to maximize once risk-adjusted rate of return. According to the efficient market hypothesis, there are mainly two different types of management strategies; (I) passive management, where the manager highly diversifies a portfolio without spending efforts in order to improve investment performance using security analysis. (II)
Active management, where the manager has the goal to improve performance by identifying
mispriced securities or by timing the performance of broad asset prices (Bodie et al., 2011, p. 10). A major study by Engström (2003) compared European issued mutual funds that invest in its domestic market (Europe) and international market (Asia). Engström examined portfolios of mutual funds from the regional locations in terms of return and its performance compared to the regional index by MSCI. A later study by Kanuria & McLeod (2015) also examined possible
international diversification benefits for U.S. investors when investing in exchange-traded funds (ETFs). However, there has been no previous study that specifically has looked into Swedish issued green mutual fund performance based on its geographical investment strategy and composition.
This research can thus contribute to new knowledge in this area and help to build on existing knowledge. Research has evolved concerning this topic, from using theories such as Portfolio Theory, Modern Portfolio Theory, and in the perspective of stewards, it has derived and evolved from the perspective Behavioural Finance that we will use to further develop our understanding. Furthermore, research has also continued to develop concerning measurements for the return of an investment, well-known ratios such as Sharpe, Jensen, Treynor ratios use different theoretical perspectives to assess performance applying different factors such as the measurement for risk and actual return of a portfolio. We will use these theoretical perspectives further in the next chapter to build up a theoretical framework.
1.3 Research question
We will investigate green mutual equity funds’ performance through the following research question:
Does performance differ between an international and a domestic composition of green mutual equity funds?
1.4 Research purpose
The primary purpose of the study is to examine if an international or domestic composition in a portfolio of green mutual equity funds is superior to one another. To be more precise, the purpose is to compare quarterly returns using our time frame of two portfolios, (I) green mutual equity funds having an investment composition of globally diversified stocks, and; (II) green mutual equity funds having an investment composition of Swedish domestic stocks.
The secondary purpose is to explain theoretically the different approaches that can be taken towards international diversification. By implementing theories in favour of cross-border investing as Modern Portfolio Theory and Stewardship Theory, but also in favour of domestic investing in the form of Home Bias Theory and Behavioural Finance. Our hope is to be able to test the theories applicability in relation to the results found. Through adding theory conflicting between regional compositions, a scope for both viewpoints is at hand. A complementary purpose is to extend the discussion of what certifies as a green mutual fund by addressing the issue and add ground for a more distinctive framework in the future. Furthermore, by comparing results obtained from using three different risk-adjusted performance indices, we would like to add light of the possible concern of model risk.
1.5 Theoretical contributions
This thesis aims to contribute to literature regarding green mutual equity funds and build scientific knowledge in this area. We wish to contribute to a better understanding of investment decisions which will have an impact on both individual, corporate and institutions’ long-term savings and funding. Furthermore, our research is during a time in Sweden with good economic conditions; where the economy grows and markets, in general, bring a higher return to investors. We wish to contribute to examining the impact that diversification has regarding green mutual equity funds and therefore we have focused on two geographical compositions; domestic green funds that have domestic diversification and international green funds that have extensive international diversification. We also hope to add guidelines to the term green mutual equity fund since there is
no clear and consistent explanation and definition of the term today and there are many different frameworks for it, some more used than others. Although, there is no clear party or organization that is superior to determine it. Therefore, further research is reasonable to conduct by addressing the issue and continuing to question what labels of being green, sustainable, or socially responsible. Individuals, companies, and institutions might carry different views on the performance of green mutual equity funds that impact their investment strategy and funding strategy. In order to contribute to better investment decisions for these parties, we found a need to develop theories and new contributions to research.
Due to the increased demand to invest more sustainably and green, this could have an impact on the theoretical discussion since this previously has not been considered to that high of an extent. New mechanisms such as a rise in climate thinking are needed to be considered since it impacts investment and operating decisions. Diversification is the second mechanism that is needed to be considered since one could argue that by investing abroad it could be implied as being “scary” or “unpredictable” by individuals and companies. Individuals tend to invest heavily domestically, where reasons such as confidence about performance and comfort seem to be reasonable reasons (Thaler, 1993, p. xx).
Our theoretical framework will hopefully help to analyse the dynamics between the relationship of performance and regional composition of green mutual equity funds that finally we expect to bring awareness and comfort for investors and be guided in their decision making. Lastly, if our findings indicate that the selection of index matters, our research could give new insight of the impact that choosing an index has on results.
1.6 Practical contributions
Many studies have been conducted on green mutual equity funds and their performance in regard to their peers. Hence, our research could give valuable information on investment proposals to increase performance and at the same time as remaining green.
The practical implications of the research will be to give reasons for the actual effects of investing in green funds. The study will primarily focus on performance and not on the social impact of investing. As investors are becoming more aware, it is reasonable to argue that they will require more information on the impact they are financially contributing to. By building and increasing knowledge concerning the performance of green mutual equity funds and their impact on regional composition we want to create value for three important parties in the fund market: individuals, corporations, and institutions. We expect to contribute to better investment decisions by providing a relationship between fund regional composition and performance.
By conducting the thesis, we want to create a guideline for investing in the Swedish mutual fund market, by either choosing an internationalized diversified or a domestically diversified portfolio of green mutual equity funds. Through comparing risk-adjusted returns from the two portfolios we want to be able to draw conclusions on what is the optimal green mutual equity fund composition regarding regional investing. Also, as the thesis will include three different risk-adjusted performance measures, the hope is to extend and contribute to knowledge regarding the model risk when comparing mutual funds. Hence, the critical decision when deciding for a specific measure.
Lastly, the state and the employers can better monitor the mandatory part of pension saving, by including more green mutual equity funds, domestic and international, that could both be better for sustainable development and possibly better return simultaneously.
1.7 Delimitations
Our decision is to investigate green mutual equity funds registered in Sweden that have regional investment compositions of either Swedish or globally diversified stocks. This limits our research to Swedish mutual funds and not the entire world. This focal point is made due to more easily accessible data and to fairly be able to compare the samples collected. The data sampled will be described more thoroughly in chapter 6.
A limitation of the study will be how to identify what certifies and counts as a green mutual
equity fund. However, in this thesis, Morningstar Glossary will be used to define our terms. Due to
the fact that there is no defined definition we cannot have a large time frame since the definition changes rapidly. Due to the many frameworks that exist, we have decided to create our own guideline for a green mutual equity fund in this study based upon well-established sustainability scores. The two scores that will be used as criteria for this are conducted by Morningstar. Additionally, we will look at green mutual equity funds that operated over the calendar year of 2017 to 2019, which implies that the funds analysed must have been issued before 01-01-2017 and active by that date. As a result of this, we must exclude the green mutual equity funds issued after the date to create a reliable sample that could more easily be analysed.
Regarding types of mutual funds, we have chosen to focus on equity funds due to comparability. Equity funds usually display higher volatility and therefore are exposed to greater risk (Donovan, 2019). This implies that we will exclude fixed-income funds, money market funds and hybrid funds from our data set. We find this reasonable since it follows Ibikunle and Steffen’s (2014) framework when comparing European green mutual funds with black and conventional mutual funds.
For the study, in consideration of the stock geographical composition of mutual funds and its diversification mechanisms, our focus will be on the geographical location of the stock in the fund. This implies that other composition factors that are available to accomplish diversification will not be researched. The time frame of the study is 4-5 months which will require limitations to what extent the study can be conducted. Therefore, constraints have been made to the sample to fit the comparability of it. If the period would have been of longer extent, more possibilities of comparability in terms of variables could have been conducted.
1.8 Choice of Subject and Preconceptions
We are two students from the International Business Program at Umeå School of Business, Economics and Statistics conducting our degree project. Both of us are on the level of first-year master studies with a majority of graduate studies within finance. Through our studies, we have gathered significant knowledge in business administration as it has been the core of the four-year program. Throughout, we have gained an understanding of the importance of sustainability in the corporate environment, and how it is close to inevitable to not consider it in a company's operations as individuals and consumers are becoming more aware of their actions and choices.
The two of us have gained international knowledge through our university program´s profile and studies. One of us has knowledge from living abroad studying and working in France and the Netherlands, respectively. Where the other one has knowledge from working in the bank industry with international trade finance at a market leader in Sweden. We want to interpret the knowledge and insights we possess to the thesis to create a good perspective on green investing. As sustainability is a major topic in today's society, we have gained a high societal awareness of the changing environment and the importance of every individual to implement a more sustainable lifestyle. This is the main reason for us to conduct this study to contribute with information on the performance of green mutual equity funds.
A preconception about the mutual fund and stock market is at hand of the research and undeniably affected the choice of research and theories. Both of us are Swedish and have personal investments in mutual funds, which implies prior knowledge and information. However, the study will be of quantitative nature and will include hypothesis testing that will largely eliminate the potential bias and usage of prior knowledge, if not all. Us, the researchers, are also aware of the importance of remaining objective throughout the research.
“It takes 20 years to build a reputation and five minutes to ruin it. If you think about that, you´ll do things differently.” - (Warren Buffett, n.d., cited in Friedman, 2018)
2. Theoretical Point of Reference
In this chapter, we will briefly go through previous research that will build the base of our research. By doing this, it gives us the possibility to identify and establish a gap in which we have created our research question. These previous research builds the core and backbone of our study and we want to further expand and broaden the academic knowledge within this field of subject. Furthermore, in this chapter, we will introduce definitions of the key concepts that are used.
2.1 Return, Risk, and Performance Index
Simply, the return of a portfolio is the gain or losses created by an investment portfolio. The return is based on the objective of the investment strategy and risk tolerance. The return of a portfolio has a goal to meet the stated benchmark and investors tend to have several portfolios in order to balance the return of their investments over time. The total return is both income, that being dividend or interest payment as well as a capital gain (or loss) that changes the value of a security. Morningstar calculates the total return by changes in the funds NAV, Net Asset Value (Morningstar Glossary, n.d.).
The risk-free rate is the rate of return when taking no risk, and there is no default risk. Some argue that there should be no reinvestment risk either. Simply, it is the interest that is expected from a risk-free investment over a specified time period. This real risk-free rate is the expected inflation rate subtracted from the yield of a treasury bond that matches the duration of the designated investment. Thus, it is the absolute minimum return that is expected of an investment since an increased level of risk must lead to an increased potential rate of return. Having a negative interest rate will push the risk-free return to the utmost, causing a situation where investors are willing to pay in order to place their money in obligations that are viewed as being risk-free. Nonetheless, there is always a small amount of risk in every investment that cannot be eliminated. All investments and even the safest ones bear a small amount of risk, however, treasury bills are often assumed as being risk-free (Damodaran, n.d., p. 2-10). There are several factors that contribute to the default risk: the size and liquidity being important factors. Also, currency risk can become substantially large for foreign investors, but this risk can be hedged by forwards and options, consequently impacting the rate of return.
An important variable to interpret the risk of a fund is to understand the standard deviation of the portfolio. Altman & Bland (2005) explain that standard deviation (σ) measures variability and when using a sample, the standard deviation helps to assess the variability of the entire population (Altman & Bland, 2005, p. 903). As written earlier, the Sharpe index assumes a normal distribution, hence, about 95 % of individuals will have a value within two standard deviations from the mean. However, the mean is not from the sample but from the population as a whole. Data collection is made to generalize the sample in order to create a sample mean as an estimation for the population mean. Furthermore, one can estimate how much the sample mean will differentiate from the standard deviation (standard error) by dividing the standard deviation by the square root of the sample size (Altman & Bland, 2005, p. 903).
2.2 Diversification Strategies
Diversification is defined as “A rule of conservative investing is not putting all of your investments
eggs in one basket.” (Morningstar Investing Glossary, n.d.). An investor can reduce the risk and
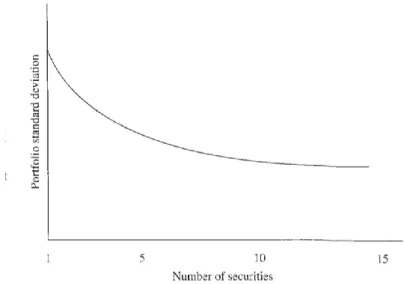
volatility of a portfolio by investing in different types of securities simultaneously, for example in stocks, bonds and short-term investments that are unlikely to all move in the same direction. Furthermore, within each asset type, it is also possible to diversify among issuers, market capitalization levels, industries, geographical locations or between management investment styles for instance growth or value (Morningstar Investing Glossary, n.d.). The idea is that positive return cancels negative return in a portfolio and if the returns of securities are not perfectly correlated, the standard deviation of the portfolio return is less than the average standard deviation of the return of the securities in the portfolio. Thus, the reduction in the variation of returns in a portfolio of securities is the reduction of risk through diversification (Penman, 2012, p. 648).
Figure 2. Portfolio standard deviation and number of funds (Penman, 2012, p. 648).
As shown in figure 2, the standard deviation of return on a portfolio is declining when the number of securities in the portfolio is increasing. If an investor holds only one security in a portfolio, for example, she is exposed to considerable standard deviation of return, hence, adding one more security in the portfolio will reduce this variation. However, there is a point where adding more securities in the portfolio will only slightly reduce the standard deviation, hence, the impact or gain of diversification is very small. A market portfolio is a portfolio holding all available investment assets on the market and therefore the variation of return cannot be reduced further. The leftover risk of a market portfolio is a non-diversifiable risk or systematic risk and the impact is common for all investments. In contrast, the risk that can be put aside due to diversification is a diversifiable
risk or unsystematic risk (Penman, 2012, p. 648).
There are several risk factors that are unique for international investments: (I) exchange rate risk and (II) political risk. Exchange rate risk is the risk of changes in the relative value of a currency and therefore cause a reduction in the value of an investment. Political risk is the possible impact an investment could have due to political changes or instability in a country, where some countries are said to be riskier than others. The variables that are investigated in order to judge the political risks are government stability, socioeconomic conditions, laws and orders, corruption among others (Bodie et al., 2011, p. 871-873).
2.3 Performance Indices
Methods for risk-adjusted performance using mean-variance developed with the Capital Asset Pricing Model. However, William Sharpe, Michael Jensen and Jack Treynor identified implications concerning this well-known model in regard to the performance of managers. All three of these models are used frequently concerning risk-adjusted performance, but they all have their own limitations. Sharpe index measures the average portfolio return over a designated period using standard deviation. Jensen index measures the average return of a portfolio compared to the CAPM using alpha. Lastly, the Treynor index measures the excess return per unit of risk by using systematic risk (Bodie et al., 2011, p. 822). The three indices will be further explained in this subchapter.
2.3.1 Assumptions
Sharpe, Jensen and Treynor index models build on a set of important assumptions. (I) Investors are risk-averse
(II) Investors have indistinguishable decision horizon and similar expectations in regard to investment opportunities
(III) Investors have the opportunity to decide among portfolios on the basis of expected return and variance
(IV) There are no transaction costs nor taxes (V) All assets are boundlessly divisible (Jensen, 1968, p. 390).
These assumptions go against the modern world belief of how investors are. The second-generation Behavioural Finance explained by Statman (2019), defines that people are socially responsible and the return is no longer central. Furthermore, social status is taking up an extensive part of the decision making, and people save and spend according to the life-cycle theory where the existence of weak self-control makes it challenging to save and spend correctly. Moreover, markets are not efficient in the sense that prices are hard to beat (Statman, 2019, p. xi). The assumption of no transaction cost nor taxes is implausible in today’s world, where these factors have a considerable impact on asset and security decision making since they can disparate enormously between one another. However, assumptions about indices and theories are widely common and could be seen as a necessity for testing and comparing. In our testing, even if the assumptions are not perfectly aligned with reality, they produce a good estimate of fund performance, thus, they will be used.
2.3.2 Sharpe Index
William F. Sharpe (1963) evaluated 34 funds during a period of ten years, from 1954 until 1963 and laid the groundwork of the Capital Asset Pricing Model (CAPM), and tried to extend well-known theories such as the Modern Portfolio Theory (Sharpe, 1963, p. 277-293). The model is a guide for investors to understand investment returns from the perspective of risks.
Due to its simplicity of the model, it has become one of the most used risk and return measures in finance. The index explains the excess return that will be created when taking on extra
volatility for holding riskier assets. This is the compensation that will be created for holding riskier assets (Bodie et al., 2011, p 822).
Sharpe Index: Si= (Rp - Rf) / σp
Where:
Si= Sharpe Index
Rp = return of the portfolio; normally distributed
Rf= risk-free rate; measures the compensation for taking on additional risk.
σp= standard deviation of the portfolio excess return
The view of this model is that by subtracting the risk-free rate from the return of the portfolio it will isolate and detach profit from the risk that has been taken, creating a risk-adjusted return. Hence, this index can explain if the return is a reason for smart investment decisions or if the investor has taken on too high risk. Furthermore, the model builds on the assumption that a good investment is one where the increased return does not mean taking on excess risk. This means that if the Sharpe ratio is higher, it has a better risk-adjusted-performance and a negative Sharpe ratio can mean either two things; that the risk-free rate is higher than the return of the portfolio or, that the portfolio return is negative, in both cases leading to an futile result (Goetzmann et al., 2002, p. 2-30).
2.3.3 Jensen Index
Michael C. Jensen (1968), evaluated the performance of mutual funds during a 20-year period, from 1945 until 1964 and built on the Capital Asset Pricing Model, CAPM. He emphasized the fact that a central issue in finance is to evaluate the performance of risky investments. Furthermore, Jensen explained that the approach of portfolio performance has two main dimensions; (I) the capacity for portfolio managers or other security analysts to increase return through future price forecasting, (II) the capacity for portfolio managers to reduce using efficient diversification the amount of inoperable risk (Jensen, 1968, p. 389).
Moreover, Jensen (1968) stressed that previous pursuits have been made in order to appraise the performance of mutual fund portfolios, but have relied on relative measures rather than an absolute measure, hence, put more emphasis on ranking portfolios (Jensen, 1968, p. 389-390). “For
example, if there are two portfolios A and B, we not only would like to know whether A is better (in some sense) than B, but also whether A and B are good or bad relative to some absolute standards.”
(Jensen, 1968, p. 390).
The model builds on the same set of assumptions previously mentioned, plus an additional assumption that the capital market is in equilibrium.
Ji=Rp -[Rf +β×(Rm −Rf)]
Where:
Ji= Jensen Index
Rp = return on the portfolio
Rf = risk-free rate
β = beta of the portfolio measures the systematic risk
The Jensen index entails that the return of an asset is equal to the risk-free rate plus the risk premium of the designated portfolio of the systematic risk and risk premium of the market portfolio. Where the risk premium of the market portfolio is the difference between the return of the market and the risk-free rate. Furthermore, the Jensen index implies what a portfolio expects to earn given the systematic risk (Jensen, 1968, p. 390-391). A positive value indicates that returns are better than the returns predicted by the CAPM, thus, the investment managers are beating the market by achieving better performance than the portfolio's risk profile merits in accordance with the CAPM. In contrast, a negative Jensen value indicates that the investment manager is underperforming the market (Graus-Carles et al., 2018, p. 340).
2.3.4 Treynor Index
Jack L. Treynor (1965), evaluated methods to assess the financial performance of mutual, trust and pension funds. Treynor found an issue that in order to reward the good performance of investment managers, the performance needs to be recognized. He found a lack concerning pension, trust and mutual funds due to that they are massively invested in common stocks. Therefore, the return that is achieved in one period is sensitive to fluctuations that investment managers do not have control over. Hence, Treynor studied and developed a new way to rate the performance of fund investment managers (Treynor, 1965, p. 63).
Treynor (1965) shows that for a specified level of a market rate of return, it is associated with a range of consolidations of expected return and risk. Furthermore, the slope of the portfolio-possibility line, that being a correlation on the expected return and the owner’s risk preference, measures the rate at which investors increase their expected rate of return as the risk increases, hence the strain of owning the portfolio (Treynor, 1965, p. 63-74). Compared to the Sharpe index, Treynor measured the excess return per unit of risk, but instead of using total risk it uses systematic risk, measured with beta, β (Bodie et al., 2011, p. 822).
Ti=(Rp -Rf )/β
Where,
Ti= Treynor Index
Rp =return of the fund
Rf =risk-free rate
β =Beta of the fund
Where beta, β, is deceived through monthly market-model regressions and is a sensitive measure of the return of a portfolio with correlation to the risk on the market (Flaherty & Li, 2004).
2.3.5 Critique and Acknowledgements on Performance Indices
As shown in previous subchapters, the performance indices are computed by different components. Therefore, one could argue that the indices explain different things. The Sharpe index explains the excess return of a portfolio in terms of total risk, Jensen index explains if the fund is beating the market (systematic risk) and Treynor index explains the excess return in terms of market return (systematic risk). Hence, similar attributes are found in Sharpe and Treynor, both computed by the return of the portfolio, subtracted by the risk-free rate. The difference is the denominator, for Sharpe being the standard deviation and Treynor the beta of the fund. Therefore, one could say that out of the three indices, Sharpe and Treynor are the ones most similar, with Jensen as the outlier. However, Jensen and Treynor are the ones incorporating the systematic risk, which Sharpe lacks.
There are several limitations of using the Sharpe index; compared to the Treynor index and Jensen index it uses standard deviation (σ) of the return of a portfolio, which assumes that returns are normally distributed. However, what has been observed is that returns tend to not be normally distributed. In fact, returns in the financial market tend to be skewed away from the average due to an extended number of observed abnormalities of both increases and decreases in prices. Where the price movement is not equally risky in both directions of price movement. Hence, kurtosis and skewness that being fatter tails and higher peaks can create an issue (Goetzmann et al., 2002, p. 2-30). Furthermore, there is a possibility for portfolio managers to manipulate the appearance of their risk-adjusted returns history. For example, by expanding the interval that is measured causing a lowered volatility and by changing the shape of the probability distribution of return. Moreover, managers can choose a period that will create a higher Sharpe ratio rather than choosing a natural look-back period creating a false risk-adjusted return (Goetzmann et al., 2002, p. 2-30).
Critique of the Jensen index is that it does not incorporate systematic risk which is the risk that always exists. Thus, the modified Jensen’s alpha incorporates the systematic risk (Grau-Carles et al., 2018, p. 340): Modified Jensen alpha = α /β.
Critiques for the Treynor Index is that it ignores specific risks since it only considers systematic risks and that it is based on the veracity of the CAPM (Grau-Carles et al., 2018 p. 339). To conclude, the three indices are all ways to measure risk-adjusted performance and should in general produce similar outcomes. Nevertheless, different attributes of the indices exist in terms of computation, which logically also could create variations. Hence, this is the motivation to include the three of them.
2.4 Mutual Fund
A mutual fund is a type of investment security most often managed by professional investment managers made out of a pool of investments in a designated scheme in (I) stocks, (II) bonds, (III) money market instruments, or (IV) other assets. A mutual fund can hold hundreds of different securities creating diversification automatically. However, investing in a mutual fund compared to stocks or shares will exclude the holder of the security of any type of voting right. The goal is to create capital growth and income for the investor and funds can be structured to match the investor’s objectives, desired return, and risk-taking approach. The value of a mutual fund is dependent on its performance and return for the investors can be achieved in three ways; (I) dividend, (II) capital gain by an increased fund value, (III) increase in price on shares. The money managers charge mutual fund fees; either annual operating fees, shareholder fees or penalties when withdrawing early (Lobell, 1961, p. 181-207).
There are several advantages of having a mutual fund, firstly it will create diversification due to the extensive mix of assets that will lower the risk. Secondly, there is high liquidity and thus mutual funds could be traded easily. Thirdly, it provides economies of scale by for example reducing commission charges when creating a pool of securities. Fourthly, it is often managed by a professional investment manager. However, there are also disadvantages such as a possibility that the value of the fund will depreciate and that the returns can fluctuate drastically. Furthermore, to accommodate and shelter withdrawals a large portion of cash is often needed to be kept, and this cash will not produce any return. Lastly, some argue that professional investment manager’s picks are not the preferred choice since managers get paid despite a loss in value (Lobell, 1961, p. 181-207).
2.4.1 Mutual Equity Funds
There are different types of mutual funds dependent on the designated type of security and return of the investor. Equity funds are primarily in stocks and are often divided into their market cap; (I) small-cap, (II) mid-cap, (III) large-cap, dependent on the size of the companies that the fund invests in. Morningstar has defined the different market caps; accordingly, (I) Sweden large-cap equity
funds invest the majority of their equity in large-cap Swedish companies. At least 75% of the total
assets are in equities and 75% in Swedish equity. (II) Sweden’s small/mid-cap equity invests the majority of its equity in small and mid-cap Swedish companies. At least 75% of their total assets are invested in equities and 75% of the assets in Swedish equity. (III) Sweden/Global equity invests both globally and in Swedish equity, and most commonly have between 30% to 75% of the total assets in Swedish equities (Morningstar Glossary, n.d.). Furthermore, equity funds tend to have a higher risk compared to other fund types, which increases the volatility of earning. The probability for both increases and decreases in value is larger, which can be preferable for some investors. However, due to the diversification effect of the portfolio, the risk disperses due to that an equity fund must invest in at least 16 different equities. Generally, broader equity funds that disperse the risk in different regions tend to have lower risks and for equity funds that invest globally could be faced with currency risk (Swedish Investment Fund Association, n.d., e).
2.4.2 Index Mutual Fund
An index fund, sometimes called a tracker fund, is a passive fund management type of mutual fund that is constructed in a way to follow, match or track an index and the components that build up the designated market index. The benefit of using an index mutual fund is that it provides a broader market exposure, lower operating expenses, however, it tends to result in lower portfolio turnover (Morningstar Glossary, n.d.). Warren Buffett, an American well-known investor, has recommended saving in this type of fund for retirement, due to the low cost. The portfolio changes when the benchmark index changes or if the fund is following a weighted index, the weights of the securities can change in order to match the benchmark (Gillies, 2017).
2.4.3 Green Mutual Equity Funds
Green mutual equity funds lack a pervading definition and there are many different frameworks that have been used, some more used than others. Therefore, we will form our own definitions with the help and guideline of well-known and well-established sources. In this paper, the definition of green mutual equity fund goes in hand with Morningstar´s interpretation.
A green fund is defined as “A fund which invests in companies which are deemed to be
friendly to the environment” (Morningstar Glossary, n.d.) and an equity fund is defined as “A fund investing primarily in shares. It can be based on any number of investment strategies.”
(Morningstar Glossary, n.d.). Lastly, an equity fund is defined as “A general term for a unit trust,
OEIC or any other collective investment scheme.” (Morningstar Glossary, n.d.). Hence, our
definition of a green mutual equity fund is a fund that invests in companies that are presumed to be environmentally friendly and that primarily invested in shares (75%).
2.5 Sustainability Rating for Mutual Funds
The definition of how to evaluate what classifies as a green mutual equity fund is not fully established. There are various frameworks used for it, however, the most commonly used source for mutual fund analysis is Morningstar. Studies from Kanuria and McLeod (2015) and Matallín-Sáez et al. (2018) used the Morningstar database to gather data for analysing various mutual fund attributes. A study from Ammann et al. (2019) used the Morningstar Direct Database in
combination with the CRSP Survivor-Bias-Free Mutual Fund Database to check if the introduction of the Morningstar Sustainability Rating would shift retail investors to higher-rated mutual funds in terms of sustainability score. The scores used for determining the classification in this thesis for being green will be formed from the Morningstar sustainability ratings.
2.5.1 Morningstar Sustainability Rating
The Morningstar Sustainability Rating was introduced in 2016 to help investors integrate Environmental, Social and Governance information to evaluate portfolios (Morningstar Research, 2019). The rating is said to provide an objective and reliable way to see how portfolios are meeting ESG challenges with information regarding ESG-ratings from Sustainalytics. In 2018, Sustainalytics enhanced its ratings by introducing the ESG Risk Rating, where the objective is to measure to what extent a company's economic value may be at risk due to ESG factors. During 2019, Morningstar changed their methodology for their Sustainability Rating by converting from Sustainalytics´ ESG Rating to their ESG Risk Rating for conducting the score (Morningstar Research, p. 1).
2.5.2 Morningstar Portfolio Sustainability Score
The Morningstar Portfolio Sustainability Score is measured as an asset-weighted average of the ESG Risk Ratings from Sustainalytics, based on each individual company in the fund composition (Morningstar Research, 2019).
Source: Morningstar Methodology, 2019, p. 2
As described earlier, the ESG Risk Rating is determined to what extent a company's economic value may be at risk in relation to ESG issues. For material to be legitimate to consider in the Risk Rating, an ESG risk needs to have a potential consequential effect on the company's economic value, hence the risk/return fundamentals of an investment in the company. What is considered material in form of ESG issues fluctuates between industries and companies (Morningstar Research, 2019, p. 2).
The ESG Risk Rating first evaluates the managed ESG risks that a company carries and then takes the unmanaged ESG risks into account. The rating is conducted as a 0-100 score, where 0 equals no ESG risk, and 100 equals the maximized ESG risk. However, most scores conducted differ around 0-50 (Morningstar Research, 2019, p. 2).
The range is conducted into five risk categories:
0–9.99: Negligible ESG Risk
10–19.99: Low ESG Risk
20–29.99: Medium ESG Risk
30-39.99: High ESG Risk
40+: Severe ESG Risk
The ESG scores of the companies are aggregated to Portfolio Sustainability Score, which is done through an asset-weighted average of all the reported ESG scores. The score is covered by equity and fixed-income securities from firms that possess ESG Risk Ratings. If there is no Risk Rating of the securities, they are not being considered in the Score, this also includes short positions,
derivatives and options. For a mutual fund to receive a Portfolio Sustainability Score, a minimum of 67% of the assets under management in the portfolio must possess a company ESG Risk Rating. Before creating the Portfolio Sustainability Score, the assets under management with ESG Risk Ratings are rescaled to cover 100% of the portfolio (Morningstar Research, 2019, p. 2).
2.5.3 Morningstar Historical Portfolio Sustainability Score and Globe Rating
The Historical Portfolio Sustainability Score is conducted by a weighted average of the last twelve months of the Portfolio Sustainability Scores. This is done to contribute to the score with consistency. Moreover, the most up to date scores are weighted more heavily than the latter ones to make fund managers´ latest investment decisions have more impact on the score (Morningstar Research, 2019, p. 2-3).
From the Morningstar Historical Portfolio Sustainability Score, funds are distributed over category and percent ranks within their Morningstar Global Category. To be considered, each Global Category must have a minimum of 30 funds with a Historical Portfolio Sustainability Score (Morningstar Research, 2019, p. 3).
Table 1. Morningstar Sustainability Rating Distribution
In table 1, the distribution of the scores are displayed relative to its peers within the same portfolio global category. Considering that the rating is distributed within their global categories, portfolios that invest in industries with relatively high ESG Risk could still receive positive Sustainability Ratings, e.g. the energy category. Therefore, if portfolios have a Historical Portfolio Sustainability Score of 30+, the fund cannot receive a higher Morningstar Sustainability Rating than Average (3 globes) (Morningstar Research, 2019, p. 3).
2.5.4 Drivers for Green and Sustainable Mutual Funds
Green investments are growing rapidly and there are several drivers that could explain this fast growth. Eyraud et al. (2013) explained the trends and determinants during a period of 35 years. Their findings indicate that green investments have become a global phenomenon but that the geographical composition of green investments has changed exceedingly during the last years of the study. Furthermore, Asia and more specifically China are of progressively large importance of green investments and in 2009. China invested much more in renewable energy than Europe as a continent in 2010. Green investments are highly influenced and affected by public policies but also impacted by economic growth and interest rates (Eyraud et al., 2013, p. 852).
Sievänen & Scholtens (2013) defined drivers for responsible investments concerning European pension funds by investigating over 250 pension funds in 15 countries in Europe. Eight variables were considered and then linked to pension fund responsible investment; (I) legal origin, (II) ownership of the pension fund, (III) funding type of pension plan, (IV) status type of pension