VTI särtryck
Nr 198 0 1994
Driving performance of DSN (Drivers with
Special Needs) using hand controls for
braking and accelerating
Björn Peters and Lena Nilsson
Reprint of proceedings from 26th International Symposium
on Automotive Technology and Automation conference
(ISATA), Aachen, Germany, September 13-17, 1993
Väg- och
VTI särtryck
Nr 198 ' 1994
Driving performance of DSN (Drivers with
Special Needs) using hand controls for
braking and accelerating
Biörn Peters and Lena Nilsson
Reprint of proceedings from 26th International Symposium
on Automotive Technology and Automation conference
(ISATA), Aachen, Germany, September 13-17, 1993
cd))
Väg- och
transport-forskningsinstitutet
'
Driving performance of DSN (Drivers With Special
Needs) using hand controls for braking and
accelerating.
Björn Peters and Lena Nilsson,
Swedish Road and Transport Research Institute (VTI)
Reprint of proceedings from 26th International Symposium on Automotive Technology and Automation
conference (ISATA)
in
Aachen, Germany 13 - 17 September 1993
The Advanced Transport and Telematics(ATT)/Intelligent Vehicle Highway Systems
Conference
Preface
An Overview of DRIVE II project TELAID
The reported study was accomplished as part of the work in DRIVE II project TELAID, V2032 (TELematic Application for the Integration of Drivers with special needs). The overall objective of the TELAID project is to analyse the possibilities to employ ATT (Advanced Transport Telematics) in order to make it possible for more PSN (People with Special Needs) to become DSN (Drivers with Special Needs). The project has developed a driving task model especially suited for DSN. Surveys and simulator experiments have been conducted in order to nd eventual gaps with current aid systems and needs for improvements. Driving simulator experiments were performed at VTI and TNO with DSN driving cars adapted with conventional aid systems. The results from VTI was presented at the 26th ISATA (International
Symposium on Automotive Technology and Automation) conference in Aachen 13
17 September 1993. These results will be used as a basis for further experiments in which ATT aid systems will be used.
The TELAID consortium
TELAID is run by a research consortium with
Prime contractor:
AUTh - Aristotle University of Thessaloniki (GR)
Dr A. Naniopoulos School of Technology
Transport Engineering Laboratory
54006 Thesaloniki, Greece Tel: + 30 31 - 99 57 65/99 58 36 Fax: + 30 31 - 99 57 89/26 27 84 Partners: HELGECO (GR) HUSAT (UK)
TNO, Road & Vehicles Research Institute (NL) TNO, Institute of Perception (NL)
University of Stuttgart/IAT (D)
GEWIS Labs (D)
GuidoSimplex (I)
Swedish Road and Transport Research Institute VTI (S) AMU/Gruppen (S)
DeLangstraat (NL)
Mobility International Hellas (GR)
Table of contents
Background...l.0.0.0.0'QCOIOOOQOOCOCOOOOQOQQOOCDQOQDOOOOOCO0.0.0.0...ODO...00.0...0.QQOQOQQ...COCO-Q...DOOQOOQOCCOOOOQOOQ3 Method.O...Q...IOQOQOQQQCOQOOOOOOOOOQOQQQOQOOOOQCQOOOQOOQOOOOO0.Q...0.0'O.COO-0.0.00...OCCCICOOOOOCOQOOOOOOCOQQOQQOOIOOOO I Results...|.D.C...0.0...OOOOOOCOC....0.0.0...I,O...l...00.00.0000...OOOOOOOOOO O....
. . I 9
DlSCuSSlOn...O...O...OOOUIODOOOOOOOO...COOOOOOCCOOOO...0.0.0...OIOOOICÖOIOODOIO...COOOOOI.
. 10
COnCluSlOnS...OOICOOO...COOCOQOC...OOOOOOOOQOQIOCO...QODCCQOOOOOOOCOOOC...OCOOO ACknO "I'ledgement C...C...C...IIODOOOODOOOOOOOCQ.O...IOOCOOOOOOOOOCOOOC0.0...10 ReferenCeSOOCDOOOOO...DOOCOOO...O...-OC....OO0.0...QCOOOOOOOIO...OOOOOOOOOOOOOOIDOOODOC000.000... 0.0010
Background
Independent mobility is a vital contribution to the quality of life for people with various impairments. To reach the mobility goal, access to private cars is of growing importance to these groups of people. Besides the life quality aspects, driving one's own car can be crucial for an individual's independence from costly social support. It has been estimated that between 36.4 million and 48.5 million people, or between 11% and 15% of the total population, living in the 12 EEC Member countries and Sweden are
suffering from some form of disability (Naniopoulos, 1992). The severity of the
im-pairments varies within wide limits. Therefor some PSN (_Eeople with Special N_eeds) are not able to drive at all, while others drive adapted cars at high workload, or at high stress, and again others can drive standard cars. To facilitate for various groups of PSN
to turn into DSN (Drivers with Special Needs), efforts have been made to identify their
constraints, residual abilities and limitations relevant for driving, and to classify their special needs with regard to the driving task in order to find optimally adapted solutions
(Nicolle et al., 1992).
How can the vast possibilities of the technological development best contribute to better car adaptations for peOple with special needs, in terms of safety, comfort, independence
and mobility? The basic MMI (Man Machine Interaction) design of new cars is today
often based solely on the resources and needs of able-bodied drivers, while the DSN are normally not considered. Therefore, manufacturers involved in the process of providing cars for DSN often have to start with a given design and make the best out of it. The adaptation outcome relies on skilled craftsmanship, because it has to suit individual DSN with specific needs, and thus requires very explicit problem solving and
knowledge which is not always easily accessible.
The experience and development of car adaptations for DSN have so far mostly been related to physically impaired drivers. Advanced solutions like joystick steering and voice controlled secondary devices are already in use. Also, more than 40 different types of aids for brake, clutch and accelerator, aimed at people with impaired limbs, has been identified. The purpose of this study was to evaluate driving performance of disabled drivers using (needing) hand controls for braking and accelerating. By doing this, limitations and special needs of that group of drivers could be identified, and constitute a base for a more group general problem oriented design process for car MMI. An uncritical introduction of adaptations might even enhance the number of people not able to drive independently, while a pronounced problem oriented approach might benefit the overall introduction of adaptations. In a more long termed perspective, the goal should of course be to build standard cars "adapted" to larger user groups, including certain groups of DSN. A good car design for DSN can also be a good design for all drivers.
Method
åtlbiégtä
Fifty-two subjects, 26 tetraplegic and 26 able-bodied persons, participated in the study. None of the subjects had any experience of driving in a driving simulator. The tetraplegics had no ability to use their legs and feet, had impaired ability to use their arms and hands, and had trunk instability due to an injured spine at neck level (C4-C7). They were all dependant on a wheel chair for their mobility. The 24 male and 2 female tetraplegics formed the experimental group. (The described injury is a typical male injury. Thus the gender proportions re ect the real situation that only 10% of the injured
are females.) The tetraplegics were between 22 and 60 years old (mean 37.4 years).
They had had their driving licence for 4 to 40 years (mean 17.8 years), and drive 10000
to 45000 km, each year (mean 18690 km). Half the group used a single lever hand
control (AMU/K'avlinge, Sweden), while the other half used a dual lever hand control (Handikappinstitutet, Sweden). All tetraplegics were experienced drivers with their respective hand controls for accelerator and brake. The control group consisted of 26 able bodied subjects and was matched to the experimental group concerning gender (24 males and 2 females), age (24 to 56 years, mean 37.4 years), driving experience (driving licence 5 to 36 years, mean 18.5 years), and distance driven per year (10000 to 45000 km, mean 18710 km). These subjects used the car's original foot pedals for braking and accelerating.
Driving simulath
The advanced driving simulator at VTI (Nilsson, 1989; Nordmark, 1990) was used in
the study. It has a moving base system, a wide angle visual system, a vibrationgenerating system, a sound system, and a temperatureregulating system, which are controlled to interact in a way that gives the driver an impression which is very much like real driving. Especially, the time delay introduced in the simulator is short (40 ms), which is very important when focusing on the control and manoeuvring levels of driving. The car body used in the simulator was the front half of a Saab 9000 with automatic gearbox. The noise, infrasound and vibration levels inside the car corresponded to those of a modern passenger car. The air temperature could be adjusted according to the subjects' preferences, because many DSN prefer a warm climate. The car body is positioned 2 metres above oor level. To make it accessible for the DSN, a wheel chair lift was installed and the platform outside the car body was extended. No other adaptations were done for entering and leaving the car.
Car control adaptations
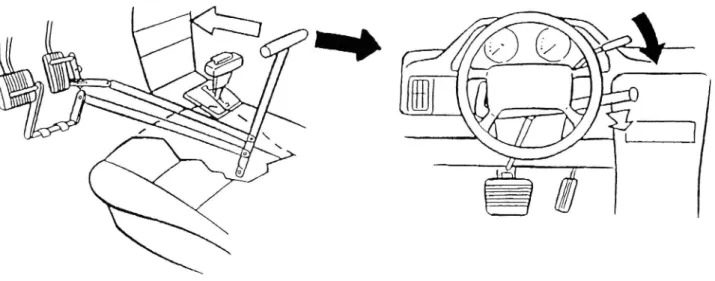
Two types of hand controlled adaptations for accelerating and braking were installed in the simulator's car body and used by the tetraplegic subjects. One hand control (made by AMU/K avlinge Sweden) has a single lever attached to the oor between the front seats. The driver brakes by pushing the lever, and accelerates by pulling the lever (Figure la). The other hand control (made by Handikappinstitutet Sweden) has two levers placed on the steering column. The lever for braking is pushed by the driver, and the lever for accelerating is moved radially by the driver (Figure lb). Two types of steering knobs could be optionally installed if the subject was used to such a device and wanted it.
The brakes were adapted if a subject couldn't exert the force needed to lock the brakes (380 N). If "comfortable" braking resulted in a force greater than 75% of the subject's Page 4
maximum force (< 380 N), then the brakes were adapted so the exerting maximum force corresponded to 380 N. If "comfortable" braking instead resulted in a force less than 75% of the subject's maximum force (< 380 N), then the brakes were adapted so the "comfortable" level corresponded to 75% of maximum force, and the maximum force was scaled to correspond to 380 N. If needed, based on a subject's normal situation, the assisted steering could be augmented in one step (half the force required).
\\\\ .
is...
I,Figure l The two hand controls used in the study. Empty arrows show how to perform braking, and lled arrows show how to accelerate.
a) The single lever control from AMU/K'avlinge b) The dual lever control from Handikappinstitutet Driving task
The subjects drove on a two-lane, 9 m wide asphalt road (high friction). The weather condition was slightly cloudy with a sight distance of approximately 400 m. The test route consisted of a mixture of difficult and easy (more or less curvy) sections. It was 80 km long and divided in two halves. Ninety-six oncoming cars (48 in each half route) appeared along the route (randomly), with the purpose of increasing workload and
realism. Also, 24 cars (12 in each half route) were parked along the route, for the driver
to pass. In 4 of these cases, oncoming cars were controlled to be met 40 m before the overtaking. The distance from the left side of the parked car to the middle of the road was 3 m. Four additional cars were parked at certain route positions. When the subject's car was 100 m behind it, the parked car activated the left direction indicator, and at 70 m
it started to move laterally (speed 0.5 m/s for 4 s). After these 4 seconds the direction
indicator was deactivated and the braking lights were lit. When the merging car came to a stop, the distance from its left side to the middle of the road was 1 m. All the merging situations included an oncoming car, whose speed was controlled so the meeting point occurred 40 m before the overtaking. This situation was created in order to force the subjects to make an evasive manoeuvre. To simulate an unexpected traffic event requiring a driver's reaction, a visual stimulus (red or yellow square) was presented on the screen, peripherally in the visual field on the left side of the road. The subjects' task was to brake as fast as possible when red squares were presented (4 times), and to do Page 5
nothing when yellow squares were presented (4 times). All subjects drove the same * route and were exposed to the same situations and events.
Measures
Speed was recorded with 2 Hz. The lateral position was measured in relation to a zero-position (defined as the zero-position where the centre line of the road coincides with the centre line through the driver's body) and recorded with 2 Hz. The standard deviation of the lateral position was used as a measure of the subjects' ability to steer (control) the car. Brake reaction time was calculated as the time elapsing from the presentation of a visual stimulus until the brake (foot or hand controlled) was pressed with a force greater than or equal to 0.05 N. The resolution was 20 ms. If there was no response within 5
seconds, the visual stimulus was turned off. The Task Load Index, NASA TLX, (Hart and Staveland, 1988) was used to assess over all workload. The subjects estimated the
six workload factors mental demand, physical demand, time pressure, performance, effort and frustration level on continuos scales ranging from very low to very high (0 -100). The staticforce the subjects could exert and keep on the brake for 20 seconds was
used to assess endurance. The force was recorded with 2 Hz, and means were calculated
for five force measurements before driving the practise route, and for five force measurements after driving the test route. Only the steady state (or declining) phase of the measurement was used (5 - 20 sec).The subjects rested 5 seconds between measurements. Questionnaires were used to gain knowledge about subject related background variables, and experience during the experiment. The tetraplegics also answered questions related to their disabilities and car adaptations.
Procedure
First the subjects had to ll in questionnaires about background variables, disability and adaptation aspects. Then they were given a written instruction describing the experimental task. The subjects were instructed to drive the simulator in the way they
would normally drive their own car, on a road with a speed limit of 90 km/h, under
comparable conditions. They were asked to avoid "playing" with the simulator, and told that they should first drive a practise route (15 km) to get familiarised with the simulator and for the various tasks and situations (red and yellow squares, parked cars, oncoming cars, merging cars) to be demonstrated. The subjects were instructed to brake as fast as possible when the red squares appeared and to ignore the yellow squares. During the instructions the subjects could ask questions and discuss with the experimental leader. The subjects entered the simulator, and force measures were taken before driving the practise route. Then a short brake was included, when the subjects were offered refreshments. After completion of the test route drive, the subjects rated their workload using NASA-TLX, and answered questionnaires regarding their experience during the experiment. Finally they were thanked for their participation and paid 250 SEK. The running of a subject took 2 - 2.5 hours in total.
Results
Speed
The mean speed over the total test route (80 km) was calculated for each subject, and
group means were created. The mean speed for the tetraplegics was 91.3 km/h, while the controls drove with an average speed of 88.4 km/h. A one-way ANOVA showed that the difference between groups was not significant. For the tetraplegic subgroups, driving with single and dual hand controls respectively, the mean speeds were 93.4 km/h (single lever control) and 89.2 km/h (dual lever control). The difference again was not significant. The variation in speed did not vary between any of the groups, neither
when it was analysed over the total test route (80 km) or over the two halves (2x40 km)
separately. Lateral position
The mean lateral position for all straight sections of the route was calculated for each subject. One-way ANOVAs did not show any significant differences, neither between tetraplegics and controls, nor between the two subgroups of tetraplegics, driving with different types of hand controls.
Variation in lateral position
The mean variation in lateral position was calculated over all straight sections of the route for each subject. There was no significant difference in position variation between the tetraplegic group (SD=.43 m) and the control group (SD=.47 m). But the variation of lateral position over the straight sections differed significantly between the two
tetraplegic subgroups (one way ANOVA [F(l,24)=5.30, p=.0303]. The subjects
driving with a dual lever control varied their lateral position more (SD=.47 m) than the subjects driving with a single lever control (SD=.40 m). The mean variation in lateral position for each subject was also calculated during responding (braking) to the four red square presentations. Means were calculated both for 0 to 100 metres and for 0 to 200 metres after the stimuli. For both distances after stimuli presentation, no significant differences in lateral position variation occurred when braking, neither between tetraplegic and control groups, nor between the two tetraplegic subgroups.
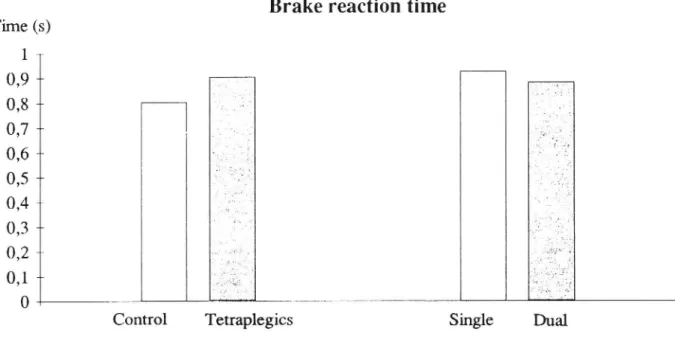
Brake reaction time
The results of the choice reaction task, braking for red squares and ignoring yellow squares, are shown in Figure 2. The mean brake reaction time for the four red square presentations was calculated for each subject. The mean reaction time for the group of tetraplegics was 0.90 s. For the control group it was 0.80 s. The difference was
significant (one way ANOVA, [F(1,50)=6.53, p=.0137]), showing that tetraplegics
driving with hand controls have a longer brake reaction time compared to able bodied drivers using foot pedals. The two subgroups of tetraplegics did not differ significantly concerning brake reaction time. Their reaction times were 0.88 s (single lever control)
and 0.93 s (dual lever control), respectively. Workload
The six workload factors of NASA-TLX were analysed and the only significant difference between the tetraplegic and control groups was found for time pressure
(one-way ANOVA [F(1,50=8.42, p=.0055]). The tetraplegics experienced a heavier time
pressure compared to the controls. None of the workload factors mental demand, physical demand, time pressure, performance, effort and frustration level resulted in a rating difference between the two subgroups of tetraplegics, using different types of hand controls. The answers to the question "Do you think it was tiring to brake and accelerate?" was also used to assess workload. The subjects indicated their answers on a rating scale ranging from 1 for "very tiring" to 7 for "not at all tiring". A one-way ANOVA showed a significant difference between the mean rating of 5.77 for the tetraplegic group and the mean rating of 6.81 for the control group [F(1,50)=9.65, p=.00312]. The tetraplegic subjects thought it was physically more tiring to brake and accelerate compared to the able-bodied subjects. Also between the two subgroups of tetraplegics a difference appeared in the answers to the question cited above (one-way ANOVA,[F(1,24)=5.32, p=.0299]). The tetraplegic subjects using the single lever hand control thought it was physically more tiring to brake and accelerate (mean rating 5.08 on the seven pointed scale) compared to the tetraplegic subjects using the dual lever hand control (mean rating 6.46 on the seven pointed scale).
Brake reaction time
Time (s)
0,9 4
0,8 +
0,7
0,6
0,5 +
0,4
0,3 +
0,2
0,1
Control Tetraplegics Single Dual
Figure 2 Brake reaction times (group means) on the choice reaction task, braking for red squares, ignoring yellow squares. The difference between tetraplegics and controls is significant (p<0.05).
Static force
Five static force measurements were taken before and ve static force measurements were taken after the driving task. The ratio mean force after/mean force before was used as a measure of local fatigue. The tetraplegic subjects served as their own control. The able bodied subjects could not be their control because they used their legs for braking. Considering all the tetraplegics, there was no significant difference in mean static force
before (458 N) and after (426 N) driving. The ratio of mean forces was .97 for the
tetraplegics using the single lever control and .92 for the tetraplegics using the dual lever control. The difference was not signi cant.
Discussion
Driving performance of tetraplegic drivers using hand controls for braking and accelerating has been evaluated, mainly from safety point of view. It is very important
that such an evaluation is related to the driving task, and that relevant measures are used
(Verwey, 1992). In this study the driving task included speed control, road following, interacting with other road users, and reacting to unexpected events. Performance, workload and endurance were used to assess driver behaviour and condition. The study was performed in a driving simulator for high controllability purposes. As no absolute norm exists for safe driving, able bodied people driving a conventionally equipped car
(in the simulator) were used as reference.
From a safety point of view, physically impaired drivers in adapted cars have to perform the driving task equally good as able-bodied drivers in standard cars. The difference may be that DSN probably are closer to the limit of their abilities. Therefore the demands on good design become more explicit for the DSN, and pitfalls of adaptation solutions may result in more severe consequences .
The basic driving tasks speed choice and road following did not result in any differences between tetraplegic and able-bodied drivers. The type of hand control had no in uence either. Thus the overall driving behaviour was similar.
Considering the ability to react quickly to unexpected events, the tetraplegics reacted slower (.90 s) than the able bodied drivers (0.80 s). Whether the prolongation originates from the impairment or from the design of the implemented adaptations has to be further investigated. It could be expected that the reaction time should be shorter when the single lever control was used (the hand is already on the control). As this was not
the case (similar reaction times for the two hand controls), it seems as if the longer
reaction time for tetraplegics compared to able-bodied can have physiological rather than adaptation related reasons.
Compared to driving with foot pedals, driving with hand controls does not seem to have any implications to the ability to steer safely. It was, however, expected that driving with the single lever control could have some impact on the steering ability, because the control location implies "one hand steering". Instead the tetraplegics using the dual lever control staggered most (.47 m compared to .40 m for single lever control users, on straight road sections). One explanation to this result can be an interaction between steering and speed control. In the dual lever adaptation, the speed control lever is placed close to the steering wheel, and the driver keeps his/her hands on the wheel while controlling the speed. (Speed was not analysed for the straight sections separately.). The workload assessment includes both mental and physical aspects. Tetraplegic drivers experienced a higher overall time pressure, and a higher degree of tiredness from braking and accelerating, compared to the able-bodied drivers. Among the tetraplegics, drivers using the single lever control indicated a higher degree of tiredness, which is probably caused by the position of the control between the front seats, giving no support for the hand and arm handling it, and leading to uncomfortable movements. The results from the static force measurements do not show any relevant decrease in the ability to exert necessary forces. Thus, the experienced tiredness can not be explained by a physical local fatigue. Speed variation as an indicator of high workload does not vary between the studied driver groups.
Conclusions
In comparison to able-bodied drivers using conventional pedals, the tetraplegic drivers using hand controls for braking and accelerating
- show the same overall driving behaviour.
- react somewhat slower to unexpected traf c events. - do not rate their workload level higher.
- feel more tired from braking and accelerating, an experience which can not be explained by physical local fatigue.
If the two subgroups of tetraplegics, using a single lever control and a dual lever control respectively, are looked upon separately
- they show the same overall driving behaviour.
- the type of control does not in uence their ability to react quickly to unexpected events.
- the drivers using the dual lever control vary their lateral position (stagger) more. - they rate the workload level to be equally high.
- the drivers using the single lever control feel more tired from braking and accelerating. The difference in experienced level of tiredness can not be explained by measured local fatigue.
Acknowledgement
This study was performed by VTI as part of the DRIVE II Project V2032 (TELAID). The work was financially supported by the Swedish Transport Research Board (TFB) and VTI.
References
Hart, S.G., Staveland, L.E. (1988): Development of NASA-TLX (Task Load Index):
Results of Empirical and Theoretical Research. Ref in P.A. Hancock and N. Meshkati
(Eds.), HUMAN MENTAL WORKLOAD, Elsevier Science Publishers B.V. (North-Holland).
Naniopoulos, A. (Ed.) (1992): Critical issues and survey of past R&D work for DSN.
DRIVE H Project V2032 (TELAID), Deliverable No. 1, May 1992.
Nicolle, C., Ross, T., Richardson, S. (Eds) (1992): Identification and grouping of requirements for drivers with special needs. DRIVE II Project V2032 (TELAID),
Deliverable No. 3, September 1992.
Nilsson, L. (1989): The VTI Driving Simulator - Description of a Research Tool.
DRIVE Project V1017 (BERTIE), Report No. 24 (VTIs artryck 150). '
Nordmark, S. (1990): The VTI Driving Simulator - Trends and Experiences.
Proceedings of Road Safety and Traffic Environment in Europe, Gothenburg, Sweden, September 26-28 1990.
Verwey, W.B. (1992): On evaluating vehicle adaptations for disabled drivers. Report IZF 1992 C-36, TNO Institute for Perception, Soesterberg, the Netherlands.