TMT 2013:45
Characterization of a Cascade Gear Box
for a Wave Energy Converter
DAVID ALBADY
CHARLES ÖHMAN
Examensarbete inom
MASKINTEKNIK
Innovation och design
Högskoleingenjör, 15 hp
Södertälje, Sverige 2013
Characterization of a Cascade Gear Box for
a Wave Energy Converter
av
David Albady
Charles Öhman
Examensarbete TMT 2013:45
KTH Industriell teknik och management
Tillämpad maskinteknik
Mariekällgatan 3, 151 81 Södertälje
Examensarbete
TMT
2013:45
Utveckling av transmission och
testrigg till ett vågkraftverk
David
Albady
Charles Öhman
Godkänt2013-06-28
Examinator KTHOla Narbrink
Handledare KTHStefan Björklund
UppdragsgivareCorPower Ocean
Företagskontakt/handledarePatrik Möller
Sammanfattning
Projektet behandlar vidareutveckling och provning av en prototyp av en växellåda till en Wave Energy Converter, ett vågkraftverk med tillhörande testrigg. Företaget CorPower Ocean har utvecklat en idé att utvinna energi ur havsvågor genom att låta en boj följa havsvågornas rörelser. Bojen drar i sin tur i en kuggstång genom en växellåda som omvandlar vertikal rörelse till roterande rörelse som sedan driver två generatorer. Växellådan innehåller fyra kugghjulsaxlar som alla tar upp kraft från kuggstångens rörelse. Kugghjulen samverkar på ett unikt sätt och alla fyra axlar bidrar till att förse generatorn med kraft. För att tillse att det sker jämn kraftfördelning mellan dessa axlar och att förutsatta tillvekningsfel och spel mellan kuggar eliminerades, skall torsion i axlarna tillåtas när påfrestningarna anbringas. I det långa loppet innebär det att alla kugghjulen tar sin del av lasten vilket leder till att växellådans livslängd förlängs. Den föregående fastsättningen av kugghjul på axel tillät inte mycket torsion då torsionslängden var kort och skapade därför en stel struktur. Projektet gick ut på att hitta ett sätt att skapa längre torsionsaxel med bibehållen funktion. För att lösa detta var ett antal komponenter i växellådan tvungna att vidareutvecklas. Samtidigt utvecklades ett sätt att mäta torsionen i axlarna för att på ett praktiskt sätt säkerställa en jämnare lastfördelning med de nya lösningarna..
Parallellt med konceptgenereringen utarbetades en simulering som skulle försöka förutspå det väntade resultatet samt vägleda valet av nödvändig torsionslängd. Simuleringen skulle senare användas för att uppdatera den matematiska modellen för kraftfördelningsberäkningar.
Prototypen satt inspänd i en testrigg som även denna skulle komma att behöva vidareutvecklas. En domkraft var infäst tillsammans med prototypen i två långa fyrkantsrör. Domkraften skulle representera havsvågens dragande kraftpåfrestning på växellådan. Samtliga tester skulle emellertid komma att utföras endast i form av statisk belastning.
Förutom att förlänga torsionslängden på axeln, behövdes även en lösning för infästning av kugghjul på axel tas fram. Ett antal koncept utvecklades och utvärderades med utvärderingsmatriser och uträkningar tills ett koncept valdes som byggde på idén att använda en hubb med högt skaft. Vald lösning kan observeras på s. 17. Hubben låses till axeln genom att pressa in en konring mellan hubb och axel.
Nästa punkt som skulle vidareutvecklas var fastlåsning av utgående axel, dvs. den som slutligen driver generatorn. Denna skulle låsas för att fungera som mothåll när domkraften drog i kuggstången. Här
prioriterades låg låsning av utgående axeln för att inte denna själv skulle bidra till torsion som skulle kunna ge missvisande värden vid mätningarna. Till denna komponent användes såväl nytillverkade delar som befintliga maskindelar t.ex. axelnavförband. (s. 14)
Förutom att konstruera och låta tillverka hub och låsning av utgående axel genomfördes en del
förstärkningsåtgärder på växellådan. Detta gjordes för att hållbarheten i konstruktionen kunde betvivlas. Bl.a. byttes domkraftshållarna ut och växellådan fick starkare infästning till fyrkansstängerna. Under testerna senare i projektet upptäcktes att det även var nödvändigt att tillverka stänger som skulle motverka böjning i riggen då domkraften spändes och drog hela växellådan mot sig (s. 38, Figure 56 - Test Rig with Support Rods ). Mätmetoden som togs fram för att mäta torsion i axlarna byggde på laserstrålar som indikatorer för att se axlarnas vridning. Strålarna projicerades på en vägg och markerades ut på ett mätpapper. Metoden gav stor noggrannhet då längden på indikatorerna kunde göras väldigt långa vilket i sin tur gav stora utslag till mätresultaten.
Tester genomfördes och eventuella problem löstes längs vägen, bl.a. släppte limförbandet som använts på utgånde axel för att fästa dess kugghjul till axeln. Denna blästrades och limmades om för att sedan fungera felfritt. Mätvärdena markerades och kvantifierades för att ge noggrannhet. Mätvärdena analyserades och jämfördes med simuleringarna för att visa sig vara väl jämförbara med varandra.
Slutsatser som drogs av provningarna: Det fanns tecken på att det förekom tillverknings- eller justeringsfel i konstruktionen dvs. det förekom spel mellan kugghjulen i växellådan. Det visade sig också att dessa fel eliminerades av torsionen i axlarna. (s. 45) Det var däremot tydligt att vald torsionslängd var överdriven. Två olika hubblängder provades dock hade det troligtvis räckt med en kort hubb och sedan den föregående fastsättningen för att ge en tydligare jämförelse mellan den nya lösningen och den gamla. Det fastsälldes också att det skedde mycket sättningar i konstruktionen efter att full last hade anbringats och sedan släppts. Det var flera olika delar i växellådan som rört sig under provningen av olika anledningar trots att allting var låst korrekt. Prototypens struktur var troligtvis inte lämpad för så höga laster. Man kunde däremot konstatera att kraftfördelning mellan axlarna skedde väldigt tidigt under låga påfrestningar.
Nyckelord
Bachelor of Science Thesis
TMT 2013:45
Characterization of a Cascade Gear Box for a
Wave Energy Converter
David
Albady
Charles Öhman
Approved2013-06-28
Examiner KTHOla Narbrink
Supervisor KTHStefan Björklund
CommissionerCorPower Ocean
Contact person at company
Patrik Möller
Abstract
The project focuses on the development and testing of a prototype gear box for a Wave Energy Converter; an ocean wave power plant with associated test rig. The client company, CorPower Ocean AB, has developed an idea of extracting energy from ocean waves by letting a buoy follow sea wave movement. By allowing the buoy to pull a rack through a gearbox that converts the vertical force to rotational force which operates two generators. The gear box features four gear shafts which all receive rotational power from the rack motion. The gears work together in a unique way and all four shafts help to provide the generator with power. To ensure that there is uniform distribution of load throughout the transmission despite the assumed manufacturing errors and clearance between the teeth, torsion in the shafts help to distribute the force when stress is applied. Over time, this means that all the gears will take their share of the load which leads to a prolonged life of the gear box. The previous attachment of the gears on the shafts did not allow much torsion and created a rigid structure. The project assignment was to find a way to create and define a needed torsion length in the shaft while maintaining function. To overcome this, a number of components in the gear box had to be developed and also a way of measuring the torsion in the shafts.
Parallel with the development of the components, a simulation was created that would attempt to predict the expected results as well as guide the selection of necessary length of the torsion shaft. The simulation would later be used to support the mathematical model for load sharing calculations.
The prototype is fixated in a test rig that also needed further development. A hydraulic cylinder is attached along with the prototype in two long hollow beams. The hydraulic cylinder should simulate the sea wave pull force of the buoy which would apply stress on the gearbox.
Initially, the attachment of the gear on the shaft that simultaneously created a longer torsion shaft needed to be addressed. A number of concepts were developed and evaluated by using selection matrix; a concept was chosen which was based on the idea of using a hub with a tall neck. Selected solution can be observed on page 17. The hub is locked to the shaft by forcing a cone ring in between hub and shaft.
The next component that needed to be developed was the locking of the outgoing shaft, which ultimately drives the generator. This had to be locked in order to act as counter hold when the hydraulic cylinder pulled the rack. A low mounted locking of the outgoing shaft was prioritized so that it would not contribute to torsion which could give misleading measurement values. Both newly manufactured parts as well as existing machinery components such as shaft hub connection was used. (Page 14)
Furthermore some reinforcement of the gearbox was required. This was done to ensure that the strength of the construction would not be doubted. The mounts of the hydraulic cylinder was remade and the attachment
of the gearbox was strongly fixed to the beams. During the test another problem was discovered; it was necessary to manufacture support rods to prevent bending in the rig as the force from the hydraulic cylinder pulled the gear box towards it. (Page 38, Figure 56 - Test Rig with Support Rods )
The innovated measurement method used laser beams as indicators to show the shafts rotation. The laser beams were projected on a wall and marked out on a paper. The method allowed the length of the indicators to become very long thus giving a greater displacement and very fine accuracy.
The tests were carried out and any problems were solved along the way, including broken adhesive bond between gear and outgoing shaft component (page 22). The gear and shaft was sandblasted and reglued now fixated on the shaft flawlessly. The measurements were selected and quantified to provide accuracy. The measured values were analysed and compared with the simulations.
Conclusions drawn by the tests: There were indications that manufacturing- or alignment errors in the design existed, i.e. there were clearances between the gears in the gearbox. It was also found that these errors were eliminated by the torsion shafts (page 45); however, it was clear that the selected torsion length was excessive. Two different hub lengths were tested, but it had probably been enough with a short hub and then the previous attachment solution to provide a better comparison between the new solution and the old. It was also established that there was a lot of structural subsidence in the whole gear box after the full load was applied and then released. Various parts in the gearbox moved during the test for various reasons, even though everything was locked properly. The prototype structure was probably not suited for the high loads. One could however say that the load sharing between the shafts occurred very early during low stress.
Key-words
VII
Preface
This is the bachelor thesis report and the final part of the mechanical engineering program at the Royal Institute of Technology. This bachelor thesis is performed with the cooperation of CorPower Ocean AB.
To fully understand and satisfy all the information in this report, some previous knowledge on mechanics, strength of engineering materials and machine components is required.
Acknowledgment
A special thanks…
… To Stig Lundbäck and Patrik Möller at CorPower Ocean AB for exceptional support, push and ideas and for giving us the opportunity to contribute to this Wave Energy Converter. Also thanks to Stefan Björklund for pedagogical explanations and superb mentoring. Thomas Östlund in the workshop for taking time to show us how to use machines and tools and for holding us back when we got carried away. We would also like to thank Martin Öberg, Kenneth Duvefelt and Björn Möller at KTH for helping out with calibration of the hydraulic cylinder.
VIII
Nomenclature
Symbol Description
cyl Area of hydraulic cylinder
Gear width
Mean diameter of the nut
h Hole diameter
Shaft diameter
Gear diameters
steel Young’s modulus for steel
cyl Hydraulic cylinder force
Gear force
Shear modulus
Ip Polar moment of inertia in shafts
i Gear factor
v Section modulus of torsional rigidity
k Spring constant
Lengths on pinion shaft
Mi Moment of pinion shaft i
Mtot Total moment of all pinion shafts
Mv Moment of torque i Gear modulus Key length i Internal Pressure po Outside Pressure ri Internal Radius ro Outside Radius
cyl Radius of hydraulic cylinder
H Safety factor
p Tensile strength of the screw
s Shear force on shaft
Gear ratio
v Torsion constant
i Number of teeth on gears
αdisp Displacement angle
i Errors in manufacturing of gears and pinion
Torsional angle of twist 1
φ Torsional angle of twist 2
Shear stress
FMEA Failure Mode and Effect Analysis
IX
Contents
1 Introduction ... 1 1.1 Background ... 1 1.2 Aim ... 1 1.3 Limitations ... 1 1.4 Stakeholders ... 2 1.5 Methods ... 2 1.6 Requirements ... 21.6.1 Fixation of gears on shaft – pinion lock ... 2
1.6.2 Outgoing shaft locking ... 2
1.6.3 Attachment of hydraulic cylinder on rack ... 2
1.6.4 Selection and ordering of measuring device ... 3
1.7 Project Planning ... 3
1.7.1 Time Schedule ... 3
1.7.2 Risk Analysis ... 3
2 Present situation ... 7
2.1 The function of the WEC ... 7
2.2 Prototype & Test Rig ... 9
2.3 Previous design flaws ... 9
2.3.1 Fixation of gears on shaft – pinion lock ... 9
2.3.2 Outgoing shaft locking ... 9
2.3.3 Weak Fixture between Hydraulic Cylinder and Rack ... 10
2.3.4 Hydraulic Cylinder Fixture ... 11
2.3.5 Weak construction of Gear box frame structure ... 11
2.3.6 Previous torsion measurement method ... 11
3 Implementation ... 13
3.1 Load Sharing Model and Simulations ... 13
3.2 Dimensioning of shaft ... 13
3.2.1 Manufacturing errors and tolerances of the gears and rack ... 13
3.2.2 Simulations of the calculated dimensions of the shaft ... 13
3.2.3 Calculations of the Torsions in the Shafts ... 14
3.3 Shaft Hub Connections ... 15
X
3.4.1 Fixation of gears on shaft – pinion lock ... 16
3.4.1.1 Concept 1 – Shaft hub connection, further developed ... 16
3.4.1.2 Concept 2 - Splines ... 17
3.4.1.3 Concept 3 – Spline bushing ... 18
3.4.1.4 Method chosen ... 18
3.4.2 Outgoing shaft locking ... 19
3.4.2.1 Concept 1... 20
3.4.2.2 Concept 2... 20
3.4.2.3 Calculations for locking of the outgoing shaft ... 21
3.4.2.4 Method Chosen ... 22
3.4.2.5 Adhesive joint ... 23
3.4.3 Fixture between rack and Hydraulic Cylinder ... 25
3.4.4 Reinforcement of gear box frame structure ... 26
3.4.5 Hydraulic cylinder fixture ... 27
3.4.6 Torsion measurement method... 29
3.4.6.1 Alternative measurement methods ... 29
3.4.6.1.1 Laser Pointer Method ... 30
3.4.6.1.2 Strain Gauge ... 30
3.4.6.1.3 Steel pointers ... 31
3.4.6.2 Method chosen ... 31
4 Testing Phase ... 35
4.1 Assembling the Gear Box... 35
4.1.1 Assembly obstacles ... 35
4.2 Calibration of hydraulic cylinder... 36
4.3 Tests of torsion ... 38
4.4 Errors in the design ... 39
4.4.1 Support Rods ... 40
4.5 Slip in the adhesive joint ... 41
4.6 Measurement procedure ... 41
4.7 Table of results ... 43
4.8 Measuring the distances ... 44
5 Analysis and Results ... 47
5.1 Error ratio ... 47
XI
5.3 Load Distribution between the Pinions ... 48
5.3.1 Indications of errors in the manufacturing of the components ... 48
5.4 Comparing simulations to measured results for maximum load ... 49
6 Discussion of error sources ... 51
7 Recommendations ... 53
7.1 Torsion shaft ... 53
7.2 Choosing torsion shaft ... 53
8 Miscellaneous Conclusions ... 55
9. Bibliography ... 57
10. Table of Captions ... 57
Appendix A: Measurement results long shaft side A
Appendix B: Measurement results short shaft side B
Appendix C: Measurement results long shaft side B
Appendix D: Measurement results short shaft side A
Appendix E: Measurement result tables
Appendix F: Drawings
Appendix G: Loctite Technical Data Sheet
Appendix H: Bolts & Screws Technical Properties
Appendix I: FEM- Outgoing Shaft Locking
1
1 Introduction
1.1 Background
This is a bachelor thesis in the field of mechanical engineering and economics, 15 hp. The
company, CorPower Ocean AB, is a development company within the field of ocean wave energy. CorPower Ocean AB was founded by Stig Lundbäck MD who during his research of the human heart also came up with a way to convert ocean wave energy into electricity. CorPower Ocean AB is currently in a development stage with hope of soon be able to manufacture a functioning prototype to be tested in realistic surroundings. The bachelor thesis resumes a previously finished thesis whose objective was to develop a test rig for the prototype. This test rig, along with certain components on the prototype needs further development.
The purpose of the thesis is to help CorPower Ocean AB in developing the test rig for a Wave Energy Converter. The test rig will be used to obtain measurement readings that will form the basis for further development of the product.
1.2 Aim
The aim of the project is:
- Design gear fixation on shaft to endure resulting force when prototype is subjected to a maximum of 20 kN pulling force.
- Design locking device for output shaft to minimize slip.
- Design connection device between hydraulic cylinder and rack to minimize potential measurement errors.
- Present a measuring method to use when testing the prototype for torsion in the shafts. - Present a quantified list of potential measurement errors.
- Perform tests of torsion on shaft. Measure 3 rack positions on both sides when subjected to the maximum load of 20 kN.
1.3 Limitations
- We will not embark on any advanced calculations of load sharing or gear geometry; instead we will regard the previous work performed by the master students.
- The components constructed during this thesis will be constructed only to be used for tests of the prototype.
- Tests are to be carried out for static testing only.
- Budget costs – consideration shall be taken not to exceed realistic costs, however documentation or analysis of budget will not be presented in the project report. - In case we cannot manufacture components ourselves, we will try to use the school
equipment and workshop technician before outsourcing.
2
1.4 Stakeholders
The following persons have interest in this thesis work.
1.5 Methods
The project begins with a study of the previous thesis report carried out by master students from KTH. The previous thesis involved background studies and development of a prototype and test rig for testing load sharing characteristics. Since we lack skill in Solid Edge CAD-program, we will have to seek information about this in literature and tutorials.
Use extensive planning daily and set up goals of what we need to accomplish that day to meet important deadlines. Continuously work and alter the time schedule to make sure we meet deadlines.
Work will proceed on this prototype with reconstructing components to optimize the test rig and retrieve valid test data for further development of load sharing model. Brainstorming and concept generation will be used when creating ideas to the different objectives. CAD programs, such as Solid Edge, will be used to develop and analyse components. The components will be either manufactured by ourselves, the school technician or outsourced to other supplier.
1.6 Requirements
1.6.1 Fixation of gears on shaft – pinion lock
Fixation shall hold for the maximum test load of 0-20kN. Minimize slip between shaft and pinion fixation.
1.6.2 Outgoing shaft locking
Shall be dimensioned and designed to withstand the torque arising from the 20kN force, which the rack is subjected to, with no slip.
1.6.3 Attachment of hydraulic cylinder on rack
The attachment shall be designed to withstand a force of 20kN.
Shall preferably be designed to minimize resultant force in wrong directions.
Stakeholders Role Contact information David Albady Project Manager albady@kth.se
Charles Öhman Project Manager charleso@kth.se
Patrik Möller CEO CorPower Ocean AB patrik.moller@corpowerocean.com
Stig Lundbäck Founder of CorPower Ocean AB stig.lundback@inovacor.com
Stefan Björlund Mentor, KTH stefan@md.kth.se
Ola Narbrink Examiner, KTH narbrink@kth.se
3
1.6.4 Selection and ordering of measuring device
Shall show measurement accuracy of 0.1mm on a 0.6m indicator shaft. Measuring device is a subject of cost.
1.7 Project Planning
1.7.1 Time Schedule
The project shall be held within the framework of 800 hours. The quality of the project team's scheduling will be secured through frequent updates to the schedule and timesheets to discover and plan out major errors. Schedule annexed to the project plan.
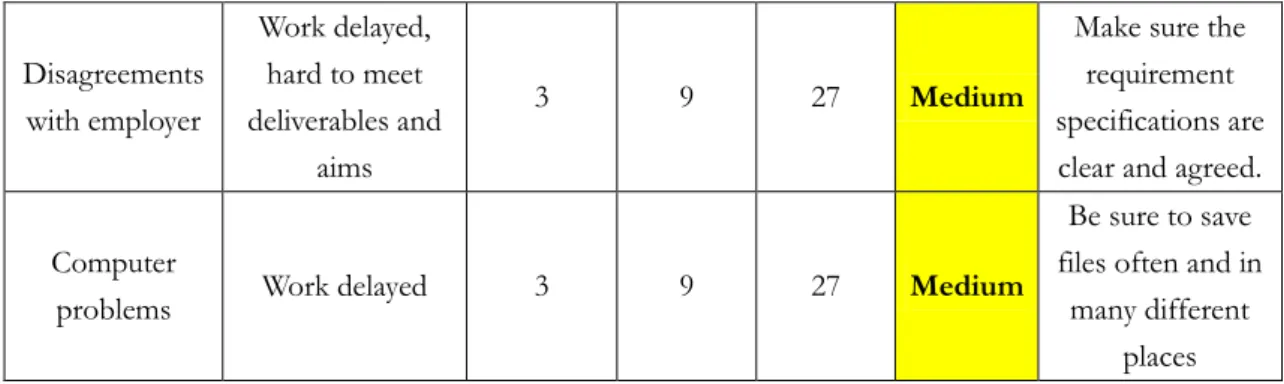
1.7.2 Risk Analysis
The risk analysis method used in this project is based on a method used in FMECA. A part of FMECA is Risk Priority Number (RPN) and is used to analyse the criticality. (Francesco
Zammori 2011). RPN uses three variables, Severity, Occurrence and Detection. The matrix used in this report only covers two of the categories that are relevant to this project. A risk that might occur is defined. The risk is given an occurrence rating and a rating severity. The ratings that are given are defined with a number from one to ten, one being the lowest risk and ten being the highest risk. The two factors are multiplied and give the risk priority number. By looking at the Table 3, the RPN is translatable into a risk level.
Deliverables
Date
Responsible
Halvtidsmöte v.5 David
Boka presentation v.7 Charlie
Inlämning preliminärrapport v.9 David
Presentation v.9 eller v.10 Charlie & David
Inlämning slutgiltig rapport v.11 David &Charlie
Table 2 - Deliverables 1
RPN
Risk Level
1-24
Low
25-40
Medium
41-100
High
4
Risk Event Effects
Occurre nce Rating Severity rating Risk priority number (RPN) Risk Level Mitigation Strategy Absentees from the group meetings Acts as an inhibitor to the completion of the project 3 8 24 Low Ensure that effective communication is employed prior to the group meeting Work incomplete by
the due date
Runs the risk of failing to submit work on time 6 10 60 High Follow a well-structured timetable and ensure constant communication is kept Incorrect referencing
Low mark on the
report 4 7 28
Mediu m
Ensure that all group members are familiar with the Harvard Referencing
system
Plagiarism No mark on
report 1 10 10 Low
Make sure that all members know the rules
of plagiarism Ordered manufactured parts comes back incorrect Reorder delays
test start 2 9 18 Low
Double check with 3:rd person before order Ordered or manufactured part is delayed Delays or prevents test start 7 9 63 High Order as early as possible and follow up on order Group member gets ill That persons work load has to
be redirected to the rest of the
group
3 9 27 Mediu
m
Make sure that the work from the sick group member gets
spread out equally within
5
Table 4 – Risk Matrix Disagreements with employer Work delayed, hard to meet deliverables and aims 3 9 27 Medium
Make sure the requirement specifications are clear and agreed. Computer
problems Work delayed 3 9 27 Medium
Be sure to save files often and in
many different places
7
2 Present situation
The Wave Energy Converter (hereafter referred to as the WEC) by CorPower Ocean AB has the past four years worked on a design that differs from current competitors. The WEC can control when to release the buoy and therefore gets a more even power stroke to achieve as effective energy output as possible. The current prototype is a gear box model only that has to be modified in order to perform the tests which are needed to modify the mathematical load sharing model. The company is working on a fully functional WEC which is supposed to be tested in water by the end of 2013.
2.1 The function of the WEC
The WEC functions as following: The WEC machinery housing is attached to the ocean bottom through a wire and “hover” at a certain depth. It is also be attached to a buoy at the surface; this buoy follows the shapes of the ocean waves which create a pulling force that the WEC takes advantage of.
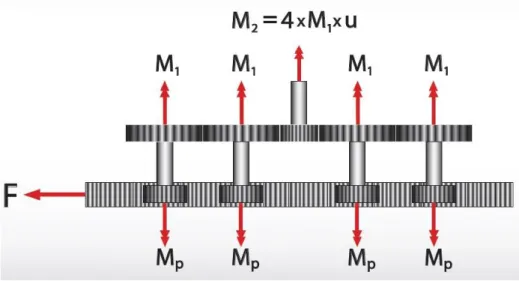
The gear box converts axial force into rotational torque. When the buoy pulls the wire upwards a rack is pulled through the gearbox. The force is distributed over four pinions, two on each side of the rack. Each pinion is fixed on the middle of a shaft. On each shaft there are two larger gears fixed, one on either side. The larger gears collaborate with each other in pairs, this way the rack provides force to four shafts all working together eventually driving one outgoing shaft per side of the gearbox.
The outgoing shaft drives a generator. The two outgoing shafts are symmetrically displaced, meaning they are driven by two shafts each but not the same. E.g. the upper outgoing shaft is driven by shaft 1 & 3, the outgoing shaft on corresponding side is driven by shaft 2 & 4.
Figure 2 - Pinions and Rack with Gear 2 Figure 1 - Wave Energy Converter
8
The gear ratio is simply defined by Figure 4 and will furthermore be used for calculations in the report. In order to hold everything together, this prototype holds a structure consisting of four plates that function as floors; these along with two steering plates for the rack on each side, are fastened between the pinions and gears and held together by pin bolts. This is illustrated in Figure 5
- Gear box Floor and Figure 6 – The entire Structure of the Gear box.
Figure 4 - Gear box Ratio
Figure 5 - Gear box Floor Plates
9
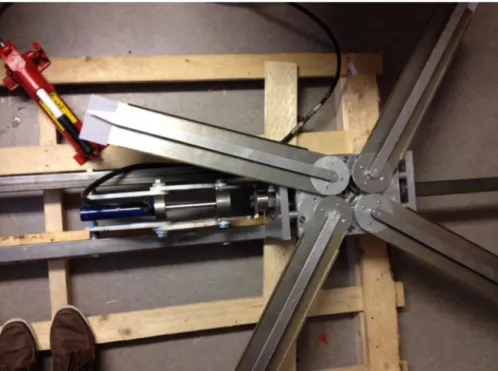
2.2 Prototype & Test Rig
The prototype was mounted upon two hollow beams 40x40x2500 mm as illustrated in Figure 7. The prototype is bolted on to the beams with the rack parallel to the beams. The rack is attached to a hydraulic cylinder which was used to accumulate the forces needed for the test. The cylinder was of the brand Biltema and claims to hold for 2000kg, the cylinder was connected through hydraulic hoses to a jack, also from Biltema, which claims to hold for 4000kg. The hydraulic hoses lack any specifications, thus capabilities are unknown. The hydraulic cylinder was held by two link arms and attached to the rack. It pulls the rack to simulate the force generated by the buoy. There were several holes made in the beams making it possible to move the hydraulic cylinder in order to test different rack positions.
2.3 Previous design flaws
The previous design contained flaws of parts which were assumed to lead to multiple error sources. These errors were factors that occurred from attachments, faulty dimensioning and joints. Before the project started an inspection was done to establish the weak components. Except the parts already listed in the project description more areas and components were and would become, in need of redesign. Many of the designs were last minute solutions due to time constraints in the previous project. According to calculations and estimations, the following parts could give measurement results misleading values.
2.3.1 Fixation of gears on shaft – pinion lock
The main assignment of this project was the attachment of gears on shafts. The solution had to lead to extended torsion shafts (more on this in chapter 3.4.1). The gears were previously attached to the shafts using shaft hub connections. This fixation method worked fine for non-permanent
structures due to easy assembly/disassembly properties. The shaft hub connection is strong enough for the moment the gears will be subjected to, more on the shaft hub connection in chapter 3.3.
2.3.2 Outgoing shaft locking
The outgoing shaft locking shall be dimensioned and designed to withstand the torque arising from the 20 kN force, which the rack is subjected to, with virtually no slip. The previous design was a last
10
minute solution that most likely would not withstand the torque that it would be subjected to. A structure was mounted to the bottom plate and two screws squeezed the outgoing shaft radially (Figure 8 - Old Outgoing Shaft Locking).
2.3.3 Weak Fixture between Hydraulic Cylinder and Rack
The U-shaped fixture between the cylinder and rack was believed to be considerably weak constructed. It gave the impression of that it might bend or that the welds might break when exposed to heavy load. But even though the previous design seemed weak the weakness was uncertain, thus it had been decided that it needed reinforcement.
Figure 8 - Old Outgoing Shaft Locking
11
2.3.4 Hydraulic Cylinder Fixture
The hydraulic cylinder was attached to the beams using two link arms on each side of the cylinder, four in total. These arms were bolted to the beams using M14 bolts and bushings to achieve correct placement. The holes in the beams in which the fixtures were bolted through, were drilled in order to achieve correct angle thus reaching the correct height for the hydraulic cylinder. The structure could likely be used but needed improvement since the spacers used would cause unnecessary bending and shearing in the bolts.
2.3.5 Weak construction of Gear box frame structure
The prototype was bolted to the beams through the floor of the structure with the aid of stud bolts. These also helped holding the gear box together. When the rack was pulled towards the hydraulic cylinder, moment arose and caused shear stress in between the floor plates. The result was, when the gear box was subjected to high pulling force, the plates that function as frame floors for the gear box would be displaced and the under dimensioned stud bolts holding them together would be bent. The stud bolts found in the design was for some reason thinner than the holes they went through. This was probably a last minute solution from the previous project due to lack of time and proper material. Unmounted stud bolts in correct diameter accompanied the prototype; however these were shorter and could not be used for fixing the gear box onto the beams, hence the last minute solution.
2.3.6 Previous torsion measurement method
The previous method for testing torsion in the shaft most importantly required a hollow shaft. Since the new shaft was designed to be a solid shaft, this method was no longer possible to use. The
Figure 10 - Fixture of Hydraulic Cylinder on Beams
12
basics of how the torsion in the shaft was measured were that there was a thin rod inserted all the way through a larger hollow shaft which was mounted to one end of the rod. A pointer was attached to the end of the rod; the other end of the rod was attached to the other end of the shaft and was in this not subjected to any torque. On the hollow shaft a rectangular metal sheet was fixed with a measuring paper attached to it (Figure 12). This metal sheet would turn with the hollow shaft as the pinions were subjected to a force applied by the rack. As the torsion in the shaft started the metal sheet attached to it would turn with the same angle and would create a displacement in relation to the pointer. After this it was just a principle of Trigonometricfunctions.
Figure 13 - Old Measuring Method Figure 12 - Close up of Old Measuring Method
13
3
Implementation
3.1 Load Sharing Model and Simulations
Control calculations were performed on shaft hub connections on all the gears, the pinion and outgoing shaft. The values were used for the gears that were stated in the previous report. The shaft hub connection was a standard component from Mekanex AB and was obtained from their website. With the values obtained from the data sheet the shaft hub connection would surely hold well above the torque that would be achieved during the tests. Other components that were fixated with bolts were double checked in tables to make sure that the bolts were well fitted for their purpose. (Appendix H)
3.2 Dimensioning of shaft
The dimensioning of the shaft had several factors controlling the design. Due to the manufacturing uncertainty of the gears and rack it was important that the shaft would allow some torsion. The torsion would lead to a more evenly divided force distribution among all the gears throughout the gear box. In the same time it was important that the shaft was not too weak to sustain the torsional strain it would be subjected to, since the life span of the final product was desired to be at least 20 years. The strong correlations between the length, thickness and durability made the choice of a torsion shaft very vital. For the test rig the diameter was already set due to all the components such as gears and shaft hub connections that were customized to fit the existing width, 20 mm. This led to a design of the torsion shaft only with the possibility to make changes to its length.
3.2.1 Manufacturing errors and tolerances of the gears and rack
When a cogwheel or gear is manufactured a tolerance interval for the manufacturing errors are given so that the final product can function properly without any weaknesses. The more specific and narrow the tolerance interval is, the more expensive it is to manufacture due to the high accuracy requirements of the production machines. The previous report written on the WEC contains calculations of the manufacturing errors for the components that are used in the test rig. These tolerances were used for the calculations of the load sharing model. The calculations show a worst case scenario on the whole tolerance chain, which goes to 321 µm and a mean error which lays at 35 µm.
3.2.2 Simulations of the calculated dimensions of the shaft
A Matlab script was created to simulate the forces acting on the torsion shaft. The results were used as input for analysis and calculations for the design of the hub and also to decide a length of the torsion shaft. The simulation was based on incrementally moving the rack that corresponds to an increased force acting on the pinions. This results in a torque in the shaft and a torsional
displacement of the shaft. The calculations were based on a “Monte Carlo”-method which means that random numbers were used and the simulations were repeated many times. (Hammersley & Handscomb 1975) The numbers that were used were within the tolerances interval of the worst case scenario 321 µm. A normal distribution is used with a 3σ interval. The simulation was supposed to give theoretical data and information on how the distribution could look with different lengths of the torsion shaft. This would be used for the decision on the lengths of the hubs to be manufactured. Two graphs were in particularly interesting. One showing at what force the pinions
14
would start taking load and another one showing how the force distribution between the pinions looked like. The plots that were hoped to be achieved are displayed in Graph 1 - Load Sharing Graphs. Each colour represents one pinion shaft.
3.2.3 Calculations of the Torsions in the Shafts
Torsion of a shaft is determined as previously mentioned by both thickness and length but also by the material properties; this is described in a book of formulas for strength of engineering. (Lönnelid & Norberg 2010) The calculations were performed by using standard values for the material properties for heat treated alloy steel. The angle displacement of a torsion shaft is described as:
As seen in Equation 3 the torsion in the shaft is directly influenced by length. But when the equation is rewritten, , which describes a polar moment of inertia in the torsion shaft, shows that a change of the shaft diameter would affect theta ( ). Since the simulation was based on an incrementally
increasing force on the pinions which lead to the movement of the rack, theta ( ) would increase as the moment grew. This relation can be compared with the relation for a spring which is described as:
In the relation for a spring, k is a spring constant for a particular spring. In the simulations, Equation
3 is rewritten to the same format as for a spring. The spring constant is instead the relation
described as torsion of a shaft without the force. The x which describes a displacement of the spring is in this case the angle of torsion which the shaft has been twisted. This is displayed as:
3 2 4 F δ 25 %
15
3.3 Shaft Hub Connections
The fixation of some of the gears to the shaft was accomplished by using shaft hub connections. These consist of a hub and a cone ring and have corresponding angles so that the cone can slide into the hub. The components both have a slit in the side which makes it possible for them to be compressed. The two components move towards each other as the screws are tightened. The hub will expand its diameter as the cone gets pushed further down into the hub. This puts an outwards pressure towards the inside walls of the gear. At the same time the cones diameter will compress, putting pressure on the shaft as illustrated in Figure 14.
There are both pros and cons using this type of fixation for cogwheels. The advantages in this case are that they are easy to assemble, strong and cheap. All the gears on the prototype were assembled using shaft hub connections when we started working on the prototype. Since the task didn’t concern the pinion and the outgoing shaft other than that they had to remain, this was a good solution for fixation, provided they endured the torque.
The disadvantages using the shaft hub connections were that they only held the parts in place using friction. This made assembling harder, since the parts had to be cleaned thoroughly to achieve sufficient friction. The shaft hub connections where bought from a reseller, Mekanex Maskin AB. According to the data sheet the shaft hub connections would resist torque of 380 Nm (Mekanex Maskin) (Appendix J). Calculations secured the use of shaft hub connections fixating the
components in mind.
16
3.4 Constructing new components
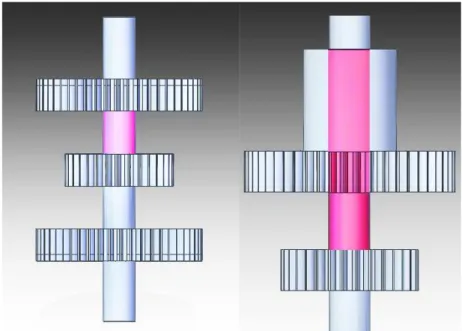
3.4.1 Fixation of gears on shaft – pinion lock
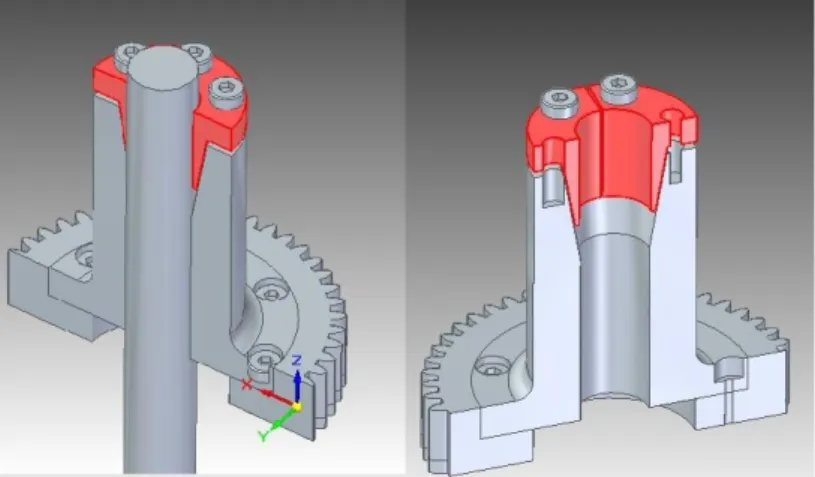
When the project started an idea already existed of how longer torsion length would be achieved. The idea came from founder Stig Lundbäck and consisted of a CAD image which gave a concept to work further on. Attachment of the gears on the shaft by means of a hub was a good concept. It made it possible to move up the attachment point in order to achieve longer torsion shaft. (Figure
15) The problem was how to fixate the hub to the shaft.
3.4.1.1 Concept 1 – Shaft hub connection, further developed
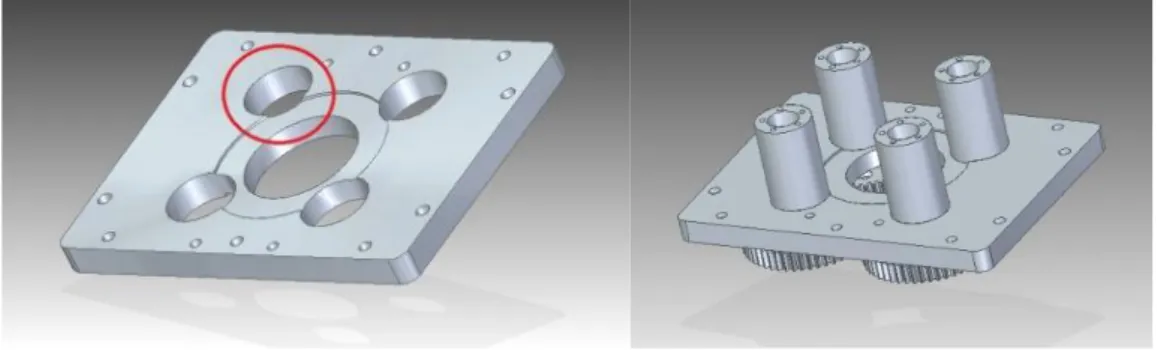
There was a question of what would be the cheapest and take a minimum of production time. The concept generation found a way that would fit this design well. The use of shaft hub connections was discarded early because using a common shaft hub connection would require further reconstruction of the top plate (Figure 16) which seemed unnecessary. Using a diameter on the hub near the diameter of the holes in the top plate was therefore preferable, thus becoming guideline for the concepts.
But the idea of a shaft hub connection lingered. Why not evolve the concept using existing parts. This approach also made it possible to avoid reconstructing the top plate. And that it was possible to manufacture in the facilities on KTH Campus. The idea is that the hub is locked to the shaft by a cone ring that is pressed down using screws, thus squeezes tightly around the shaft while it pushes out against the interior walls of the hub. In this way, even the existing cone rings from the previous assembly could be used. According to Mekanex datasheets the shaft hub connections tolerate minimum 380 Nm of torque, thus falling within the scope of the test strain. For this, the existing
Figure 15 - Hub and Torsion Shaft
17
gears could remain in the assembly, although lathing would be required (Figure 16 - Top Plate) in order to lower the hub so that it would clear the plates under and above.
3.4.1.2 Concept 2 - Splines
A common way of joining two rotating components is to add splines (Figure 18, right), e.g. to a shaft and hub. The shaft would be designed with male splines which would mesh into corresponding splines on the hub. Compared to a key joint, splines can be made with much better precision and withstand more demanding stress. The key joint is the oldest method used to transfer a rotation and is mostly used to transfer rotation in one direction (Figure 18, left). (Olsson 2006)
One of the first ideas of fastening the gear to the hub and in the same time make it possible to adjust, was to add bow shaped holes in the hub (see Figure 19 - Hub and Gear). This would aid when adjusting clearances between cogs allowing slight rotation before tightening the screws. The fixation onto the shaft would be made by adding splines to the shaft and the hub (see Figure 19 - Hub
and Gear).
Figure 17 - Shaft Hub Connection on Hub
Figure 18 - Key Joints and Splines
18
This however limited our possibilities of making minor adjustments after assembling the top plate, since the adjustment would be made at the bottom of the hub, where the bolts would fixate the hub to the gear. When assembling the gear box the adjustments would basically be impossible to make if not the holes in the top plate (see Figure 20 - Top Plates and Hubs) leading down to the foot of the hub would be made larger to allow reaching in and adjusting the bolts.
3.4.1.3 Concept 3 – Spline bushing
A second alternative was generated containing a bushing with splines which sat in the top of the hub making adjustments possible from the top (Figure18). The bushing fitted smoothly into the top of the hub allowing rotation of the hub. All this was dependent upon that the shaft had splines on the ends for the bushing to fit. The fixation of the bushing to the hub was proposed to be done by either welding or by using adhesives. The problem with this solution is that as the bushing is fixated to the hub it would not be able to be removed again. However, the hub with the bushing finally fixated would cause no problem during disassembly; simply lift the hub off the splines.
3.4.1.4 Method chosen
Due to the problems that would arise when assembling, i.e. welding or using adhesive to fix the bushing, concept 1 was chosen. Concept 1 was more suitable since it allowed easy assembly and disassembly characteristics. Concept 1 could, just by unfastening the screws, be taken off and be either replaced to aid future maintenance work or adjusted to optimize force distribution. In concept 2, the method of either welding or using adhesive was also more tedious than it had to be for our purpose. Concept 1 is also suitable for an industrial solution when assembling this product in the future, possibly in combination with adhesive to make it permanent.
Figure 21 - Spline Concept Figure 20 - Top Plates and Hubs
19
Production wise, concept 1 initially proved somewhat difficult to manufacture. It would be hard countersinking the holes in the hub. Further development led to the solution to flip the gear over, lathe a recess in the gear for the hub base to fit and lastly countersink the gear instead of the hub (Figure 21). The screw threads were drilled in the hub base. The gear was then threaded over the hub neck. This made both components easier to manufacture. The center hole of the gear was previously lathed to fit a shaft hub connection (47 mm diameter). Therefore, the dimensioning of the hub had to be adapted to the hole of the gear. The components were manufactured in the KTH workshop.
3.4.2 Outgoing shaft locking
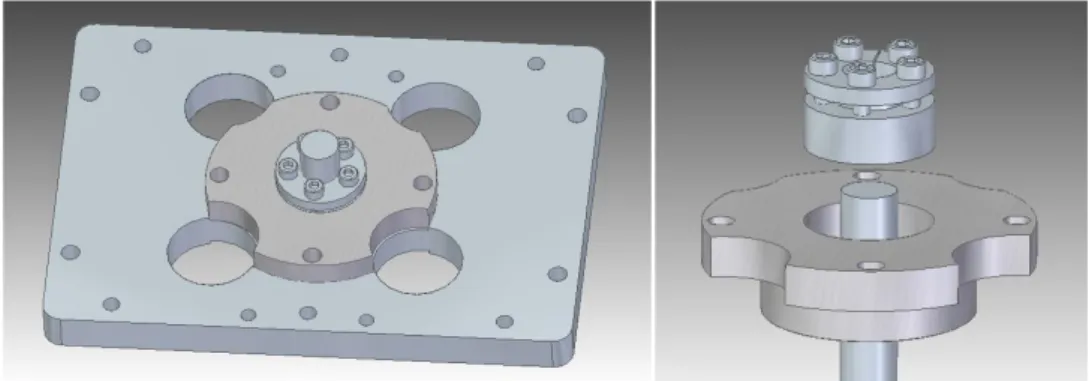
The outgoing shaft consisted of a shaft mounted on a free wheel covered by a hub (Figure 24). The free wheel (Figure 23) allowed free rotation in one direction and drive in the other direction. When performing the tests the outgoing shaft needed to be locked in order to act as counter hold for the torsion shaft. The outgoing shaft locking should be dimensioned and designed to withstand the torque arising from the 20 kN force, which the rack is subjected to, with preferably no slip. The top plate, having to be fixed in advance, thus governed the design of the locking solution (see Figure 20 -
Top Plates and Hubs). Seeing the tests were to be performed statically the free
wheel would never move, making it superfluous. Once again the shaft hub connection would come in play.
Figure 24 - Outgoing Shaft and Hub Figure 22 - Chosen Concept
20
3.4.2.1 Concept 1
Using the existing aluminum hub for the outgoing shaft and free wheel would save time and material. By modifying this to make a shaft hub connection fit into it, the shaft could be locked using equipment made for this specific task. A recess down into the top of the hub, 47 mm wide and 25 mm deep, enough to fit a shaft hub connection would make it possible to keep the free wheel mounted on the old shaft. It would however function the same way with the free wheel removed. Since the hubs for the four pinion shafts was sticking out of the top floor plate, the hub for theoutgoing shaft would be in the way. The sides of the hub had to be milled out a little bit to not cover the holes where the hubs sticking up. This could however affect the strength of the hub.
3.4.2.2 Concept 2
A completely new design of an aluminum hub would allow a lower fixture of the shaft. Thus resulting in less risk of significant unwanted torsion in the outgoing shaft, in comparison with concept 1 where the high fixture could lead to measurement errors.
Figure 25 - Outgoing Shaft Locking Concept 1
21
3.4.2.3 Calculations for locking of the outgoing shaft
Before the new outgoing shaft locking was sent for manufacturing there was some thoughts on how it would endure the forces it would be subjected to. The most important part was that the inner walls of the outgoing shaft locking would endure the forces against its inner walls from the shaft hub connection. Since the shaft hub connection uses friction for fixation, it was important that the walls would endure the forces needed to maintain enough friction for the outgoing shaft to remain still.
By using the ratio between the gears a moment for the outgoing shaft could be calculated thus giving enough information to calculate the forces acting on the inner walls of the outgoing shaft locking. The moment of the outgoing shaft was calculated giving us a moment of approximately 160 Nm. The outgoing shaft locking could be seen as an open ended pressure vessel where the shaft hub connection would create a pressure on the inner walls of the pressure vessel. The outgoing shaft locking would look like Figure 27 - Outgoing Shaft Locking and the pressure vessel was represented by the circled part of the picture. The dimensions of the pressure vessel are displayed in
Table 5 - Outgoing Shaft Dimensions.
ri ro t h
Outgoing shaft locking – Pressure vessel area 23,5 38,5 15 17
The frictional forces acting from a surface is described as a constant of friction, µ and the normal force (N), acting on that surface. A FEM-analysis (Appendix I) and basic pressure vessel calculations for thick walled vessels was performed on this area of the component. The rule for defining if it is a thick walled pressure vessel is to define the relation between the inner radius and the wall thickness as (Hibbeler 2004):
For this case there is pressure acting on the inside, an internal pressure only. The internal pressure creates a circumferential stress. This can be described as (Richards 2012):
4
5
Figure 27 - Outgoing Shaft Locking
22
As seen in Equation 5, the stress is a function of the internal pressure. The internal pressure could be calculated by using the moment which needed to be held by the friction from the shaft hub connection. This can be described as:
From Equation 7 the force acting on the inner wall to maintain a specific moment, is obtained. This force is used to calculate the pressure acting on the walls described as:
3.4.2.4 Method Chosen
When opening up the free wheel a discovery was made. What initially was assumed was that the outgoing shaft and gear wheel was attached to each other, but when it was finally open (which proved difficult) it was found the opposite. Observe Figure 29 - Free Wheel; the gear is actually attached to the free wheel. A stressful afternoon started of trying to solve the problem. The solution was adhesives; the outgoing shaft was going to be glued.
6
7
23
This also made the choice of which locking device to use easier. Seeing the shaft needed to be remade and then be used without the free wheel; there was no point in using concept 1 anymore. Seeing that the lower locking device (concept 2) would provide lower risk of unwanted torsion in the outgoing shaft; concept 2 was chosen. The components were manufactured in the KTH workshop.
3.4.2.5 Adhesive joint
Halfway through the project another probable solution of fixating gears to shafts was discussed. A popular method that has been growing is to use adhesives to merge two components. This method was discussed for the fixation of the pinion on the shaft for the final product. This type of solution was investigated and the method was also tested on the prototype. The gear for the outgoing shaft was fixated using glue named Loctite 603 recommended by Loctite Customer Support. According to Loctite and their product descriptions, their adhesives could be used advantageously in a combination of bonded press fit and adhesives.
For the adhesive to be strong enough without using bonded press fit, which would be the method used in this project, a large enough surface for the adhesive to join the components to is needed. The shear strength of the adhesives is 20 N/mm2. This although is depending on the temperature
and type of material used and the time the adhesive has to cure. (Loctite 2012) The adhesive was applied in abundance after the hole in the gear had been lathed into correct recommended gap dimensions. The gear was rotated on to make sure the liquid glue would apply everywhere. It was then left to cure for 24 hours, according to instructions. (Appendix G)
24
Figure 30 – Applying the adhesive
The design of the shaft was discussed to be larger at the point where the bearings and the pinion gear was supposed to be placed. By making this cross section larger, a larger area for the adhesives would be achieved thus lowering the risk of not having enough strength in the joint as illustrated in
Figure 31 –Alternative joint surface solution. This solution was not attempted for this project due to time
constraints. However it would be a good alternative for the future product.
25
3.4.3 Fixture between rack and Hydraulic Cylinder
Since the project had time constraints it was decided that if possible, build on existing components. There were discussions regarding whether or not the previous design of the fixture between cylinder and rack would hold. Previous thesis analysis showed that the fixture would hold the stress, however, visual inspection of the welding in the fixture lead to the thought of reinforcing the design just in case. Since the fixture would be subjected to a bending stress situation, reinforcement around the affected area of the bending was a first step.
One suggestion was to simply add a rectangular washer of suitable height, width and depth to try to distribute the stress on a larger area, thus making it less likely to break by bending. This however required choosing longer bolts and
combining these with washers.
Dimensioning of the washer would be guided by the welds and for simplicity use the same material as the fixture was made of. (See Figure 33 - Solution 1)
But the suggestion chosen was to weld on new pieces on both sides of the fixture, see Figure 34. The bending stress would now be taken up by the vertically welded parts. This also seemed to be a safer solution to this problem instead of the simple yet effective idea with the rectangular extra washer. The two new pieces actually contribute to strengthen the entire structure, without having to replace the bolts. However the screws were supplemented with two standard 1.5 mm
cylindrical washers to better distribute the load. By reinforcing
it this way this component would not be the weakest link in the prototype test rig.
Figure 32 - Fixture between Rack and Hydraulic Cylinder
Figure 33 - Solution 1
26
3.4.4 Reinforcement of gear box frame structure
Since the gear box was subjected to shearing in the previous test rig something had to be done to reinforce the test rig. It was the weak stud bolts and the idea of those being the only thing that kept the floors plates from shearing, which made it improperly designed. To remove the shearing phenomenon, or at least make it insignificant, the moment had to be taken up elsewhere. The suggestion to solve this was to rotate the gear box 90 degrees on the horizontal axis, see Figure 35. By having the plates rest vertically on the base, the gear box would no longer be subjected to the shearing effects, provided all four floor plates would be attached to the base.
Previously, the pin bolts acted as fixation points of the gear box on to the beams. When the decision had been made to rotate the gear box a base as well as a fixation point had to be
constructed. The base had to be able to fixate all four plates and be used to attach the gear box onto the beams. The easiest way were to use a reinforcement plate of suitable thickness, drill holes in it and then drill corresponding holes with groves in each floor plate. This way the floor plates would be steadily fixated in the beams but also increase the strength in between the floor plates.
Figure 36 - Rotation of the Gear box Figure 35 - Shear Stress in the Structure
27
The reinforcement plate would also function as an attachment point to the beams. However since the gear box wasn’t symmetrically square it was now, after the 90 degrees rotation, narrower than before. This along with the screw heads of each floor plate sticking out underneath, made it necessary to position the beams wider apart. This made it necessary to overview the hydraulic cylinder fixture (3.4.5 Hydraulic cylinder fixture)
3.4.5 Hydraulic cylinder fixture
Since the decision had been made to rotate the gear box 90 degrees, the rack now had a new vertical displacement i.e. the distance between rack centre and the beams had been altered (Figure 40 - Displacement of Rack Height). The existing holders leaned in the perfect angle to achieve the correct height and the holes in the beams where made to achieve this angle. This meant the existing fixture could not be kept. It was decided easier to design new fixtures. Now
presented itself an opportunity to reinforce the design to make sure it would suffice the 20 kN force that would be tested for.
Figure 38 - Reinforcement Plate Fixture on Beams
Figure 39 - Hydraulic Cylinder Fixture
28
Even though the existing fixture would suffice, the new design gave opportunity to exceed the safety factor and make it even stronger. As the existing fixture with its washers and bushings was highly exposed to shear stress, the new design should be using friction in further extent. By pressing large areas of metal together, the friction would reduce the shear stress in the M14 bolts. The table used can be seen in Appendix H.
A shape was drawn in CAD-programs that would fulfill the requirements i.e. simple and strong. The importance was not the shape of the holders but the holes distance to each other. The distance was essential for allowing the hydraulic cylinder to be placed on the correct height. This was important to prevent the rack from being pulled obliquely. The two holders were supplemented with bars which were governing the width of the beams; an example where available material governed the design.
Figure 41 - Hydraulic Cylinder Fixture
29
The pieces were made of aluminum provided by CorPower Ocean AB. The pieces were cut with water jet cutting equipment located on KTH premises (Figure 42 - Water Jet Cutting). The holes were placed and drilled by the project members.
3.4.6 Torsion measurement method
To make it possible to design a reliable and effective WEC, the torsion of the pinion shafts is important. To make sure the torsion of the shaft correspond tothe simulations and calculations, tests were to be performed using the test rig. Since the torsion in the shafts were assumed to be very small, good measuring results would be hard to achieve. This required an accurate measuring method which would give results at very small deformations in the shaft.
3.4.6.1 Alternative measurement methods
As mentioned earlier the shaft will now be solid which makes the previous method none functional. Ways to modify the current method to make it applicable in the new design were discussed. However since the accuracy of the measurements was found inadequate, focus was directed on inventing new methods. Very sensitive or very long indicators were required due to the extremely small torsion angles that would be measured.
30
3.4.6.1.1 Laser Pointer Method
One of the first new solutions was using laser beams as indicators. We would want to exchange the current steel indicators with laser pointers which would make the measuring method a lot more flexible. Also, using laser pointers, the length of each indicator would become excessively longer. The longer the indicator, the more accurate the measurement reading would be. Using lasers the indicators could shine a beam through an entire hallway providing a theoretical indicator length of up to 30 meters. The beam would result in a spot on a wall and when force is applied to the rack and torsion commence, the path of the spot could be marked and followed on paper.
3.4.6.1.2 Strain Gauge
Another concept to measure torque was briefly discussed before revoked, that of using strain gauges. By mounting strain gauges on the shafts on selected places the values could be read easily on a computer. A study was carried out on how strain gauges actually worked and if it could be applied in this assembly. The strain gauge is a foil which locally indicates a deformation in the material where it is placed. As it is either compressed or expanded the resistance will change thus indicating a deformation of the beam. This method would require a lot of calibration and work to get it functioning correctly.
31
3.4.6.1.3 Steel pointers
The initial method that had been used in the previous setup was examined and investigated to see if this indeed was an acceptable method. By fixing a long pointer on the shaft and letting this move over a measuring panel fixed in the ground, the movement could be read on millimetre paper. The pointers could be fixated on the shafts using a hose clamp or perhaps be bolted on. This method however had limitations to what was realistic pointer length.
3.4.6.2 Method chosen
Design Concepts Row Criteria Weights Concept A Concept B Concept 3
1 Ease of assembly/disassembly 8 + - R EF ER EN C E 2 Ease of adjustments 8 + S
3 Durability - durable to stress 5 S S 4 Simplicity - simple is the new black 6 + S
5 Manufacturability 5 + - 6 Cost 2 + S TOTAL + 5 0 0 TOTAL - 0 2 0 TOTAL S 1 4 0 Overall SCORE 5 -2 0
Weighted overall score 29 -13 0
Evaluation commenced and using a Concept Evaluation Matrix, we started excluding concepts. Based on criteria such as complexity, manufacturing difficulty, accuracy and ingenuity, the concepts were evaluated. The criteria’s were also weighted as they did not have the same importance for
Table 6 –Selection Matrix
32
every component. These criteria’s are then evaluated and compared to a reference concept. The output of each criterion was then compared to a reference concept. The output was either better which was indicated with a plus sign (+), worse which was indicated with a minus sign (-) or the same which was indicated with an “s”. An example of the selection matrix used is shown in Table 6. While the steel pointers-method seemed simple to manufacture and fixate the strain gauge came off as being most complex. The steel pointers required length which would be difficult to construct stable and would, even if made out of aluminum, give rise to vertical torque and possibly make the pointer bend under its own weight. The steel pointers would have to have some kind of support and the design suddenly became very large. The steel pointers could however show the movement very accurately due to the possibility to make the point very sharp.
Using strain gauges the torsion could be measured accurately and then calculated into a distance of angular torsion. This however would create a lot of work which there was no time for. And also the strain gauges had to be mounted on the torsion shaft which would be inside the gear box; this provided a problem that was related to the design of the hubs. There had to be considerations made when designing the hubs to make room for the strain gauges and since the outcome of the hubs had been so well accepted by the parties involved, the concept of using strain gauges became of minor preference.
When evaluating the different concepts of measuring one stood out by fulfilling the criteria in all points. More than the others the concept of using laser pointers became more and more attractive. The laser pointer concept fulfilled the criteria of complexity in that there was no indication that other than cheap keychain laser pointers most likely would due. Since the pointers only needed to be narrow enough for us to be able to make out a center of the point, there was a low complexity on the type of laser needed. This contributed to the project budget which also was a factor in the selection process.
The laser pointers could be ordered from a reseller although a laser fixtures would be necessary to manufacture, however this was deemed non difficult. The last criteria of ingenuity were the strongest point since the idea had a modern and futuristic feeling. But the advantages were many. The laser pointers were small and would be easy to mount to the shafts using not all too complex holders, but foremost, the pointers length that the laser provided accuracy to the measurements and easy readings.
33
In order to fix the laser pointers on the shafts simple yet effective fixtures were manufactured in the workshop of 1 mm thick metal sheet. The thin yet sturdy metal sheet was fairly easy to work with and would carry the weight of the laser pointers easily. The fixture was attached to the shaft using a hose clamp. The holder was designed in such a way that it kept the “ON”-button pressed without using a screw or clamp.
35
4
Testing Phase
4.1 Assembling the Gear Box
Assembling the gear box provided many obstacles. For a few of the problems that occurred the gear box needed disassembling in order to be corrected.
4.1.1 Assembly obstacles
In the previous mounting the pinion gears had two bushings of copper pipe above and below the gear. These were to ensure that the bearings were free of the shaft hub connection screw heads. These bushings were individually dimensioned for each pinion since all the shaft hub connections were uniquely compressed. The bushings were dimensioned with regard to the distance (x) between the two bearings that was placed on each side of the pinion gear (see Figure 48 - Pinion gears
with Bushings). This distance was critical to ensure that there was no axial gap between the copper
bushings and the top and bottom floor plates. The old bushings could in most cases not be used again for various reasons. One example was when the shaft hub connection and pinion gear did not have the same height ratio as in the previous assembly or that the new shaft had different width compared to the previous one. Measurements were carried out and new bushings were
manufactured. Old bushings were reused by moving them to another shaft where they now were better suited.
Another significant problem was that when the hubs would be fixed to the shaft they were lifted upwards towards the cone ring. This happened since the cone ring pinched around the shaft and therefore refused to move axially. Seeing the shaft hub connection needed to be compressed the only way it could do this was by lifting the hub. This was a problem since the space between the floor plates was only 23 mm and the gear height itself was 20 mm. In the ideal case, gears and hubs had 1.5 mm on either side. As the cone ring clamped on to the shaft the hub and gear was lifted and eventually hit the top level. As the shaft would rotate it would scrape the gear against the layer which would give rise to a lot of friction. The problem was solved by during assembly making sure the gear was at the bottom and before tightening the screws, hammer down the cone ring into the hub. This way the gears were not lifted nearly as high as before and as the cone ring was screwed firmly it was only lifted between 1.2-1.9 mm, to be compared with the ideal value 1.5 mm. The
Figure 47 - Pinion gears
36
important thing was that the gears would move freely and not hit any of the layers. (See Figure 49 -
Gear box positioning of Gears)
4.2 Calibration of hydraulic cylinder
The hydraulic cylinder needed to be calibrated before tests were executed. In the following section a description of the calibration methods is presented. To give the test results a greater level of scientific reliability the hydraulic cylinder needed to be accurate and show the correct force that was to be applied on the gear box. At the same time ideally have a linear relation between indicated value and measured value. Different calibration methods were suggested and discussed and it turned out to be problematic. Since the hydraulic cylinder is of pulling characteristics it was difficult finding a way of accurately perform this calibration. Another problematic factor was the lack of proper equipment to our disposal. The equipment on sight at the KTH Machine Design facilities was only prepared for forces up to 5 kN. Ideal for the project were to test the cylinder for maximum 20 kN. Eventually we turned to the Institution of Mechanics at KTH; in their test lab they had equipment for testing tensile stress. The hydraulic cylinder was mounted into the machine and pressure was progressively pumped into the cylinder. Every 2 MPa on the gauge was registered and the pulling force from the hydraulic cylinder was recorded.
Figure 49 - Gear box positioning of Gears
37
The values were then plotted to a graph which showed a linear relationship (see Graph 2 - Values
from Testing of Hydraulic Cylinder). The measured results on the computer for the machine were
rounded to the nearest hundred values (ex. 915 N ≈ 0.9kN). The accuracy was assumed to be adequate to confirm that our simulations and calculations were correct; with the hypothesis that everything will move throughout the prototype during the tests, not only the shafts. Calibration also gave us the opportunity to discover limitations in the hydraulic cylinder.
For example the pressure gauge which was only scaled to 40MPa which in this case represented about 13kN (see Figure 51 – Pressure Gauge). I.e. not the maximum force CorPower Ocean had planned for their tests on the gear box. A discussion of assessment was held with CorPower Ocean and it was decided that the tests would be carried out with the maximum possible force strain 13 kN since this most likely would be more than enough.
Graph 2 - Values from Testing of Hydraulic Cylinder