http://www.diva-portal.org
This is the published version of a paper presented at 29th CIRP Design Conference 2019,
08-10 May 2019, Póvoa de Varzim, Portgal.
Citation for the original published paper:
Kurdve, M., Ulrika, H., Hallin, M., Söderlund, C., Berglund, M. et al. (2019) Designing visual management in manufacturing from a user perspective In: Procedia CIRP (pp. 886-891). Elsevier
Procedia CIRP
https://doi.org/10.1016/j.procir.2019.04.310
N.B. When citing this work, cite the original published paper.
Under a Creative Commons licence: https://creativecommons.org/licenses/by-nc-nd/4.0/ Permanent link to this version:
ScienceDirect
Available online at www.sciencedirect.com
Available online at www.sciencedirect.com
ScienceDirect
Procedia CIRP 00 (2017) 000–000
www.elsevier.com/locate/procedia
2212-8271 © 2017 The Authors. Published by Elsevier B.V.
Peer-review under responsibility of the scientific committee of the 28th CIRP Design Conference 2018.
28th CIRP Design Conference, May 2018, Nantes, France
A new methodology to analyze the functional and physical architecture of
existing products for an assembly oriented product family identification
Paul Stief *, Jean-Yves Dantan, Alain Etienne, Ali Siadat
École Nationale Supérieure d’Arts et Métiers, Arts et Métiers ParisTech, LCFC EA 4495, 4 Rue Augustin Fresnel, Metz 57078, France
* Corresponding author. Tel.: +33 3 87 37 54 30; E-mail address: paul.stief@ensam.eu
Abstract
In today’s business environment, the trend towards more product variety and customization is unbroken. Due to this development, the need of agile and reconfigurable production systems emerged to cope with various products and product families. To design and optimize production systems as well as to choose the optimal product matches, product analysis methods are needed. Indeed, most of the known methods aim to analyze a product or one product family on the physical level. Different product families, however, may differ largely in terms of the number and nature of components. This fact impedes an efficient comparison and choice of appropriate product family combinations for the production system. A new methodology is proposed to analyze existing products in view of their functional and physical architecture. The aim is to cluster these products in new assembly oriented product families for the optimization of existing assembly lines and the creation of future reconfigurable assembly systems. Based on Datum Flow Chain, the physical structure of the products is analyzed. Functional subassemblies are identified, and a functional analysis is performed. Moreover, a hybrid functional and physical architecture graph (HyFPAG) is the output which depicts the similarity between product families by providing design support to both, production system planners and product designers. An illustrative example of a nail-clipper is used to explain the proposed methodology. An industrial case study on two product families of steering columns of thyssenkrupp Presta France is then carried out to give a first industrial evaluation of the proposed approach.
© 2017 The Authors. Published by Elsevier B.V.
Peer-review under responsibility of the scientific committee of the 28th CIRP Design Conference 2018.
Keywords: Assembly; Design method; Family identification
1. Introduction
Due to the fast development in the domain of communication and an ongoing trend of digitization and digitalization, manufacturing enterprises are facing important challenges in today’s market environments: a continuing tendency towards reduction of product development times and shortened product lifecycles. In addition, there is an increasing demand of customization, being at the same time in a global competition with competitors all over the world. This trend, which is inducing the development from macro to micro markets, results in diminished lot sizes due to augmenting product varieties (high-volume to low-volume production) [1]. To cope with this augmenting variety as well as to be able to identify possible optimization potentials in the existing production system, it is important to have a precise knowledge
of the product range and characteristics manufactured and/or assembled in this system. In this context, the main challenge in modelling and analysis is now not only to cope with single products, a limited product range or existing product families, but also to be able to analyze and to compare products to define new product families. It can be observed that classical existing product families are regrouped in function of clients or features. However, assembly oriented product families are hardly to find.
On the product family level, products differ mainly in two main characteristics: (i) the number of components and (ii) the type of components (e.g. mechanical, electrical, electronical).
Classical methodologies considering mainly single products or solitary, already existing product families analyze the product structure on a physical level (components level) which causes difficulties regarding an efficient definition and comparison of different product families. Addressing this
Procedia CIRP 84 (2019) 886–891
2212-8271 © 2019 The Authors. Published by Elsevier B.V.
Peer-review under responsibility of the scientific committee of the CIRP Design Conference 2019. 10.1016/j.procir.2019.04.310
© 2019 The Authors. Published by Elsevier B.V.
Peer-review under responsibility of the scientific committee of the CIRP Design Conference 2019.
ScienceDirect
Procedia CIRP 00 (2019) 000–000
www.elsevier.com/locate/procedia
2212-8271 © 2019 The Authors. Published by Elsevier B.V.
Peer-review under responsibility of the scientific committee of the CIRP Design Conference 2019
29th CIRP Design 2019 (CIRP Design 2019)
Designing visual management in manufacturing from a user perspective
Martin Kurdve
ab*, Ulrika Harlin
a, Malin Hallin
a, Carina Söderlund
c, Martina Berglund
d, Ulrika
Florin
c, Anna Landström
ba RISE - Research Institutes of Sweden, Mölndal, Sweden
b Chalmers University of Technology, Technology Management and Economics, Supply and Operations Management division, Göteborg, Sweden c Mälardalen University, School of Innovation and Design Technolog, Eskilstuna, Sweden
d Linköping University, HELIX Competence Centre and Logistics and Quality Development, Linköping, Sweden
* Corresponding author. Tel.: +46-31-7721000; E-mail address: name.name@chalmers.se
Abstract
Many organisations use daily meetings, whiteboards and an information system for employee intra-communication. While Operation Management research is often management centred, Human Centred Design, instead, takes a user’s perspective. This research aims to reflect upon and describe a method, applied in practice in a double case study within manufacturing, on how to (re-)design meetings and visual management boards, and what type of information and key performance indicators are most relevant for the personnel. The paper proposes a lean Kata-improvement inspired design method, which takes the personnel’s perspective on design of daily visual management.
© 2019 The Authors. Published by Elsevier B.V.
Peer-review under responsibility of the scientific committee of the CIRP Design Conference 2019 Keywords: Visualisation; daily meetings; daily visual management; performance measurment;
1. Introduction
Many organisations especially in manufacturing use daily visual management (DVM) meetings, with visual management (VM) boards [1]. DVM, also called floor management development systems [2] or Daily Management [3], is common in organisations aiming for lean production and is a lean practice which can be employed early in a lean transformation. DVM is expected to give increased efficiency and improved information flows horizontally and vertically within an organization [2]. The meeting agenda may be standardised and sometimes a standardised DVM-board is used. Information used in DVM may be manually written on whiteboards or digitalized (‘smart’) and usually includes some key performance indicators (KPIs). However, a (standardized) board design might not take the group organisation situation into account and the design of DVM-meeting and board may not be re-evaluated and re-designed regularly. Human Centred Design (HCD) takes user experience, behaviour, learning and errors into consideration [4]. To include the users in the DVM
(re-)design requires systematic feedback of user experiences and learnings. In lean manufacturing one preferred method for re-evaluation and raising standards is through improvement-Kata or kaizen [5], which is used to improve both operation procedures and physical artefacts.
The aim of this paper is to describe and reflect upon how (re-)design of DVM meetings, information and boards can be applied by participants in practice, by demonstration in practical cases.
This paper is based on case studies at two manufacturing companies. In the first case a production team developed a analogue DVM-board, and in the other case a team developed the requirements for a digital information system for DVM. 2. Theoretical background
Operation Management research on DVM and performance measurement and control commonly deals with a managements’ perspective of how to efficiently spread performance management information to the whole
ScienceDirect
Procedia CIRP 00 (2019) 000–000www.elsevier.com/locate/procedia
2212-8271 © 2019 The Authors. Published by Elsevier B.V.
Peer-review under responsibility of the scientific committee of the CIRP Design Conference 2019
29th CIRP Design 2019 (CIRP Design 2019)
Designing visual management in manufacturing from a user perspective
Martin Kurdve
ab*, Ulrika Harlin
a, Malin Hallin
a, Carina Söderlund
c, Martina Berglund
d, Ulrika
Florin
c, Anna Landström
ba RISE - Research Institutes of Sweden, Mölndal, Sweden
b Chalmers University of Technology, Technology Management and Economics, Supply and Operations Management division, Göteborg, Sweden c Mälardalen University, School of Innovation and Design Technolog, Eskilstuna, Sweden
d Linköping University, HELIX Competence Centre and Logistics and Quality Development, Linköping, Sweden
* Corresponding author. Tel.: +46-31-7721000; E-mail address: name.name@chalmers.se
Abstract
Many organisations use daily meetings, whiteboards and an information system for employee intra-communication. While Operation Management research is often management centred, Human Centred Design, instead, takes a user’s perspective. This research aims to reflect upon and describe a method, applied in practice in a double case study within manufacturing, on how to (re-)design meetings and visual management boards, and what type of information and key performance indicators are most relevant for the personnel. The paper proposes a lean Kata-improvement inspired design method, which takes the personnel’s perspective on design of daily visual management.
© 2019 The Authors. Published by Elsevier B.V.
Peer-review under responsibility of the scientific committee of the CIRP Design Conference 2019 Keywords: Visualisation; daily meetings; daily visual management; performance measurment;
1. Introduction
Many organisations especially in manufacturing use daily visual management (DVM) meetings, with visual management (VM) boards [1]. DVM, also called floor management development systems [2] or Daily Management [3], is common in organisations aiming for lean production and is a lean practice which can be employed early in a lean transformation. DVM is expected to give increased efficiency and improved information flows horizontally and vertically within an organization [2]. The meeting agenda may be standardised and sometimes a standardised DVM-board is used. Information used in DVM may be manually written on whiteboards or digitalized (‘smart’) and usually includes some key performance indicators (KPIs). However, a (standardized) board design might not take the group organisation situation into account and the design of DVM-meeting and board may not be re-evaluated and re-designed regularly. Human Centred Design (HCD) takes user experience, behaviour, learning and errors into consideration [4]. To include the users in the DVM
(re-)design requires systematic feedback of user experiences and learnings. In lean manufacturing one preferred method for re-evaluation and raising standards is through improvement-Kata or kaizen [5], which is used to improve both operation procedures and physical artefacts.
The aim of this paper is to describe and reflect upon how (re-)design of DVM meetings, information and boards can be applied by participants in practice, by demonstration in practical cases.
This paper is based on case studies at two manufacturing companies. In the first case a production team developed a analogue DVM-board, and in the other case a team developed the requirements for a digital information system for DVM. 2. Theoretical background
Operation Management research on DVM and performance measurement and control commonly deals with a managements’ perspective of how to efficiently spread performance management information to the whole
Martin Kurdve et al. / Procedia CIRP 84 (2019) 886–891 887
2 Author name / Procedia CIRP 00 (2019) 000–000
organisation [6]. On the other hand, HCD [4], co-creation and participatory design includes users’ needs and perspectives into the design processes, as a democratic and inclusive work process to support design [7].
Operations management aims to manage operations in efficient ways, and information management is crucial [8]. Lean management is one of the most successful operation management strategies in manufacturing. Visual management (VM), teamwork and continuous improvement (CI) are three cornerstones in Lean management [9]. Lean organisations, especially in manufacturing, use Dmeetings, with VM-boards where management information and KPIs in line with their strategy are visualized [10]. Typically for Swedish large and medium sized manufacturers, 5-19 KPIs are used divided into 4-8 categories on operator team level, with safety (accidents/manhour), quality (complaints from customers or first time through) and delivery performance (on time delivery to customers) being the three categories updated most frequently and productivity, cost, people and environment less often [11] A widely used KPI for internal efficiency is overall equipment effectiveness (OEE) which consists of the parameters availability, performance and quality [12]. DVM is implemented at different management levels, e.g. operator team level and plant management level. In the introduction of DVM in operations management, a lean improvement pilot approach using Kotters implementation steps, is common [13]. The DVM and VM-system should be continuous re-designed by an empowered team, since e.g. imposing a standard board top-down upon a team does not bring the same level of benefit as if it is continuously improved [14]. When the production system changes the operators evolve, why the information system needs to change, one option could be to apply a HCD approach, e.g. regarding content, human computer interaction and user interface design [4].
Kaizen or improvement-kata deals with how continuous improvements take place at team level in lean mature companies [15]. The improvement-kata starts from a current state and does step-wise improvements towards ‘next target state’, where each step involves reasoning about the most important issue, and hypothesize on a solution to the issue, experimenting or trying the solution and finally collect the learnings from that trial [5]. This is comparable with Donald Schöns [16] double loop learning, reflecting "in action" while
participating in the use phase, then reflecting "on action" after experimenting in the re-design phase .
By including participants in the design improvement process, like in HCD and participatory design (and in improvement-kata), it is possible to access information that is not available in other ways [17]. A participatory design approach includes the potential use of design and needs to envision potential future design changes [7]. For users to take the role of designers, they might need to step back and investigate their real needs rather than the needs they (initially) think they have [18]. Development of visual communication and information systems (including boards and their design) should include management policies and involvement of operators in CI with socio-cultural context in mind, which can be considered a contemporary approach to participatory design [19]. The concept of development here has to include holistic,
systems thinking in a breadth of areas, physical design, ‘service content’ and user experience etc., which is in line with the view of ‘good design’ as an activity that results in sensible products [20].
3. Case description and design method
3.1. Case study description
The empirics involve two companies A and B, participating in larger research projects and collaborating with researchers in academy. In this study company A was studied for six months in spring and summer 2018 while it was developing its manual board and meeting structure. Company B was studied during three months in winter 2018 and 2019, when developing the requirements for a digital information system. Both companies were small or medium sized enterprises (SME’s) and metal working suppliers in the automotive industry. Both had participated in ProduktionsLyftet (The ProductionLeap), a production innovation support program where SME’s are supported in development of their company specific lean program [21].
Company A started 64 years ago, had 40 employees and was located in Gnosjö, a region in Sweden famous for entrepreneurship, innovation and collaboration among the numerous SME’s in the region [22]. The company had two manufacturing departments working in non-rotating 2½ shifts. A cross-functional design team with four operators, a team-leader and the CI-coordinator was assigned to perform the pilot case study. The summary of individual semi-structured interviews with eleven operators and team leaders, including the pilot team from a connected study were used together with researcher observations as discussion starter in the case study.
Company B started 57 years ago, had around 100 employees and was located in the Gothenburg region a region hosting a large part of Swedish vehicle technology innovation, with several suppliers and OEMs in the automotive industry [23]. The company had three manufacturing departments working in full nonrotating 5-shift. The pilot was performed with one operator group with six operators from one department and a benchmark group with six production- and CI-leaders. As in case A, researcher observations and a summary of a connected interview study, with 40 operators from all departments, were used as discussion starter in the case study.
3.2. Design method
The study applied a Kata inspired participatory design method, hereafter called daily management re-design (DMRD) method which can be applied in the process of developing VM-boards or other information system, taking the personnel’s perspective into account in deciding what information to include and how to display it. Both pilots commenced according to essentially the same methodology, although at company A it was used to change DVM meetings while at company B it was connected to information flow digitalization rather than team meetings. The design process was the same
but the initial and final reflection included a discussion around what information to digitalise. In both cases the participants re-designed their own DVM-systems by reflecting as experienced users, changing the content, and then evaluated the changes in line with Schön double loops.
The DMRD-method consisted of five steps:
Assigning a cross-functional pilot team and choose pilot VM-boards.
Documenting the current state of DVM meetings, VM-boards and information flow.
Reflecting on the DVM-use, discuss function and design of VM-boards. Set an overall target state for DVM including medium for the information flow (table 1).
Applying 6-12 experimental learning trials, within three months (in line with improvement-Kata [5].
Evaluating the solution and learnings, update the
information need (see e.g. table 1) after each experimental trial (reiterate step 2-5 until the target state is reached), and at the end.
In the initiation, the documenting of the current state, the researcher coaches participated by observing meetings, and interviewing operators, as part of the documentation of the initial state. Similarly, the researchers interviewed CI leaders and observed the DVM at the end of the process as part of the final state documentation.
The DMRD-method was inspired by heuristic design in Human Computer Interaction, used to analyse design problems for user inter-faces [24]. The heuristic approach was combined with lean improvement-kata, using experimental learning [5] with participatory involvement and dialogue between users and stakeholders, to co-create and gain an inclusive and democratic design process [17].
4. Results
The studied two cases followed the operator driven DMRD-method.
4.1. Company A
Company A had DVM meetings on two levels, and all operators participated in the operator level DVM while on the plant level DVM leaders and key personnel participated. Company A aimed to develop their DVM structure (agenda, participants and what information was to be used) and design of the VM-boards (how information should be displayed) in one operator team DVM and in connection to their plant level DVM.
Initial interviews with operators showed that operators had variating views of the value of DVM and whether it worked in an efficient way regarding how they got access to information they needed to be able to perform their daily tasks. One important feature of the DVM-meeting was to build team spirit and joint learning. This was enhanced by overall company information and performance progress. The main reason for the DVM meeting was for operators to quickly get information of equipment status and regarding current issues. Observations of
meetings and interviews concluded that the DVM-board studied was placed in a somewhat narrow area with some noise disturbance. At meetings all operators participated and seemed to listen but did not talk much. The main information on the boards were machine related. Production orders were displayed at each machine in a digital system and personnel attendance was displayed at the plant level DVM-board, not the team DVM-board. The operators and production leaders expressed that they did not need a lot of KPIs, but rather need comprehensive information on machine status and problems that may affect quality or productivity such as OEE-data.
The assigned cross functional design team developed the boards in accordance to the DMRD- method for almost six months with trying small changes on the boards and some occasional larger changes. The design team was led by the CI-manager who reported that they did not strictly follow the Kata-improvement method but the focus on current state, next target state and learning from trials was kept.
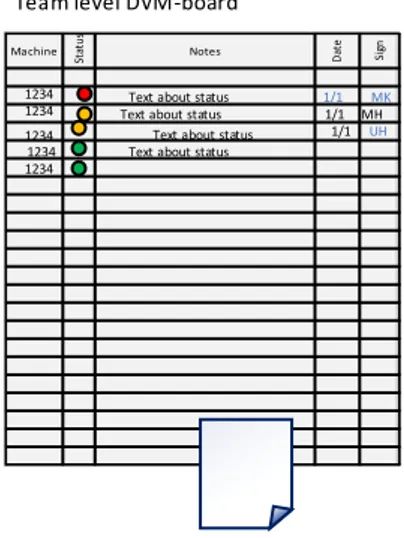
As final result, the board and place for DVM meetings were moved to a spot where it was quieter, and better space for all operators to participate. It was still placed so that operators passed it when going on breaks and they changed to a large size whiteboard and added information. The information contained detailed information for the status of each machine including the cause of problems as in the old DVM board (Fig. 1), but the layout of this was changed (Fig. 2). The board was changed from approx. 1x1m to one much larger (1x3m). Machine numbers were now in another colour to make it easier to read. There was no colour coding of information otherwise and different coloured pens were removed in order not to cause confusion. In addition, a training schedule for operators and disturbances were added to the board, see Fig. 2. It was noted that the personnel allocation plan to each machine was not displayed even after the development period, it was information that only was available by asking operators or team leaders.
Company A also started experimenting with digital displays of the machine overall equipment efficiency, data previously available in each machine can now be compared and discussed in a common display near the DVM board.
Team level DVM-board
Machine St at u s Notes Da te Si gn
1234 Text about status Text about status
Text about status Text about status 1234 1234 1234 1234 1/1 1/1 1/1 MH UH MK
Martin Kurdve et al. / Procedia CIRP 84 (2019) 886–891 889
4 Author name / Procedia CIRP 00 (2019) 000–000
Team level DVM-board
This weeks solutions
Tra i ni ng A B C D E Da te N.N. X X X N.N. N.N. N.N. N.N. X N.N. N.N. X N.N. X N.N. N.N. N.N. N.N. N.N. N.N. X N.N. N.N. N.N. N.N. N.N.
Date Disturbances Sign.
St at us Machine St at u s Notes Da te Si gn Machine St at u s Notes Da te Si gn
Text about status Text about status
Text about status Text about status
1234
1234 1234 1234
1234 Text about status 1/1 1/1 1/1 MH UH MK 1/1 Text about disturbance MK
Fig. 2. Layout of the team DVM-board after redesign
4.2. Company B
Company B also had two levels, the plant level DVM and the operator level information system. Regular DVM meetings was not used for operators, instead they have one-on-one operator handovers for each cell between shifts complemented with team information boards and digital information. On plant level, however, there was a ‘pulse-room’ (or war-room) with traditional team DVM boards, displaying delivery figures, quality outcome, machine status (green or red) and personnel status for each team leader. Company B’s aim was to have a digitalised information system at the manufacturing departments and if possible add digital screens also in the pulse room. They wanted to do this in order to get all five shifts involved in the new digital DVM-system.
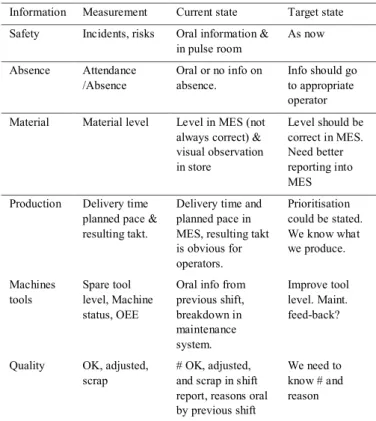
The operator team made a matrix, see Table 1, of how they received information and what they might want to have in the future and then made experiments to find out if the information would be useful or not.
The operators highlighted that the information they needed was; if machines are working, tool and material status, if there had been any safety or quality issues and if the people at next shift would turn up or not. The information exchanged in shift handovers was the shift report, including how many conforming and non-conforming products had been produced during the previous shift, tool changes and material levels and any issues with the machines. If someone was sick or late, the team leader working dayshift received information, but not the operators. Planned absence was available in the pulse room.
Table 1. Current and target state for information parameters at Company B Information Measurement Current state Target state Safety Incidents, risks Oral information &
in pulse room As now Absence Attendance /Absence Oral or no info on absence. Info should go to appropriate operator Material Material level Level in MES (not
always correct) & visual observation in store Level should be correct in MES. Need better reporting into MES Production Delivery time
planned pace & resulting takt.
Delivery time and planned pace in MES, resulting takt is obvious for operators. Prioritisation could be stated. We know what we produce. Machines tools Spare tool level, Machine status, OEE
Oral info from previous shift, breakdown in maintenance system. Improve tool level. Maint. feed-back?
Quality OK, adjusted, scrap
# OK, adjusted, and scrap in shift report, reasons oral by previous shift
We need to know # and reason
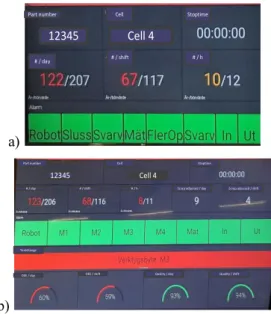
In parallel to the pilot, digital boards for each cell were tested (from a technical point of view). Initially production figures were displayed, but then information of stop time and alarms from the machines in the cell were added (Fig. 3a) and eventually also OEE in % and an alarm for tool changes (Fig. 3b). Some of the additions (e.g. OEE) were management need driven rather than operator need driven (tool change status). The technical availability and update of the data was the limitation of the information. The main remaining issue after the pilot was to align the updating frequency of some of the data e.g. material and production balance, with the real time display. While manually written information was only expected to be correct at the time it was written, data on digital screens are expected to show continuously updated data.
a) Cell 4 Cell Stoptime 12345 Part number # / h # / shift # / day b) 12345 Cell 4 Part number # / day # / shift # / h Cell Stoptime
Scrap adjusted / day Scrap adjusted / shift
Toolchange
OEE / day OEE / shift Quality / day Quality / shift
Fig. 3. screen in cells (a) at start of pilot; (b) at end of pilot.
5. Analysis and discussion
When combining lean experimental learning with the participatory [7] daily management re-design method specific types of information were valued from a user’s point of view: The initial interviews and observations gave a broad knowledge of how operators experience the current systems but could not give deep knowledge of their real needs. The iterative experimental DMRD-method gave a deeper insight in the information needs and how to develop the system despite not adhering exactly to improvement-kata [5]. In addition the participating group gained reflective insights in their operations [16]. The process of experimental learning may lead to as much increased efficiency as the actual board development itself.
This study deepen understanding how the operators use and understanding of information is related to a number of information sources and forms in a diversity of context, influencing interpretation of the information in line with previous studies taking a holistic approach to users, artefacts, the environment and their interconnectedness into consideration in Visual Management and design [19, 25].
In regular whiteboard-based redesign the incremental DMRD-method led to re-evaluated DVM-boards but also to reflection on how to efficiently perform meetings [8] around the board. The duality of the board function both as agenda and focus point at meetings and as information point between meetings were highlighted. The DVM meeting is a forum for teambuilding and learning exchange which can be worth developing further. Results from previous studies of success factors for operation of industrial work [26] show that since operator work is multi-dimensional and multi-tasked, operators need to develop a high and broad competence. The work environment should offer development and learning opportunities to foster improvement, and development work in line with other studies [5, 16, 27].
Operators in both cases highlighted the need of descriptive information on status rather than simply measurements of efficiency of personnel, machines and product delivery for each operation. Although needed at higher management levels, some
management KPI’s, such as number of products produced at the operator’s operation, were not thought of as useful to display for the operators. This stands in partial contradiction to earlier studies [6, 10]. While status of machines and people, that were considered important, were mainly descriptive, they may generate aggregated numeric KPI’s such as OEE on higher levels. This may explain why they are not among top three KPI categories used in manufacturing (safety, quality and delivery are top three) [11]. Quality and delivery are related directly to the material balance that operators ‘already know’ but these number needs continuous update into the system. OEE as aggregated number may be less useful for operators, while its parts, availability, performance and quality performance may be more useful. Regarding what type of information that may gain on digitalization, it is important to consider the storage of information and how it is updated. While status descriptions may be difficult to compare and store as trends, performance measures are often easier to digitalise. The digital data however is expected to be correct at ‘all-times’ in another way than data on an analogue DVM board that are expected to be right only at the time of the meeting.
6. Conclusion
The study contributed with practical insights in how operators can participate in re-design of DVM and with two case results on what is important when implementing DVM. Further broader quantitative and qualitative studies is suggested for the future.
In both cases, operators state that the information they need to perform their daily activities include machine related information (e.g. acute stops, maintenance planning, tool changes), quality related information (deviations in materials, tools or equipment), and personnel (planned or acute absence, training etc.). Material and produced part balance, although at first perceived as unnecessary was later seen as crucial in case B. The physical surrounding and placement of meetings and board was important in case A.
The improvement method was in general found useful to gain deeper understanding. To gather a smaller focus group that over a longer period of time try, discuss and learn design and usability issues was fruitful in spite of not adhering strict to Kata improvement.
Acknowledgements
This research was performed with efforts from the research projects: Vis´man, (Visual and Spatial Communication and Management, from users’ perspective) KK-foundation; Visualisation for Learning at HELIX Competence Centre, Vinnova; Method development of ProduktionsLyftet 4.0, Vinnova, and SMART PM in Production 2030, Vinnova. Through these projects the research is also connected to XPRES – Excellence in Production Research initiative and Chalmers Area of Advance Production and Chalmers Area of Advance Transport.
Martin Kurdve et al. / Procedia CIRP 84 (2019) 886–891 891
6 Author name / Procedia CIRP 00 (2019) 000–000
Author Contribution
Author contribution (author initials): conceptualization and methodology M.K.; investigation, M.K.,M.H.; Empirics, M.K. M.H. U.H. and M.B.; Theory, M.K., C.S., A.L. and U.F.; analysis, M.K, U.H, M.H, M.B, and A.L.; writing—original draft preparation, M.K. C.S.; writing—review and editing, All authors.; visualization, M.K..; projects administration, C.S., M.B., U.H.; funding acquisition, C.S., U.F., M.B., M.H.; References
[1] C. Larsson, A. Syberfeldt, K.J.M.B.E. Säfsten, How to visualize performance measures in a manufacturing SME, Measuring Business Excellence, 21 (2017) 337-350.
[2] J. Liker, M. Hoseus, Toyota culture: The heart and soul of the Toyota way McGraw-Hill, New Yor NY, 2008.
[3] R.J. Zarbo, R.C. Varney, J.R. Copeland, R. D’angelo, G. Sharma, Daily management system of the Henry Ford Production System: QTIPS to focus continuous improvements at the level of the work, American journal of clinical pathology, 144 (2015) 122-136.
[4] S. Oviatt, Human-centered design meets cognitive load theory: designing interfaces that help people think, in: Proceedings of the 14th annual ACM international conference on Multimedia, ACM, Santa Barbara, CA, USA, 2006, pp. 871-880.
[5] M. Rother, Toyota Kata: Managing People for Improvement, Adaptiveness and Superior Results, McGrawHill., 2010. [6] K.K. Choong, Has this large number of performance measurement
publications contributed to its better understanding? A systematic review for research and applications, International Journal of Production Research, 52 (2014) 4174-4197.
[7] E. Björgvinsson, P. Ehn, P.-A. Hillgren, Participatory design and democratizing innovation, in: the 11th Biennial participatory design conference, ACM, Sydney, Australia 2010, pp. 41-50.
[8] U. Harlin, Å. Fast-Berglund, D. Li, L. Funke, Towards an assessment approach promoting flexible value-adding meetings in industry, in: 7th Swedish Production Symposium, November 25-27., Lund, Sweden, 2016.
[9] T. Netland, Exploring the phenomenon of company-specific production systems: one-bestway or own-best-way?, International Journal of Production Research, 1-14 (2012).
[10] M. Kurdve, K. Persson, R. Berglund, U. Harlin, M. Zackrisson, A. Ericson Öberg, Å. Myrelid, P. Trollsfjord, Implementation of daily visual management at five small and medium sized enterprises in
Produktionslyftet compared to six larger Swedish companies, in: 7th Swedish production symposium, November 25-27., Lund, Sweden, 2016.
[11] A. Landström, P. Almström, M. Winroth, Performance indicators at different organisational levels in manufacturing companies, in: 7th Swedish Production Symposium, Lund, Sweden, 2016.
[12] P. Tsarouhas, Improving operation of the croissant production line through overall equipment effectiveness (OEE) A case study, International Journal of Productivity Performance Management, 68 (2019) 88-108.
[13] S.H. Appelbaum, S. Habashy, J.-L. Malo, H. Shafiq, Back to the future: revisiting Kotter's 1996 change model, Journal of Management Development, 31 (2012) 764-782.
[14] G. Parry, C. Turner, Application of lean visual process management tools, Production planning & control, 17 (2006) 77-86.
[15] C. Soltero, P. Boutier, The 7 kata, Toyota kata, TWI, and lean training, Taylor & Francis group, Boca raton, FL, 2012.
[16] D.A. Schön, The Reflective Practitioner: How Professionals Think In Action, Basic Books, New York 1983.
[17] M.J. Salvo, Ethics of engagement: User-centered design and rhetorical methodology, Technical communication quarterly, 10 (2001) 273-290. [18] R. Verganti, Design-Driven Innovation: Changing the Rules of
Competition by Radically Innovating What Things Mean, Harvard Business School Publishing India Pvt. Limited, 2009.
[19] U. Florin, C. Söderlund, Re-Designing Information Boards: Interwoven Design Thinking and Doing, OR, in: 60th Anniversary Conference, Systems Thinking stream, Operational Research Society,11-13 Sept. 2018, , Lancaster University, UK., 2018.
[20] J. Heskett, Design: en introduktion, Raster Förlag, 2006. [21] M. Kurdve, A. Bird, S. Sundquist, PAR EXPERIENCE FROM
PRODUCTION INNOVATION IN MÄLARDALEN, in: Participatory Innovation Conference 2018, Eskilstuna, Sweden, 2018, pp. 411-415. [22] M. Löfving, C. Johansson, M. Winroth, Manufacturing Characteristics of
Subcontractor SMME: s — an Empirical Study, in: Manufacturing Systems and Technologies for the New Frontier, Springer, 2008, pp. 51-56.
[23] H. Fogelberg, S. Thorpenberg, Regional innovation policy and public– private partnership: The case of Triple Helix Arenas in Western Sweden, Science and Public Policy, 39 (2012) 347-356.
[24] J. Nielsen, R. Molich, Heuristic evaluation of user interfaces, in: Proceedings of the SIGCHI conference on Human factors in computing systems, , ACM, Seattle, Washington, USA 1990, pp. 249-256. [25] C. Söderlund, J. Lundin, What is an information source?: information
design based on information source selection behavior, Communication Design Quarterly Review, 4 (2017) 12-19.
[26] U. Harlin, L. Moestam-Ahlström, L. Medbo, J. Svenningstorp, A
Production System Assessment Approach within Swedish Automotive Industry, in: The Swedish Production Symposium, SPS 2008,
Stockholm, Sweden, 2008.
[27] P.-E. Ellström, Kompetens, utbildning och lärande i arbetslivet: problem, begrepp och teoretiska perspektiv, Publica, Stockholm, Sweden, 1992.