VTI konferens 20, 2003
VTI:s fack- och monterseminarier
vid Nordic Rail 2003
Elmia, Jönköping 7–9 oktober 2003
Johan Förstberg (Red.)
VTI konferens 20 · 2003
VTI:s fack- och monterseminarier
vid Nordic Rail 2003
Elmia, Jönköping den 7–9 oktober 2003
Johan Förstberg (Red.)
Utgivare: Publikation: VTI konferens 20 Utgivningsår: 2003 Projektnummer: 12440 581 95 Linköping Projektnamn: Nordic Rail 2003 Författare: Uppdragsgivare:
Johan Förstberg (redaktör) Statens väg- och transportforskningsinstitut (VTI)
Titel:
VTI:s fack- och monterseminarier vid Nordic Rail 2003
Referat (bakgrund, syfte, metod, resultat) max 200 ord:
Föredrag enligt följande: Program till seminariet
Fast and comfortable trains (FACT). A presentation for Nordic Rail 2003 Johan Förstberg, VTI & Björn Kufver, Halcrow, Storbritannien
Track/vehicle interaction and alignment design Björn Kufver, Halcrow, Storbritannien
Dynamic vehicle response on horizontal curves without transition curves, including turnout curves through Swedish UIC60 turnouts
Björn Kufver, Halcrow, Storbritannien & Ola Rydell, Banverket
Föroreningsnedfall från järnvägstrafik – Exempel på järnvägsrelaterad miljöforskning Göran Blomquist & Mats Gustafsson, VTI
Spårvägens infrastruktur Ragnar Hedström, VTI
SST – Körsimulator för spårburen trafik Johan Förstberg, VTI
EU:s järnvägsforskning – pågående projekt och framtida inriktning Bertil Hylén, VTI
Attraktivare spårväg med integrerad stads- och trafikplanering Johannes Nilsson, WSP Group och Tomas Svensson, VTI
Förord
Nordic Rail på Elmia i Jönköping har blivit ett återkommande tillfälle för järnvägsbranschen att träffas och utbyta erfarenheter.
Under Nordic Rail 2003 liksom tidigare har KTH, CTH, VINNOVA och VTI haft en gemensam monter med en liten konferenslokal där de medverkande i montern kan presentera sin forskning. Likaså genomför Elmia ett antal fackseminarier i sin konferensanläggning där man kan presentera aktuell forsk-ning, etc.
Denna konferensrapport innehåller föredrag som VTI-medarbetare har hållet under Nordic Rail 2003. Det kan ha varit i den gemensamma montern eller som en del av Nordic Rails fackseminarier.
Linköping december 2003
Johan Förstberg Järnvägskoordinator
Innehållsförteckning Sid
Program 5
Fast and comfortable trains (FACT) 7
Track/vehicle interaction and alignment design 11
Dynamic vehicle response on horizontal curves without transition curves, including turnout curves through Swedish
UIC60 turnouts 15
Föroreningsnedfall från järnvägstrafik – Exempel på järnvägs-
relaterad miljöforskning 19
Spårvägens infrastruktur 21
SST – Körsimulator för spårburen trafik 24
EU:s järnvägsforskning – pågående projekt och framtida
inriktning 26 Attraktivare spårväg med integrerad stads- och trafikplanering 38
JÄRNVÄGSGRUPPEN KTH
Centrum för forskning och utbildning i järnvägsteknik
Träffa järnvägsforskarna under Nordic Rail! Monter B01:01 och B01:10
I den gemensamma forskarmontern för CHALMERS, KTH, VINNOVA och VTI kan du ta del av några av landets ledande järnvägsforskares seminarier utan kostnad. Välkommen 7–9 okt 2003!
CHALMERS KTH VINNOVA VTI
Tisdag 7 okt 13.00–13.30
14.00–14.30 järnvägstrafik - exempel på Föroreningsnedfall från
järnvägsrelaterad miljöforskning
Fil Dr Göran Blomquist och Fil Dr Mats Gustafsson
15.00–15.30 Marknadseffekter av
nya järnvägar
Tekn Dr Oskar Fröidh
16.00–16.30 Professor Tore Dahlberg Vibrationer och buller Onsdag 8 okt
10.00–10.30 Vad händer i kontakten mellan
hjul och räl? Rapport från den internationella
konferensen CM2003
Professor Roger Lundén
11.00–11.30 samverkan fordon - bana Linjeföring och
Tekn Dr Björn Kufver, Halcrow
samt
"Fast and Comfortable Trains (FACT)"
Tekn Dr Johan Förstberg och Tekn Dr Björn Kufver,Halcrow
12.00–12.30 Järnvägsmekanik på KTH Samverkan fordon–bana
Professor Mats Berg
13.00–13.30 Människa–maskinproblem och
operatörsgränssnitt vid tågplanering och tågstyrning
Professor Bengt Sandblad, Uppsala universitet
14.00–14.30 Dynamiska kurvor utan övergångskurvor, fordonsreaktioner i
exempelvis växelkurvor i svenska UIC60-växlar
Tekn Dr Björn Kufver, Halcrow och Ola Rydell, Banverket
15.00–15.30 Varför spricker hjul och räler och
vad kan man göra åt det?
Tekn Dr Anders Ekberg
16.00–16.30 KTH 15 år av forskning och utbildningJärnvägsgruppen
Professor Stefan Östlund
Torsdag 9 okt
10.00–10.30 Samverkan Järnvägsmekanik på KTH fordon–bana
Professor Mats Berg
10.30–11.00 Utrustning för rationell säkring av last på järnvägsvagnar
Peter Andersson, Mariterm
11.00–11.30 Rälkorrugering och orunda hjul:
orsaker, konsekvenser och åtgärder
Docent Jens Nielsen
12.00–12.30 Simulator för spårburen trafik SST
Fast and comfortable trains (FACT)
A presentation for Nordic Rail 2003
Johan Förstberg Björn Kufver
VTI Halcrow
Railway Systems Vineyard House, 44 Brook Green 581 95 Linköping Hammersmith, London W6 7BY
Sweden United Kingdom
johan.forstberg@vti.se kufverb@halcrow.com
The idea of trains with active systems for body tilt has developed from radical thinking regarding vehicle technology, to implemented and commercially success-ful traffic operations. In the wake of this development, new research questions are created. Therefore, the 5th frame work program of the EU now funds a research project with the purpose to broaden the perspective to include aspects other than those related to the vehicle aspects.
The work is lead by the European Railway Research Institute (ERRI) and is divi-ded in several different work-packages. WP1 shall study aspects of the infra-structure. Should the track and other parts of the
infra-structure be modified when introducing tilting trains, in order to increase the system performance? This question is still controversial and it was not obvious that FACT should include this issue. However, one can notice that introductions of tilting trains have sometimes required substantial upgrading of the existing infrastructure.
Work-package WP2 will deepen the knowledge on why certain passengers may experience nausea on tilting trains. In this part of the project, there will be simulator experiments with test subjects. The simulator experiments will be planned so that the new experiments will supplement previous experiments conducted by the VTI and the University of
Southampton. Subsequent to these new simulator experiments, there will be full-scale experiments with test subjects on tilting trains.
Finally, work-package WP3 shall develop flow-charts and calculation tools that will reduce uncertainties, reduce the need for full-scale tests runs and reduce the lead times at the introduction of new train systems
Work-packages WP1 and WP2 will make use of methods developed by two PhD-projects (SAMBA4 and SAMBA5) that were conducted at the VTI in co-operation with the Royal Institute of Technology (KTH) in Stockholm (for further information, see www.fkt.kth.se).
For example, an analysis of existing track standards for tilting trains and a preliminary analysis of possible track sections for the full-scale tests are based on research results from these two PhD-projects.
Table 1 shows certain track geometry limits for tilting trains. They have been collected during the initial phase of the FACT project. They provide some knowledge on how different railway companies are utilising (or plan to utilise) their tilting trains.
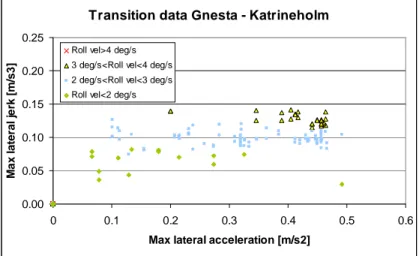
Even though Table 1 provides information about the possible worst cases, it doesn’t show any distri-bution of curving conditions. Therefore, FACT will also investigate the curving conditions on a number of lines in different countries. Figure 1 shows the curving conditions on the line Gnesta - Katrineholm in Sweden (expressed in cant deficiency I, rate of change of cant deficiency dI/dt and rate of change of cant dD/dt).
It should be remembered that different control stra-tegies regarding the tilt system will result in different motions and different values for comfort related quantities values for the vehicle body. Figure 2 shows lateral acceleration, lateral jerk and roll velocity for a Swedish SJ X2 trainset on the same curves as in Figure 1.
The vehicle response in Figure 2 is based on
Table 1. Certain (exceptional) limits in national track geometry standards for tilting trains.
Cant de-ficiency (mm) Rate of change of cant defi-ciency (mm/s) Rate of change of cant (mm/s) Czech Rep. 270 115 46 Germany 300 69 46
Italy 275 No limit No limit
Norway 280 140 75
Spain 210 55 50
Sweden 245 79 69
UK 300 150 95
Figure 1. Cant deficiency I, rate of change of cant deficiency dI/dt and rate of change of cant dD/dt) on Gnesta - Katrineholm.
Figure 2. Lateral acceleration, lateral jerk and roll velocity on Gnesta - Katrineholm.
Transition data Gnesta - Katrineholm
0 20 40 60 80 100 120 140 0 50 100 150 200 250 300
Max cant deficiency [mm]
R a te o f ca n t d e fi ci en cy [ m m /s] dD/dt>40 30<dD/dt<40 20<dD/dt<30 dD/dt<20
Transition data Gnesta - Katrineholm
0.00 0.05 0.10 0.15 0.20 0.25 0 0.1 0.2 0.3 0.4 0.5 0.6
Max lateral acceleration [m/s2]
Ma x la te ra l j e rk [ m /s 3 ]
Roll vel>4 deg/s 3 deg/s<Roll vel<4 deg/s 2 deg/s<Roll vel<3 deg/s Roll vel<2 deg/s
simplified calculations of the track/vehicle interaction. The strength of these calculations is that results can be achieved instantly and many alignment alternatives or tilt strategies can be tested in a short time. The weakness of many simplifications is that the results may be too in-accurate to be fully useful. Hence, there is a potential contradiction between user friendliness, calculation speed and accuracy.
The approach used in WP1 shows it is very important to map the broad area of decision making, rather than enhance the accuracy of an area which is too limited. The objective of WP1 is not to develop more accurate computer codes than such as GENSYS or VAMPIRE, but to use computer codes to study relevant track cases and draw general conclusions.
However, the question remains: Are the fast but simplified calculations in Figure 2 accurate enough to give a reasonable guidance in an optimisation approach for the track/vehicle system? Old simulation data from SAMBA4 has been revisited and are shown in Figures 3-5. The data shows comfort quantities for an applied study of tilting trains in Norway. GENSYS has been used to quantify dynamic vehicle response (above first and rear bogie, and in the middle of the coach) on curves with various radii and lengths of transition curves.
Figure 3. Lateral acceleration in the vehicle body (three positions) from GENSYS simulations of vehicle dynamics and according to a simplified model, respectively.
Figure 4. Lateral jerk in the vehicle body (three positions) from GENSYS simulations of vehicle dynamics and accor ding to a simplified model, respectively.
Figure 5. Pct (Passenger comfort on transition curves, standing passengers) in the vehicle body (three positions) from GENSYS simulations of vehicle dynamics and accor ding to a simplified model, respectively.
Simplified model vs GENSYS
30 40 50 60 70 80 0 1 2 3 4 5 6
Transition length (sec)
P a s s e nge r c o m for t, s ta n d ing ( % ) Pct (simpl) Pct-b1 Pct-m Pct-b2
Simplified model vs GENSYS
0.7 0.8 0.9 1 1.1 1.2 0 1 2 3 4 5 6
Transition length (sec)
L a te ra l a c c e le ra ti o n (m /s 2 ) Acc (s impl) Acc-b1 Acc-m Acc-b2
Simplified model vs GENSYS
0.2 0.3 0.4 0.5 0.6 0.7 0.8 0.9 0 1 2 3 4 5 6
Transition length (sec)
L a te ral j e rk (m /s 3) Jerk (simpl) Jerk-b1 Jerk-m Jerk-b2
Obviously, there are certain discrepancies between the GENSYS simulations and the simplified calculations. However, the resulting patterns are about the same, leading to the same conclusions.
A very interesting task for WP1 and WP2 is to investigate whether or not simplified calculations can be developed and calibrated also for the aspects of nausea in tilting trains.
A first official report from FACT is planned to be published in July 2004. The final project report is planned to be published in July 2005. During the scope of the work, information will be published on the home page of ERRI (www.erri.nl). Information is also planned to be published on the home page of VTI (www.vti.se).
Acknowledgements
The following organisations participate in the funding of FACT: European Commis-sion, UIC, Alstom, Bombar-dier Transportation and Talgo.
Various publications with relevance to FACT and tilting trains
Drechsel, A. (1938). Die Lösung der Schnellverkehrs-Frage durch den kurven-neigenden Kreiselwagen. Zeitung des Vereins Mitteleuropäischer Eisen-bahnverwaltungen (20) 377-384, 397-403.
Förstberg, J. (2000). Ride comfort and motion sickness in tilting trains. Human responses to motion environments in train simulator experiments. TRITA-FKT Report 2000: 28. Stockholm: KTH. Förstberg, J. (2003). Inverkan av tågets rörelser och åksjuka i ett tåg med aktivt korglutningssystem: Prov genomförda med NSB BS:s tåg BM73 "Signatur" med korglutning, hösten 1999; Slutrapport (VTI rapport 482). Linköping: VTI.
Gåsemyr, H. & Kufver, B. (2000). Anpassungen der Gleisgeometrie unter der Gesichtspunkten
Zuver-lässigkeit und Komfort für Neigezüge in Norwegen. ZEV+DET Glasers Annalen (Vol 124 No 2/3) 243-252. Kufver, B. (2000). Optimi-sation of horizontal align-ments for railways. Proce-dures involving evaluation of dynamic vehicle response. TRITA-FKT Report 2000: 47. Stockholm: KTH.
Kufver, B. (2003). Dynamic vehicle response on short circular curves and tangent tracks. Paper presented at the
6th International Conference
on Railway Engineering, London. ISBN 0-947644-51-2. Edinburgh: Engineering Technics Press.
ORE. (1985). Body tilt coaches - Operational experience with body tilt coaches (BT). ORE S1037 Rp1. Utrecht: ERRI.
UIC. (1998). First report on tilting train technology: The state of the art. Paris: UIC, High speed division.
UIC. (2003). Comfort test: Report by UIC. Paris: UIC.
Track/vehicle interaction and alignment design
Björn Kufver Halcrow
Vineyard House, 44 Brook Green Hammersmith, London W6 7BY
United Kingdom
Paper presented at a seminar arranged by the VTI at Nordic Rail in Jönköping 7th-9th October 2003.
The horizontal alignment is often the binding constraint for permissible train speed, both for conventional and tilting trains. When the alignment is altered, other railway infrastructures, such as substructure, superstructure, catenary systems, etc. must be altered as well. Therefore, changes in the alignment are normally associated with high costs. So when building new lines or when renewing existing ones, the alignment should be optimised with great care.
According to report C172 Rp 1 issued 1990 by ERRI, the research organisation formerly owned by the international railway organisation UIC, alignment and cant, together with other track aspects such as gauge widening, rail inclination, rail profiles, track irregularities, rail lubrication, track stiffness and damping have not
been studied as closely as vehicle aspects in the area of track vehicle interaction. However, since then, various studies on alignments, cant and to some extent track irregularities, have been carried out in cooperation with the Royal Institute of Technology (KTH), Stockholm, and the Swedish National Road and Traffic Research Institute (VTI), Linköping. This paper is aimed to present an overview of various results from these studies.
Some definitions and general observations are as follows: The
actual geometry of a railway track
may be divided into two groups: The design values of the lateral and vertical positions of the two rails and the deviations from these design values. The first group is usually divided into horizontal and vertical alignment, cant (height difference between the two rails) and gauge. The horizontal alignment is further divided
into tangent track, transition curves and circular curves. On lines for high-speed traffic, the transition curves should be long and the curve radii of circular curves large.
The second group of quantities, differences between designed positions and actual positions of the rails, is called track irregularities and may be divided into lateral, vertical, cant, and gauge irregularities. An overall assessment of all four types of irregularities, valid for a certain length of the track is called track quality. Track irregularities are always present, but they grow as a function of time and accumulated traffic load. They are regularly reduced in maintenance operations with lining, levelling and tamping machines. But after the maintenance, the growth of irregularities starts again.
It is fully possible that a railway has a high standard of horizontal
alignment but a poor track quality, and vice verse. So consequently, in Sweden, there has been a discussion whether unfavourable track/vehicle interaction, such as undesired accelerations and high track forces, caused by the alignment or the track quality, brings limitations to permissible train speed. However, there is a growing insight that it is the combined effect of designed geometry and track quality that must be taken into account.
Track maintenance
An important aspect when analysing the design geometry is whether certain geometries are difficult to maintain and hence should be associated with a lower track quality than others. It has been discussed whether or not long transition curves are difficult to maintain. An analysis of the measuring systems of the alignment machines shows that it is the sequences of short elements in the alignment that are difficult to maintain, not the long elements (Kufver 1990, 1997a). Hence, there is no contradiction in the desire for a high standard of the design geometry and a good track quality.
It has also been found that using the lining machines in design mode (using external data for slew calculations) results in a better track quality than using these machines in the automatic mode. In Sweden, the high-speed lines are often surveyed with geodetic methods, which have a high accuracy, but are costly to carry through. Hence, a cheaper method of data acquisition, where versine measurements from track recording trolleys are transformed to local coordinates, has been suggested and developed (Kufver 1995a, 1998) and brought into use by Banverket (Swedish National Rail Administra-tion).
Mathematical modelling
A basic understanding of the mathematical modelling is crucial when designing the alignment. Hence, considerable efforts have been made in surveys of design practices (Kufver 1991), tests and specifications of computer codes (such as Toporail and
InRail), writing design manuals and education of railway engineers (at Banverket training centre, Nordic seminars on track technology, Royal Institute of Technology and Swederail). A document (Kufver 1997a) has been developed during these activities and covers areas such as interpretation of output from alignment software (curvature and slew diagrams) and analysis of the
conflicting desires such as long transition curves and large curve radii where available terrain corridors are limited.
The identification of the available terrain corridor and its constraints (binding obstacles) is crucial in the comparisons of different track geometries. All alignment alternatives passing the same set of obstacles may be defined as equally costly to arrange, since cost differences between different alternatives are mainly dependent on removal of obstacles.
An optimisation approach has been published (Kufver 1997c) where the chosen alignment in the available terrain corridor should be the alignment permitting the highest possible train speed according to the track standards. The results from such an approach will be better if there are fewer physical obstacles along the route. Hence, it is always more difficult to optimise track geometry in existing railways since not only the original obstacles, but also the railway
specific installations must be taken into account. Nevertheless, the sooner such approaches are implemented, the better alignments will be achieved for a certain level of investment (or re-investment) cost.
Using the speed-maximisation approach, it must be observed that different track standards apply to different classes of vehicles, and the optimal alignment depends on the
prioritising of different classes of trains (Kufver 1995c) However, it is possible to identify suitable intervals for the design variables.
Dynamic track/vehicle interaction
Of course it must be questioned whether or not the track standards provide a reasonable guidance when used in the design process: Are the track geometries permitting the highest train speeds really the best geometries when evaluating the vehicle response? Another question is: May other geometries be justified, if the resulting permissible speed for a line becomes “unnecessarily high” when applying the speed-maximisation approach? It should be noticed that comparisons are usually between track geometries that are equally costly to build and equally complicated to maintain.
The remaining aspect to consider in alignment design is dynamic track/vehicle interaction in terms of track forces (Kufver 1997d) and passenger comfort (Kufver 1997b).
The estimation of risks for motion sickness in tilting trains is especially complicated (Förstberg & Ledin 1997, Kufver & Förstberg 1999, Förstberg 2000).
Dynamic response from different types of vehicles has been quantified through simulations with computer codes (such as GENSYS), rather than measured in full-scale tests. Simulations are cheaper, but it is also easier to control background variables (such as vehicle speed, friction in the wheel/rail contact areas, track stiffness, and track quality) in the simulations. Special attention has been paid to the dynamic response from tilting trains (Kufver & Förstberg 2001).
Applications
Investigations of track/vehicle inter-action have been focused on the choice of cant for pre-defined alignments, and the choice of radii and lengths of transition curves for pre-defined terrain corridors (Kufver 1997c, Kufver & Andersson 1998). Investigations have also been carried out to determine whether or not unconventional types of transition curves, with an S-shaped change of curvature and cant as function of longitudinal position, are superior to traditional transition curves with linear change of curvature and cant (Kufver 1999, Kufver 2000a). The answer to that specific question is that when following the evaluation procedures of the CEN and UIC, no substantial advantages can be found for S-shaped superelevation ramps and corresponding type of transition curve.
A recent study (Kufver 2003) has been focused on dynamic track/vehicle interaction on short elements with constant curvature and cant, placed between clothoids and superelevation ramps with constant cant gradients. It was found that a draft CEN standard is unnecessarily cautious, which may lead to unnecessary speed restrictions.
Studies have also been focused on curves without transition curves (sidings, crossovers, and turnouts). A recent publication (Kufver & Rydell 2003) analyses track/vehicle
inter-action on various curve combinations with 760m radius and short straights (crossovers for 80km/h).
Relatively little attention has so far been spent on the aspects of track quality. However, we know that the present assessment of track quality does not reflect undesired vehicle response very well, since the influence of wavelengths of the track irregularities is not taken into account (Kufver 1995b). This may result in a non-optimal use of maintenance resources. However, the most important investigations on track geometry (optimal clothoid lengths) have been re-visited in order to quantify the influence of track irregularities on which combinations of radii, cant and transition lengths that are optimal (Kufver 2000b).
In order to improve the possibilities of ranking track geometries that are not equal in cost to build, ideas have been created on how to evaluate vehicle response in monetary terms (i.e. how to express passenger discomfort as a part of a transportation cost). Monetary assessment of comfort may also add valuable information when evaluating whether trains should run faster (or slower) on curved alignments. A study on low-frequency motions (caused by the alignment) has been initiated, but is not yet published. However, a feasibility study on monetary assessment of motions caused by track
irregularities has been published (Andersson et al 2001).
Results from these studies have been used in the introduction of tilting trains in Norway (Kufver & Gåsemyr 1999, Gåsemyr & Kufver 2000), in studies regarding tilting trains in the Peoples Republic of China, and in track renewals and design of new railways in Sweden, Denmark and Hong Kong.
Further research on infra-structure aspects of tilting trains will be conducted within the FACT-project (Fast and comfortable trains), organised of the European Commission. The author participates as sub-consultant to the VTI. Other partners from the Nordic countries are Norwegian National Rail Administra-tion (Jernbaneverket) and Bombardier Transportation.
Photos
1. Fast and slow up tracks (U1, U2) at Sollentuna. The tracks have been used in benchmark tests of alignment software.
2. X2000 tilting train at Linköping. Computer models of this trainset have been used in extensive studies on track/vehicle interaction. 3. Crossovers at Älvsjö, used in tests of alignment software.
A sample of publications related to track geometry:
Andersson, M., Kottenhoff, K., Kufver, B. & Olsson, C. (2001). Monetära komfort-värderingar - Utredning av möjligheterna att kvantifiera resenärernas monetära värderingar av komfort med avseende på underhållsstandard (Monetary assessment of comfort – Feasibility study regarding the possibilities to survey the passengers monetary assessment of comfort due to track irregularities, published in Swedish only). Solna: Transek.
Förstberg, J. & Ledin, T. (1997). Discomfort caused by low-frequency motions. A literature survey of hypotheses and possible causes of motion sickness. VTI meddelande 802A. Linköping: VTI.
Förstberg, J. (2000). Ride comfort and motion sickness in tilting trains - Human responses to motion environments in train and simulator experiments. Doctoral thesis. KTH-TRITA-FKT report 2000:28 Stockholm: KTH.
Gåsemyr, H. & Kufver, B. (1999). Norwegians adapt tracks for tilting trains. International Railway Journal (Vol 39, No. 1) pp 26-27.
Gåsemyr, H. & Kufver, B. (2000). Anpassungen der Gleisgeometrie unter den Gesichtspunkten Zuverlässigkeit und Komfort für Neigezüge in Norwegen. (Published in German only.) ZEV+DET Glasers Annalen (Vol 124 No 2/3) 243-252.
Kufver, B. (1990). Baxning med 3-punkts respektive 4-punktsmetod. (Lining with 3-point and 4-point method, respectively, published in Swedish only.) VTI notat J04. Linköping: VTI.
Kufver, B. (1991). Metoder för koordinatbaserad växelprojektering vid SJ Banavdelning sommaren 1988. (Methods for turnout calculations, based on coordinates, used by SJ department of fixed installations summer 1988, published in Swedish only. Limited distribution.) VTI notat J06. Linköping: VTI.
Kufver, B. (1995a). Koordinatbaserad baxberäkning av pilhöjdsmätta spår. (Slew calculations based on local coordinates derived from versine measurements of railway tracks,
published in Swedish only.) VTI meddelande 754. Linköping: VTI.
Kufver, B. (1995b). Mätning av spårläge och analys av spårlägesdiagram. (Track recording and analysis of track recording diagrams, published in Swedish only.) VTI notat 6-1995. Linköping: VTI. Kufver, B. (1995c). Tillåtna hastighets-överskridanden för tåg av kategori B och kategori S, som funktion av spårets geometriska form. (Enhanced permissible speed for trains with radial steering bogies and for tilting trains, published in Swedish only.) VTI notat 30-1995. Linköping: VTI.
Kufver, B. (1997a). Mathematical description of railway alignments and some preliminary comparative studies. VTI rapport 420A. Linköping: VTI.
Kufver, B. (1997b). Methods for evaluation of ride comfort as a function of vehicle reactions caused by railway alignment. VTI rapport 421A. Linköping: VTI.
Kufver, B. (1997c). Optimisation of single horizontal curves in railway alignments. VTI rapport 424A. Linköping: VTI.
Kufver, B. (1997d). Variables and criteria for evaluation of vehicle reactions caused by railway alignment. VTI notat 43-1997. Linköping: VTI.
Kufver, B. (1998). Realigning railways in track renewals - Methods and objectives. Proceedings. Paper presented at Railway Engineering - 98, 10 July 1998, London, pp 53-57. Edinburgh: ECS Publications. ISBN 0-947644-37-7. Kufver, B. (1999). Realigning railways in track renewals - Linear versus S-shaped superelevation ramps. Proceedings. Paper presented at Railway Engineering - 99, 25-26 May 1999, London. Edinburgh: ECS Publications. ISBN 0-947644-39-3.
Kufver, B. (2000a). Dynamic vehicle reactions on the Ruch type of S-shaped superelevation ramps. Paper presented at Comprail 2000, 11-13 September 2000, Bologna. Southampton: CMP/WIT Press, pp 663-672. ISBN 1-85312-826-0.
Kufver, B. (2000b). Optimisation of clothoid lengths - simulations of dynamic vehicle reactions on horizontal curves
with track irregularities. Proceedings: Railway Engineering - 2000, 5-6 July 2000, London. Edinburgh: Engineering Technics Press. ISBN 0-947644-43-1. Kufver, B. (2000c). Optimisation of horizontal alignments for railways - Procedures involving evaluation of dynamic vehicle response. Doctoral thesis. TRITA-FKT report 2000:47. Stockholm: KTH.
Kufver, B. (2001). Research on track geometry for high-speed trains. Proceedings: Railway Engineering - 2001, 30 April-1 May 2001, London. Edinburgh: Engineering Technichs Press. ISBN 0-947644-45-8.
Kufver, B. (2003). Dynamic vehicle response on short circular curves and tangent tracks. Proceedings: Railway Engineering - 2003, 30 April – 1 May 2003, London. Edinburgh: Engineering Technics Press. ISBN 0-947644-51-2. Kufver, B. & Andersson, E. (1998). Optimisation of the railway alignment considering vehicle reactions. Proceedings. Paper presented at International seminars on Infrastructure and vehicle/ infrastructure interaction, 17-19 February 1998, Hong Kong. The Institution of Civil Engineers.
Kufver, B. & Förstberg, J. (1999). A net dose model for development of nausea. Proceedings. Paper presented at 34th UK Group Meeting on Human Responses to Vibration. 22-24 September, Dunton, England.
Kufver, B. & Förstberg, J. (2001). Research on the specific aspects of tilting. Proceedings: WCRR’2001 World Congress on Railway Research in Cologne, 25-29 November 2001.
Kufver, B. & Gåsemyr, H. (1999). Adaptation of Norwegian tracks to tilting trains - the specific aspects of high speed curving. Paper presented at WCRR '99, World Congress on Railway Research in Tokyo, 19-23 October 1999 Kufver, B. & Rydell, O. (2003). Standard-växel UIC60 1:14 eller specialväxel UIC60 1:15 (Standard turnout UIC60 1:14 versus special turnout UIC60 1:15). Paper presented at the 11th Nordic Seminar on Railway Technology, 31 March - 1 April 2003, Copenhagen, Denmark.
Dynamic vehicle response on horizontal curves without transition
curves, including turnout curves through Swedish UIC60 turnouts
Björn Kufver Ola Rydell
Halcrow Banverket Östra Regionen
Vineyard House, 44 Brook Green Box 1070
Hammersmith, London W6 7BY 172 22 Sundbyberg
United Kingdom SWEDEN
Paper presented at a seminar arranged by the VTI at Nordic Rail in Jönköping 7th-9th October 2003.
Dynamic vehicle response on main line alignments with transition curves and canted circular curves has been investigated in detail in several recent studies. A decision, taken by Banverket (Swedish National Rail Administration) Head Quarters in Borlänge, to reduce the number of turnout types, clarifies the need for similar alignment studies for sidings and curves within turnouts. The present study quantifies the dynamic vehicle response on alignments according to Swedish UIC60 turnouts and com-pares it with the response on other curves without transition curves.
Since 1995, several studies on alignment optimisation have been conducted in co-operation with railway companies in Sweden and Norway. The studies focused mainly on evaluation of alignment alterna-tives fitting the same terrain corridor and included the dynamic vehicle response from both conventional
trains and high-speed tilting trains. Various types of transition curves and superelevation ramps have been compared. Minimum lengths for straight track elements and circular curves, placed between clothoids and linear superelevation ramps, have been studied. Optimal combinations of curve radii and clothoids have been evaluated for tilting and non-tilting trains. These studies were focused on typical main line conditions: Hori-zontal curves that are provided with cant and transition curves and train speeds in the range of 130-260 km/h.
The present study is focused on typical curves within turnouts and curves on sidings. The alignment alternatives consist of combinations of straights and circular curves. The curves are neither canted nor provided with transition curves.
As in earlier Swedish studies, the dynamic vehicle response is quantified through computer simulations with the software GENSYS. The same vehicle models
(the international standard coach “Eurofima” and the Swedish X2000 tilting train) and track model (UIC60 rails with an inclination of 1:30 according to Swedish practice, lumped flexibility in vertical direction 150 MN/m, friction coefficient of 0.4, etc.) are used. In the present study, no track irregularities are superimposed on the nominal track geometry.
The alignment cases that have been studied correspond either to various worst cases for sidings, according to the Swedish track standards, or to the nominal alignment through the diverging track in standard UIC60 turnouts. There are certain discrepancies between the real turnout geometries and the geometries in the present investigation: The rails are not inclined, but vertical, on Swedish standard turnouts. Also, the detailed variations of the rail cross sections through the switch zone and the crossing zone, as well as check rails, are not used in the simulations. Instead, the rail profiles are constant.
This approach is adopted because the focus is on the effects of alignment alterations through turnouts (and not on the detailed geometry of switch blades and common crossings), and also single curves and reverse curves on sidings that do not contain any switches and crossings.
The Swedish track standards permit a cant deficiency of
100-245 mm depending on the
characteristics of the vehicle (non-tilting vs. (non-tilting). If train speed is 100 km/h or lower, an instantaneous change of cant deficiency of 100 mm is permitted (on sidings). For train speeds from 105 km/h to 160 km/h, maximum instantaneous change of cant deficiency on sidings is 80 mm. The concept of virtual transitions (i.e. lateral jerk is calculated as change of acceleration multiplied with train speed and divided with bogie king pin spacing) is not used in Sweden. However, the reduction of permitted instantaneous change of cant deficiency for train speeds above 100 km/h is based on similar thoughts: Without this reduction, the lateral jerk is believed to become unacceptable.
Swedish UIC60 turnouts and cross-overs on tracks with 4.5 m track distance
Basic types of Swedish UIC60 turnouts, with a circular curve only in the diverging track, are as follows:
1:9 R=300 m for V=50 km/h 1:12 R=500 m for V=65 km/h 1:14 R=760 m for V=80 km/h 1:18.5 R=1200 m for V=100 km/h 1:26.5 R=2500 m for V=130 km/h There are also two derived versions where the diverging track consists of a circular curve and a straight:
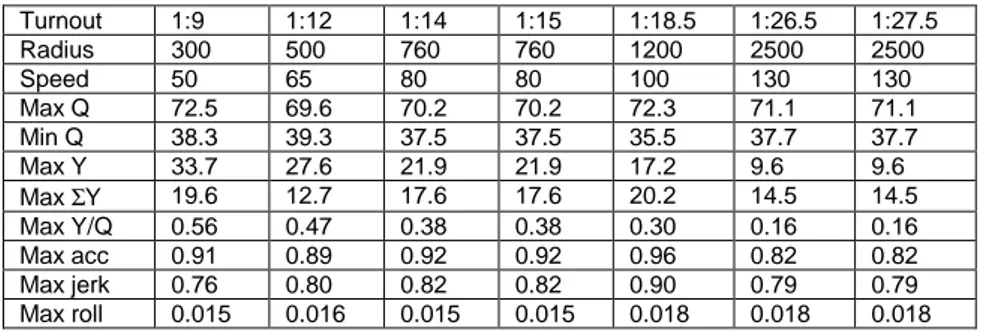
1:15 R=760 m for V=80 km/h 1:27.5 R=2500 m for V=130 km/h Vehicle response has been calculated for these types of turnout geometries, as used in crossovers between tracks with 4.5 m track distance (centre to centre), see Tables 1-2.
The usage of 1:14- and 1:26.5- turnouts on crossovers between track with 4.5 m track distance is not permitted according to Swedish track
standards. The intermediate straight is believed to be too short and give un-favourable vehicle response. This is the justification for the derived versions 1:15 and 1:27.5 from the basic standard turnouts. However, Table 2 shows that the vehicle response on 1:14- and 1:26.5-crossovers is better or only slightly worse than on a 1:9-crossover.
Worst cases of reverse curves according to Swedish track standards for sidings
It has also been considered interesting to study the worst cases of reverse curves without transition curves, where a track is to be shifted 4.5 m in lateral direction. Tables 3-4 show vehicle response on curves with 100 mm cant deficiency and an intermediate straight of 0.10*V [metre per km/h], in certain cases 0.15*V.
Figure 1: Lateral jerk [m/s3] with a 1:14-turnout.
Figure 3: Lateral wheel/rail forces [kN] with a 1:14-turnout.
Cases where a curve continues in the same direction after the heel of a turnout
Banverket Head Quarters in Borlänge has taken the decision to reduce the number of standard turnouts and
according to this decision, 1:14 and 1:26.5 shall not be considered as standard turnouts. In a paper presented at the 11th Nordic Seminar on Railway Technology, it was shown that 1:15-turnouts require more space than 1:14-turnouts in a number of standard cases. Hence, it may be very costly to replace 1:14-turnouts with 1:15-turnouts.
Also, simulations have also shown that dynamic vehicle response on 1:15 followed by a curve in the same direction as the turnout curve becomes very unfavourable. In Figures 1-4, lateral jerk [m/s3] in the vehicle body (three positions), and lateral wheel/rail-forces [kN] (two outer wheels of the first bogie) are plotted against chainage. Dynamic vehicle response on alignments according to UIC60 1:14 are shown to the left, and according to UIC60 1:15 to the right.
Figure 2: Lateral jerk [m/s3] with a 1:15-turnout.
Figure 4: Lateral wheel/rail forces [kN] with a 1:15-turnout.
Discussion
When wheelsets run on a circular curve under steady state conditions, they will move laterally (in relation to track centre line) and take an angle of attack (angle between the wheel direction and the direction of the rail). The displacements depend on factors such as curve radius, suspension between wheelset and bogie, wheel and rail profiles, friction conditions etc. However, when entering the curve, there will be a transient change from the steady state position on the straight to a new steady state position on the curve.
The simulations show that this transient change increase the dynamic lateral wheel/rail forces and the friction work in the wheel/ rail interface compared to the steady state values on the circular curve. Figures 3-4 show the lateral wheel/rail forces (in kN) for two wheels of the Eurofima coach, plotted against chainage. For each curve entry, there is an unfavourable peak load. Such peak loads may be reduced by using transition curves, or by avoiding unnecessary straights between two curves in the same direction. Hence, the decision to cancel 1:14 and 1:26.5 from the standard range of turnouts seems very misguided. Another conclusion is that transition curves should preferably be used also on sidings, even though track standards may permit that horizontal curves are not provided with transitions under certain circumstances.
Tables 1-2 show that geo-metries according to 1:14- and 1:26.5-turnouts gives slightly worse vehicle response than 1:15- and 1:27.5-turnouts, when used in crossovers between tracks with 4.5 m track distance. However, compared to dynamic vehicle response on the alignments in Tables 3-4 (which are permitted according to Swedish track standards), the response on 1:14 and 1:26.5 is better. Hence, the question arises: Are the derived turnouts 1:15 and 1:27.5 really necessary?
Table 1. Dynamic vehicle response (Eurofima coach) on an alignment according to single turnout or first turnout on a crossover.
Turnout 1:9 1:12 1:14 1:15 1:18.5 1:26.5 1:27.5 Radius 300 500 760 760 1200 2500 2500 Speed 50 65 80 80 100 130 130 Max Q 72.5 69.6 70.2 70.2 72.3 71.1 71.1 Min Q 38.3 39.3 37.5 37.5 35.5 37.7 37.7 Max Y 33.7 27.6 21.9 21.9 17.2 9.6 9.6 Max ΣY 19.6 12.7 17.6 17.6 20.2 14.5 14.5 Max Y/Q 0.56 0.47 0.38 0.38 0.30 0.16 0.16 Max acc 0.91 0.89 0.92 0.92 0.96 0.82 0.82 Max jerk 0.76 0.80 0.82 0.82 0.90 0.79 0.79 Max roll 0.015 0.016 0.015 0.015 0.018 0.018 0.018
Table 2. Dynamic vehicle response (Eurofima coach) on an alignment according to second turnout on a crossover with 4.5 m track distance.
Turnout 1:9 1:12 1:14 1:15 1:18.5 1:26.5 1:27.5 Radius 300 500 760 760 1200 2500 2500 Speed 50 65 80 80 100 130 130 Max Q 73.8 69.5 71.2 71.4 74.0 71.9 69.9 Min Q 37.1 41.8 36.1 37.3 34.6 37.3 39.3 Max Y 34.5 26.2 19.8 19.8 14.9 10.9 12.4 Max ΣY 22.4 13.2 18.2 17.6 20.8 16.2 15.1 Max Y/Q 0.63 0.45 0.37 0.35 0.26 0.17 0.20 Max acc 0.97 0.90 0.95 0.90 0.94 0.81 0.76 Max jerk 1.37 1.20 1.51 1.21 1.39 1.18 0.94 Max roll 0.029 0.021 0.028 0.023 0.030 0.028 0.022
Table 3. Dynamic vehicle response (Eurofima coach) on a single curve or the first circular curve on a reverse curve.
Radius 189 295 425 579 756 956 1180 Speed 40 50 60 70 80 90 100 Max Q 74.0 72.9 70.4 69.2 70.2 71.4 72.4 Min Q 37.7 37.9 39.3 39.0 37.4 36.2 36.3 Max Y 42.5 34.0 29.5 25.5 21.9 19.4 17.4 Max ΣY 27.1 20.0 14.5 14.5 17.6 19.5 20.5 Max Y/Q 0.64 0.57 0.50 0.44 0.38 0.34 0.30 Max acc 0.86 0.93 0.89 0.90 0.92 0.95 0.98 Max jerk 0.75 0.78 0.79 0.80 0.82 0.88 0.92 Max roll 0.016 0.016 0.016 0.015 0.015 0.017 0.019
Table 4. Dynamic vehicle response (Eurofima coach) on the second curve on a reverse curve. Radius 295 425 579 756 756 956 1180 Straight 5 6 7 8 12 13.5 15 Speed 50 60 70 80 80 90 100 Max Q 75.2 71.6 69.8 71.4 71.3 73.2 74.6 Min Q 36.6 38.2 38.1 35.8 36.5 34.7 38.2 Max Y 36.8 31.2 26.2 21.5 19.0 14.5 15.0 Max ΣY 23.8 17.5 14.8 18.7 17.7 20.2 21.9 Max Y/Q 0.65 0.56 0.48 0.40 0.34 0.27 0.02 Max acc 1.01 0.93 0.93 0.97 0.93 0.96 0.99 Max jerk 1.53 1.50 1.46 1.54 1.42 1.50 1.54 Max roll 0.033 0.030 0.028 0.029 0.026 0.030 0.032 Remarks to Tables 1-4: Radius = Centre-line radius [m], Straight = Length of intermediate straight [m], Speed = Train speed [km/h], Max Q = Maximum vertical wheel/rail force [kN], Min Q = Minimum vertical wheel/rail force [kN], Max Y = Maximum lateral wheel/rail force [kN], Max ΣY = Maximum track shift force [kN], Max Y/Q = Maximum wheel climbing ratio [-], Max acc = Maximum lateral acceleration in the vehicle body [m/s2], Max jerk = Maximum lateral jerk in the vehicle body [m/s3], Max roll = Maximum roll velocity of the vehicle body [rad/s]. All variables are low-pass filtered. Minimum length of intermediate straight for V=80 km/h is 12 m.
According to the concept of virtual transitions, the lateral jerk should increase linearly with train speed in Table 3. Early German literature indicate that the concept of virtual transitions is based on faulty assumptions, and the dynamic response in Tables 1-4 does not support the assumed vehicle response according to virtual transitions.
The variables describing the motions of the vehicle body (lateral acceleration, lateral jerk and roll velocity) have been low-pass filtered according to CEN standards for comfort evaluation, but also with two other types of filters. The magnitudes of the peak values vary with the used filter, but the conclusions when comparing different alignment alternatives remain the same.
The same type of effect was observed when changing the type of vehicles. The magnitudes of the variables changed, but the pattern remained the same.
Acknowledgements
The simulations have been conducted in co-operation with Division for Railway Technology at the Royal Institute of Technology (KTH), Stockholm. Vehicle models of the Eurofima coach and the X2000 tilting train were provided by Desolver and Bombardier Transportation, respec-tively.
Photos
1. Turnout 1:27.5 in down track in Katrineholm, Sweden. Distances to adjacent tracks are 4.5 m. The reverse curve behind the turnout has the radius R=2500 m. Only the far end of the reverse curve is provided with a transition curve.
2. Scissors crossovers between non-parallel main tracks in Älvsjö, Sweden. The diamond crossing is of type 1:4.44. The turnouts and the double slip are of type 1:9. The turnout to the right has an extended curve with radius R=300 m behind the heel. This extension takes the same angle as the curve in the foreground.
A sample of publications related to track geometry:
Kufver, B. (1997). Mathematical description of railway alignments and some preliminary comparative studies. VTI rapport 420A. Linköping: VTI.
Kufver, B. (1997). Methods for evaluation of ride comfort as a function of vehicle reactions caused by railway alignment. VTI rapport 421A. Linköping: VTI.
Kufver, B. (1997). Variables and criteria for evaluation of vehicle reactions caused by railway alignment. VTI notat 43-1997. Linköping: VTI.
Kufver, B. (1999). Realigning railways in track renewals - Linear versus S-shaped superelevation ramps. Proceedings. Paper presented at Railway Engineering - 99, 25-26 May 1999, London. Edinburgh: ECS Publications. ISBN 0-947644-39-3.
Kufver, B. (2000). Dynamic vehicle reactions on the Ruch type of S-shaped superelevation ramps. Paper presented at Comprail 2000, 11-13 September 2000, Bologna. Southampton: CMP/WIT Press, pp 663-672. ISBN 1-85312-826-0.
Kufver, B. (2000). Optimisation of clothoid lengths - simulations of dynamic vehicle reactions on horizontal curves with track irregularities. Proceedings: Railway Engineering - 2000, 5-6 July 2000, London. Edinburgh: Engineering Technics Press. ISBN 0-947644-43-1.
Kufver, B. (2003). Dynamic vehicle response on short circular curves and tangent tracks. Proceedings: Railway Engineering - 2003, 30 April – 1 May 2003, London. Edinburgh: Engineering Technics Press. ISBN 0-947644-51-2.
Kufver, B. & Andersson, E. (1998). Optimisation of the railway alignment considering vehicle reactions. Proceedings. Paper presented at International seminars on Infrastructure and vehicle/ infrastructure interaction, 17-19 February 17-1998, Hong Kong. The Institution of Civil Engineers.
Kufver, B. & Förstberg, J. (2001). Research on the specific aspects of tilting. Proceedings: WCRR’ 2001 World Congress on Railway Research in Cologne, 25-29 November 2001.
Kufver, B. & Gåsemyr, H. (1999). Adaptation of Norwegian tracks to tilting trains - the specific aspects of high speed curving. Paper presented at WCRR '99, World Congress on Railway Research in Tokyo, 19-23 October 1999.
Kufver, B. & Rydell, O. (2003). Standard-växel UIC60 1:14 eller specialväxel UIC60 1:15 (Standard turnout UIC60 1:14 versus special turnout UIC60 1:15). Paper presented at the 11th Nordic Seminar on Railway Technology, 31 March - 1 April 2003, Copenhagen, Denmark.
Föroreningsnedfall från järnvägstrafik –
Exempel på järnvägsrelaterad miljöforskning
Göran Blomquist, Fil Dr och Mats Gustafsson, Fil Dr
Abstract
Miljö- och hälsorisker orsakade av partikelspridning har uppmärksammats mer och mer de senaste åren. Även järnvägen ger upphov till spridning av partiklar, bland annat har vissa problem med damning påpekats, då främst i samhällen där tågen bromsar in före stationer. Obehaglig lukt och damm som lägger sig över t.ex. parkerade fordon och påverkar lacken är några av de problem som påtalats. Dammet antas härröra från slitage av bromsar, hjul, räls, strömavtagare och strömledning samt uppvirvling av damm på banvallen.
På tre lokaler studerades bulkdeposition med trattar och flaskor samt med vertikalt placerade filter i samma mätpunkter för att samla in luftburna partiklar. På en lokal togs även torvprover för att studera eventuell upplagring av föroreningar i järnvägens närhet. Totalt genomfördes 9 mätomgångar på vardera ca 2 veckor.
Resultaten tyder på att åtminstone 15 metaller i olika grad har järnvägen som källa i någon eller några av de tre försökslokalerna (Fe, As, Pb, Co, Cu, Cr, Mn, Ni, V, Ga, Ge, Nb, Mo, Rh och Sb). Depositionen av de metaller som visar en gradient avtar exponentiellt från järnvägen och har planat ut inom 50-100 meter från järnvägen. Många metallhalter i undersökningen överskrider halterna från en bakgrundslokal (Gårdsjön). I Lund överskrids de i samtliga mätningar, i Vikingstad av de flesta samt i Store Mosse av mer än hälften. Detta pekar dock i sig inte ut järnvägen som ensamt ansvarig, då lokalerna (främst Lund och Vikingstad) ligger i
mer antropogent påverkade omgivningar. Medelhalterna av As, Cd, Co, Cu, Cr, Mn, Ni, Sr och Zn överskrider i Lund halter från urban miljö på Södermalm i Stockholm. Detsamma gäller för As, Pb, Cd, Cr, Mn, Ni och Sr i Vikingstad och på Store mosse för As och Sr. Jämförelse med gränsvärden (gällande tillförsel av avloppsslam till åkermark) visar att depositionen av kadmium och nickel som mest tangerar respektive överskrider gränsvärden. Bly, koppar, krom och zink når som mest upp till ungefär halva gränsvärdet. Spridningen är tydligt relaterad till väder- och trafikförhållanden. Torrare och varmare väder i kombination med högre trafikfrekvens (Lund) ger tydligare samband än fuktigt, kallt väder med låg trafikintensitet (Store mosse). Analyser visar även att vinden är en viktig spridningsmekanism för järnvägsrelaterade metaller.
För att kunna generalisera resultaten från denna pilotstudie till att gälla hela järnvägsnätet krävs ytterligare förståelse av de mekanismer som ligger bakom uppkomsten (slitaget) och spridningen av metallerna.
Referens:
Mats Gustafsson, Göran Blomqvist, Lars Franzén och Bertil Rudell. Föroreningsnedfall från
SPÅRVÄGENS INFRASTRUKTUR
Ragnar Hedström
Statens väg- och transportforskningsinstitut, VTI 581 95 Linköping
e-post: ragnar.hedstrom@vti.se
Inom temat ”Light Rail-Light Cost, del II” genomförs delprojektet ”Spårvägens infrastruktur” vars syfte är att göra en systematisk kartläggning avseende olika spårkonstruktioners för- och nackdelar samt deras funktion ur ett drift- och underhållsperspektiv.
Man kan konstatera att det finns ett flertal olika spårkonstruktioner för spårvägstrafik. Detta beror på att ett flertal faktorer som exempelvis undergrundens beskaffenhet, estetik, buller, vibrationer, ekonomi, etc. måste beaktas när spårvägsspår skall anläggas. Olika spårkonstruktioners fördelar och nackdelar måste beaktas utifrån de förutsättningar som gäller i varje enskilt fall.
En uppdelning i spårvägsspår kan göras med hänsyn till omgivande miljö, där tre olika spårvägsmiljöer kan urskiljas:
- På egen banvall och fysikt avskild från alla annan trafik (utom vid plankorsningar)
- På avskilt spårområde, i gatumiljöer men skilt från övrig trafik genom markeringar eller icke överkörbara fysiska hinder. Banvallen är ofta anpassad för viss trafik med vägfordon som exempelvis utryckningsfordon.
- I gata där spåret utgör en integrerad del av ytan som är avsedd för vägfordon och fotgängare
Vidare kan spårtyper karaktäriseras med avseende på själva spårkonstruktionen där en generell uppdelning kan göras i asfaltspår respektive betongspår.
Asfaltspår är i princip uppbyggt på ett underlag av asfalt på vilket rälen placeras. Mellan rälerna ligger sedan ett lager av grusballast på vilket sedan ett bärlager av asfalt läggs. Ovanpå detta bärlager läggs sedan ett slitlager av asfalt vilket slutar i jämnhöjd med rälens överkant. Betongspårets konstruktion utgörs av en hel betongplatta på vilken rälerna placeras. Mellan rälerna ligger ett lager grusballast och ovanpå detta läggs ett slitlager av fiberarmerad betong som slutar i jämnhöjd med rälens överkant. I vissa fall kan hela materiallagret mellan rälerna upp till rälens överkant utgöras av asfalt trots att underliggande lager är av betong.
En variant av betongspår är det så kallade Edilon-spåret som består av en konstruktion med två betongplattor ovanpå varandra. I den översta betongplattan görs längsgående ursparingar i vilka rälerna sedan placeras.
Det översta slitlagret i konstruktionen kan utgöras av olika typer av material. När det gäller asfaltspår och betongspår består det översta slitlagret oftast av asfalt respektive betong. I förekommande fall kan ytan på detta slitlager utformas på varierande sätt. Exempelvis kan asfalten och betongen färgas i en avvikande färg. Det finns även fall då betongytan ges en mönstrad struktur. Syftet med en avvikande ytstruktur är att öka uppmärksamheten för övriga trafikanter på att det inom detta område förekommer spårvägstrafik.
I så kallade grässpår utgörs det översta lagret i konstruktionen av gräs vilket förutom att vara estetiskt tilltalande även ger en viss ljuddämpning. Gatsten är ett annat material som ofta används som ytskikt i spårvägskonstruktioner.
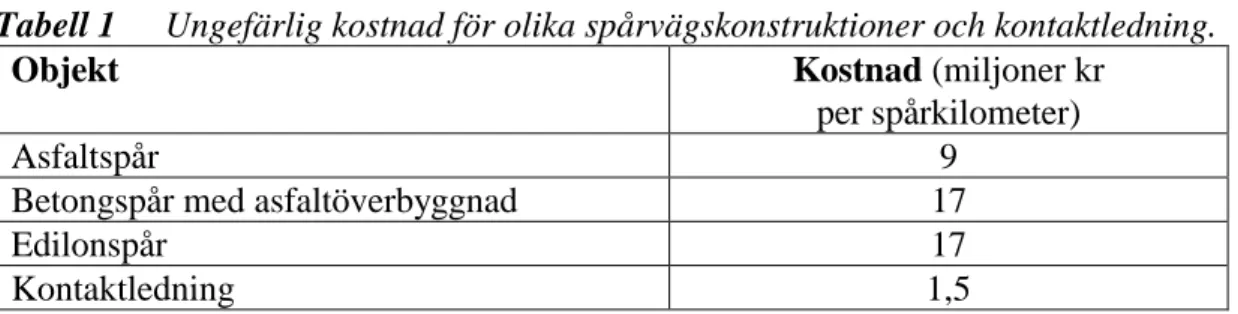
Kostnader
I litteraturen anges ofta totala kostnaderna för en spårvägsanläggning och inkluderar då kostnaderna för både infrastrukturen och fordonen. Även om det i vissa fall går att separera dessa kostnadsposter är det svårt att veta vad som exakt ingår i kostnaden för infrastrukturen men en generell uppfattning är att kostnaden för infrastrukturen utgör ca 75 % och fordonskostnaderna ca 25 % av den totala kostnaden. Även om det kan förekomma viss variation kan man konstatera att infrastrukturen står för en betydande del av den totala investeringskostnaden.
Investeringskostnaden måste ställas i relation till framtida drift- och underhållskostnader. Låga investeringskostnader kan initialt vara attraktivt men kan på sikt medföra höga underhållskostnader och oacceptabla driftstörningar. Dessa driftstörningar drabbar såväl spårvägsresenärerna som andra trafikantgrupper liksom kringboende.
I tabell 1 redovisas ungefärliga kostnader för olika spårvägskonstruktioner och för kontaktledning.
Tabell 1 Ungefärlig kostnad för olika spårvägskonstruktioner och kontaktledning.
Objekt Kostnad (miljoner kr
per spårkilometer)
Asfaltspår 9 Betongspår med asfaltöverbyggnad 17
Edilonspår 17 Kontaktledning 1,5 Kostnaderna för infrastrukturen påverkas av ett flertal faktorer som bl.a. hur stor andel av den
aktuella sträckan som utgörs av konstbyggnader i form av broar och/eller tunnlar. En stor andel konstbyggnader medför av naturliga skäl ökade kostnader för infrastrukturen.
I samband med att spårvägsspår skall anläggas kan det i vissa fall vara nödvändigt att åtgärda befintliga ledningar (el, vatten, avlopp) som kan finnas i marken där spåren skall dras. Detta kan i vissa fall innebära en kostnad som belastar infrastrukturen.
Antalet korsningar och/eller spårväxlar som ingår i anläggningsmassan påverkar också kostnadsbilden. Denna typ av anläggningsdelar är i sig komplicerade och som kan ge upphov till komplicerade och kostnadskrävande lösningar.
Anläggandet av spårvägsspår är till stor del förenat med ett stort ”hantverk” eftersom varje objekt är unikt utifrån de förutsättningar som gäller i varje enskilt fall. Det hantverksmässiga inslaget kräver stora personalresurser och tar mycket tid vilket är kostnadskrävande. I många fall är det även frågan om att bygga i trånga miljöer vilket kan vara tidskrävande. Det kan vara svårt att komma åt med maskiner och avsaknaden av lämpliga upplagsplatser för material och arbetsbodar i närheten av arbetsplatsen kan vålla problem. Att det kan vara trångt om
utrymmet kan bero på att det finns befintliga byggnader i den direkta närheten av spåranläggningen.
Utvecklingspotential
Det ökade intresset för spårvägssystem i kombination med önskemålet att minska kostnaderna kommer, med avseende på infrastrukturen, sannolikt att generera en teknikutveckling både beträffande spårkonstruktioner och beträffande arbetsmetoder.
Ett ökat intresse även för infrastrukturen kan innebära att fler aktörer etablerar sig på marknaden vilket kan komma att påverka konkurrenssituationen och förhoppningsvis bidra till minskade kostnader för infrastrukturen.
Vidare kan man konstatera att ett ökat byggande av spårvägssystem ger mer erfarenheter och kunskap som i sin tur innebär mer samlad kunskap om såväl tekniska lösningar som arbetsmetoder.
Ytterligare en faktor som kan påverka kostnadsbilden är planeringsprocessen. Här finns ett samspel mellan utformningen av förfrågningsunderlag och upphandlingsprocessen. Genom att förfina förfrågningsunderlaget kan korrektare upphandlingar göras utan överraskande kostnader som följd.
SST – Körsimulator för spårburen trafik
Johan Förstberg, VTI
SST
! Nationell basresurs
! Innovation genom samarbete mellan offentliga och privata organisationer ! Medel från offentliga organisationer och privata företag
! Partnerskap mellan deltagarna
! Basversion på PC-plattform kommer att vara skriven i öppen kod
Behov inom följande områden
! Beteendevetenskaplig grundforskning ! Utveckling och användning av ny teknik
! Utvärdering och anpassning av tekniska lösningar ! Utredningar och projekteringar
! Utbildning och träning av förare
Tidplan
! Juni 2003 Etapp 1a modulutveckling ! December 2003 Etapp 1b PC simulator
! December 2004 Prototyp I, dvs. kabin och förarbord finns integrerade men inget rörelsesystem.
! Juni 2005 simulator på rörelseplattform ! December 2005 en fullt validerad simulator
Referenser
Johan Förstberg. Förstudie angående möjligheterna att realisera en
järnvägs-/spårvägssimulator. VTI-notat 5-2002.(2002)
Johan Förstberg och Anders Jansson. Simulatorer för spårburen trafik:
Kompletterande förstudie angående behov av och möjligheterna att realisera en körsimulator för spårburen trafik. VTI notat 24-2003. (2003).
Johan Förstberg (red.) Dokumentation från Workshop angående körsimulator för
järnväg/spårväg: 6 Februari 2002 i Borlänge: Inbjudare var Banverket och VTI. VTI
EUs järnvägsforskning - pågående projekt och framtida inriktning
Bertil HYLÉN
Statens väg- och transportforskningsinstitut, VTI Verksam som nationell expert vid
EUROPEISKA KOMMISSIONEN
GENERALDIREKTORATET FÖR ENERGI OCH TRANSPORT (DG TREN) B-1049 Bryssel
bertil.hylen@cec.eu.int
Transport plays a key role in people’s everyday lives and is a decisive factor in economic competitiveness and employment. The promotion of its sustainable development without sacrificing either economic growth or the freedom of movement is a central objective of European Union (EU) policy. However, it is necessary to ensure a sustainable development of transport by for instance shifting the balance of transport systems to less polluting modes and energy-efficient technologies such as rail.
EU therefore supports railway research as one of several instruments for revitalising the railways. The overall objectives are to improve operational, technical and economic efficiencies so as to make the railways more competitive. For practical reasons the research activities are managed in so-called Framework Programmes (FP), each covers about five years.
FP5 is now operational – among the projects can be mentioned CROBIT; Cross Border Information Technology
PROMAIN; Progress in European Maintenance and Management of Railway Infrastructure SAMRail; Safety Management in Railways
STAIRRS; Strategies and Tools to Assess and Implement noise Reducing measures for Railway Systems
In FP6 DG TREN has chosen to concentrate all its rail research resources (about 35 M€) on rail freight improvement. Previous research, for instance EUFRANET, has shown that freight customers are fairly content with domestic rail freight but that they find international freight quite inadequate in many ways. It is now high time for concrete action in this field. The research will be carried out in two stages,
! the Co-ordination Action (CA) "Implementation of change" to pave the way for ! the Integrated Project (IP), New Concepts for Trans-European Rail Freight Services The call for the CA closes in December 2003 and there is considerable interest in this field to make the evaluation really worth looking forward to! After some preparatory work by the CA the IP will be launched, probably in 2006.
The Research Directorate General (DG RTD) is also heavily involved in rail research, more details will follow in the presentation.
DIRECTORATE GENERAL FOR DIRECTORATE GENERAL FOR DIRECTORATE GENERAL FOR DIRECTORATE GENERAL FOR ENERGY AND TRANSPORT ENERGY AND TRANSPORTENERGY AND TRANSPORT ENERGY AND TRANSPORT
Bertil HYLÉN European Commission
Directorate General for Energy and Transport
DG TREN E2
EU Railway Research
http://europa.eu.int/comm/transport/rail/re search/index_en.htm
DIRECTORATE GENERAL FOR DIRECTORATE GENERAL FOR DIRECTORATE GENERAL FOR DIRECTORATE GENERAL FOR ENERGY AND TRANSPORT ENERGY AND TRANSPORTENERGY AND TRANSPORT ENERGY AND TRANSPORT
Transport is important - but
present development is not sustainable
We need
- Less congestion
- Less pollution
- Fewer accidents
DIRECTORATE GENERAL FOR DIRECTORATE GENERAL FOR DIRECTORATE GENERAL FOR DIRECTORATE GENERAL FOR ENERGY AND TRANSPORT ENERGY AND TRANSPORTENERGY AND TRANSPORT ENERGY AND TRANSPORT
Rail can do this!
BUT
Rail is losing ground
-- Falling market share
- Old fashioned image
- Potential not exploited
DIRECTORATE GENERAL FOR DIRECTORATE GENERAL FOR DIRECTORATE GENERAL FOR DIRECTORATE GENERAL FOR ENERGY AND TRANSPORT ENERGY AND TRANSPORTENERGY AND TRANSPORT ENERGY AND TRANSPORT
Rail research is needed to
• Test and implement existing policies
and develop new policies
• Put rail on the right track
(Policy links - DG TREN,
DIRECTORATE GENERAL FOR DIRECTORATE GENERAL FOR DIRECTORATE GENERAL FOR DIRECTORATE GENERAL FOR ENERGY AND TRANSPORT ENERGY AND TRANSPORTENERGY AND TRANSPORT ENERGY AND TRANSPORT
Co-ordination Action (CA)
• Implementation of change in the
European Railway System
(call closes 17 Dec. 2003)
EU Budget 5 – 10 M €
DIRECTORATE GENERAL FOR DIRECTORATE GENERAL FOR DIRECTORATE GENERAL FOR DIRECTORATE GENERAL FOR ENERGY AND TRANSPORT ENERGY AND TRANSPORTENERGY AND TRANSPORT ENERGY AND TRANSPORT
CA Part A - Feeding the change
• Creation of a knowledgebase for
decision support in Railway
management and legislation
• Reasons for different speed of
implementation of innovations in MS
• Balancing the costs and benefits of
DIRECTORATE GENERAL FOR DIRECTORATE GENERAL FOR DIRECTORATE GENERAL FOR DIRECTORATE GENERAL FOR ENERGY AND TRANSPORT ENERGY AND TRANSPORTENERGY AND TRANSPORT ENERGY AND TRANSPORT
CA Part B - Analysis and Assessment
• Analyse business cases for
international freight services
• Assess tools and means to overcome
barriers for implementation of freight
services
• Define quality standards for the freight
services
DIRECTORATE GENERAL FOR DIRECTORATE GENERAL FOR DIRECTORATE GENERAL FOR DIRECTORATE GENERAL FOR ENERGY AND TRANSPORT ENERGY AND TRANSPORTENERGY AND TRANSPORT ENERGY AND TRANSPORT
CA Part C - A dedicated freight network
• Suggest solutions to overcome barriers
for implementation of innovative
developments
• Suggest the tools for monitoring of
services
• Define concept for developing a
DIRECTORATE GENERAL FOR DIRECTORATE GENERAL FOR DIRECTORATE GENERAL FOR DIRECTORATE GENERAL FOR ENERGY AND TRANSPORT ENERGY AND TRANSPORTENERGY AND TRANSPORT ENERGY AND TRANSPORT
Integrated Project
“New Concepts for Trans-European Rail
Freight Services”
EU Budget 25 – 30 M €
DIRECTORATE GENERAL FOR DIRECTORATE GENERAL FOR DIRECTORATE GENERAL FOR DIRECTORATE GENERAL FOR ENERGY AND TRANSPORT ENERGY AND TRANSPORTENERGY AND TRANSPORT ENERGY AND TRANSPORT
Rail freight's market share has dropped!
Because of
•High costs
•Slow transport
•Bad reliability
DIRECTORATE GENERAL FOR DIRECTORATE GENERAL FOR DIRECTORATE GENERAL FOR DIRECTORATE GENERAL FOR ENERGY AND TRANSPORT ENERGY AND TRANSPORTENERGY AND TRANSPORT ENERGY AND TRANSPORT
And why?
-Insufficient co-operation
-Incompatible technologies
-Incompatible rules
-Not enough innovation
-Not enough “drive”
DIRECTORATE GENERAL FOR DIRECTORATE GENERAL FOR DIRECTORATE GENERAL FOR DIRECTORATE GENERAL FOR ENERGY AND TRANSPORT ENERGY AND TRANSPORTENERGY AND TRANSPORT ENERGY AND TRANSPORT
Is there any hope?
- Speaking against rail;
Industry changes from coal to chips
Speaking for rail;
+Longer EU hauls,
DIRECTORATE GENERAL FOR DIRECTORATE GENERAL FOR DIRECTORATE GENERAL FOR DIRECTORATE GENERAL FOR ENERGY AND TRANSPORT ENERGY AND TRANSPORTENERGY AND TRANSPORT ENERGY AND TRANSPORT
Huge variations in performance,
price, speed, reliability etc
Good examples exist and more are
developed
Enlargement brings more
trade/freight
High time to pull together!
DIRECTORATE GENERAL FOR DIRECTORATE GENERAL FOR DIRECTORATE GENERAL FOR DIRECTORATE GENERAL FOR ENERGY AND TRANSPORT ENERGY AND TRANSPORTENERGY AND TRANSPORT ENERGY AND TRANSPORT
Scope of the Integrated Project
Demonstrate improved freight in
selected corridors
Focus on rail issues (but don’t forget
intermodal matters)
Set examples for the future
Recover lost ground
DIRECTORATE GENERAL FOR DIRECTORATE GENERAL FOR DIRECTORATE GENERAL FOR DIRECTORATE GENERAL FOR ENERGY AND TRANSPORT ENERGY AND TRANSPORTENERGY AND TRANSPORT ENERGY AND TRANSPORT
* Two/Three corridors
(the longer the better)
* Rule out hopeless markets
* Find “dormant” markets
* Where is rail most competitive?
* Expansion - and fast!
DIRECTORATE GENERAL FOR DIRECTORATE GENERAL FOR DIRECTORATE GENERAL FOR DIRECTORATE GENERAL FOR ENERGY AND TRANSPORT ENERGY AND TRANSPORTENERGY AND TRANSPORT ENERGY AND TRANSPORT
![Figure 2: Lateral jerk [m/s 3 ] with a 1:15-turnout.](https://thumb-eu.123doks.com/thumbv2/5dokorg/4743384.125855/16.892.605.838.572.912/figure-lateral-jerk-m-s-turnout.webp)