ISSN 0347-6049
F V77särtryck
128 1989
The influence of noise, infrasound and
tem-perature on driver performance and
wakeful-ness during standardized conditions
Lena Nilsson, Bertil Morén, Jan Törnros and Ulf Landström
Reprint from Proceedings of The Third Internationa/ Conference
on the Combined Effects of Environmental Factors held in Tam
pere, Fin/and, 75 - 78 August 7988, pp 77 7- 733
w Väg-00,1 Trafilr- Statens väg- och trafikinstitut (VTI) . 581 01 Linköping
728 1989
The influence of noise, infrasound and
tem-perature on driver performance and
wakeful-ness during standardized conditions
L ena Nilsson, Bertil Morén and Jan Törnros, Road User and
Vehicle Division, Swedish Road and Traffic Research lnstitute,
S -587 07 Linköping, Sweden
Ulf Landström, Technical Unit, National lnstitute of Occupational
Health, Box 6 704, S 900 06 Umeå, Sweden
Reprint from: Recent A dvances in Researches on the Combined
Effects of Environmental Factors, edited by Olavi Manninen
Proceedings of The Third International Conference on the Combi
ned Effects of Environmental Factors held in Tampere, Finland,
75 - 78 August 7988, pp 777 733
%li,Väg 06/7 a /(' Statens väg- och trafikinstitut ( VTI) 58 7 01 Linköping
THE INFLUENCE OF NOISE, INFRASOUND AND TEMPERATURE ON DRIVER PERFORMANCE AND WAKEFULNESS DURING STANDARDIZED CONDITIONS
Nilsson L(l), Morén B(1), Törnros J(1) and Landström U(2). (1) Road User and Vehicle Division, Swedish Road and Traffic
Research Institute, 8-581 01 Linköping, Sweden
(2) Technical Unit, National Institute of Occupational Health, Box 6104, 8 900 06 Umeå, Sweden
ABSTRACT
Young healthy students were exposed to different combina tions of noise, infrasound and temperature, while they were driving in a simulator. The levels of the environmental vari ables were of orders which occur in real traffic. Speed and lateral position on the road, together with stimuli induced reaction times, were recorded as driving performance measures. For the assessment of wakefulness EEG, ECG and EOG were record ed. The subjects became most sleepy when the levels of both infrasound and temperature were increased and noise remained at a low level. This environmental condition also showed amongst the largest increases in speed and lateral position variabi lities, as did the two environments characterized by increased noise and increased infrasound levels, respectively. The larg est prolongation in brake reaction time was obtained when only the noise level was increased, although a prolongation was detected for all the environmental conditions.
INTRODUCTION
The working environment of professional drivers has been brought to the fore during recent years. The drivers are
factors like noise, infrasound, thermal climate and vibrations. Because these factors are thought to deteriorate performance and wakefulness, the question whether increased accident risk is related to the exposure to specific environmental factors has been stressed, but not satisfactorily answered. It has also been pointed out that the knowledge of effects of sleepiness and impaired performance on traffic safety is insufficient.
In laboratory studies, exposure to low levels of low frequency noise and vibrations has been shown to cause sleepi ness, while exposure to high frequency as well as high level noise has been shown to wake people up (Landstrom and Lundström 1985, Landström et al. 1985). Very few studies have been con-ducted to appoint relationships between degree of wakefulness, driver performance and accident risk. A strong interactive effect of noise and infrasound was, however, obtained for both speed holding and lateral position in a study carried out in a driving simulator (Sandberg, 1983). In the same study, increas ed levels of infrasound caused deteriorations in all perform-ance measures, including brake reaction times, during the second half of the experiment. Increased levels of high frequ ency noise and vibrations resulted in improved steering preci sion.
Results obtained from controlled conditions in laboratory studies can usually not be used to predict effects in real
traffic situations. The effect of reduced wakefulness caused by low frequency noise is, however, supported by results from
field studies of truck drivers (Landstrom et al. 1987). Other wise the lack of field studies, considering the effects of
environmental factors on driver performance and wakefulness, is pronounced.
The thermal climate at the driver's seat is in most
vehicles room and timevarying within wide intervals, and thus constitutes a large problem of comfort. Although bus drivers have reported deteriorations in their own performance during warm summer days, when compared to their performance during
comfortable conditions (Lovsund 1980), the influence of thermal exposure on driver performance is more or less unknown. There
are indications that the ability to discover events in the peripheral visual field can be impaired during exposure to heat, and that heat and noise can interact to influence per-formance and wakefulness. Decreased skill and perper-formance in warm conditions have been reported from other working areas
than driving, for instance factory work (Meese et al. 1982). The aim of the present study was to investigate the effects of noise, infrasound and temperature on driver per formance and wakefulness during controlled driving and environ mental conditions in a driving simulator. The chosen environ mental conditions are combinations of realistic levels of the three environmental variables.
MATERIAL AND METHODS
Driving simulator
The VTI driving simulator is an advanced simulator, which consists of a moving base system, a wide angle visual system, a vibration generating system, a sound system and a temperature
regulating system (Nordmark et al. 1986, Nordmark et al. 1988). These five subsystems can be controlled to co operate in a way that gives the driver an impression which is very much alike that of real driving. The time delay introduced by the simu lator is approximately 40 ms, divided into 20 ms computer cycling time and 20 ms delay in the parallel moving base and visual systems. With this very fast dynamic response the VTI driving simulator fulfils the crucial requirement that
simulator time lags must be short compared to lags of an ordin ary vehicle (100 250 ms).
The moving base system has three main degrees of freedom (fig. 1). Thus it can simulate accelerations in different di
rections through rotations (roll, pitch) and linear motion
(lateral) of the cabin. Lateral inertia forces are simulated by
combinations of linear motion and roll according to a control strategy, while longitudinal accelerations are simulated simply by tilting the cabin a certain pitch angle. Pitch and roll
of a wagon, on which the cabin is mounted, takes place along rails and is chain driven from another hydraulic motor. The simulator allows maximum roll and pitch angles of 24° with the maximum velocities 0.5 and 1.3 rad/s respectively, and lateral excursions of up to i 3 m with a maximum velocity of 2.5 m/s. According to the motion- and velocity ranges the simulated
accelerations are limited to 0.4 g.
Fig. 1. VTI driving simulator including a moving base system with 3 degrees of freedom.
In the visual system an image is generated in real time in a specially designed and fast image processor, controlled from a main computer. The image is transformed to standard video
signals, which are updated every 20 ms. The video pictures are
(via three TV projectors) presented to the driver as a continu-ously varying scenario on a screen. The screen is mounted 2.5 m in front of the driver, a distance corresponding to a 120°
field of vision. In the visual system a rather realistic road surface can be generated, simulating a variety of road con ditions. Also, the horizontal and vertical curvature can be continuously varied, with a maximum road sight distance of 3000
m. Different kinds of road details (lines, wheel tracks, macro texture) as well as road types (asphalt highway, narrow gravel road) can be simulated and the sight conditions can be varied (clear day, fog, darkness).
For the vibration system, producing road Vibrations (as well as roll and pitch), the cabin itself is mounted on three hydraulic actuators with a maximum stroke length of i 5 cm. An appropriate vibration spectrum can be generated by solving a mathematical vibration model, of the tested vehicle, in real time and with actual road profile data as input values. Another way of simulating a representative vibration spectrum is to use vertical acceleration data measured in a real vehicle. The
acceleration data are in this case transformed into time vary ing positional data, which are used to control the actuators. Any vibration spectrum can be generated as long as it falls within the capabilities of the actuators.
The sound system provides the driver with important infor mation necessary for instance for speed control. The system consists of six sound Channels. For noise generation two treble speakers are placed on the dashboard in front of the driver and two bass midrange speakers are placed on the wheel housings. Besides, two pairs of large loud speakers are placed behind the driver in the cabin and allow generation of high level (>112 dB(Gl)) low-frequency sounds (infrasounds). The noise pattern generated in the simulator today are sound spectra recorded during real driving, which have been sampled and stored in digital form. It is, however, possible to create any desired sound spectrum.
The temperature system consists of a closed system, where temperature controlled water is circulated. In a computer con trolled feedback loop the air temperature in the cabin is recorded and fed back to a control unit, which sets the water temperature to an appropriate value. The cabin temperature can be set to any value from 18°C to 32°C with an accuracy of i
O.5°C. The maximum response time is of the order of magnitude
Subjects
Forty eight students (32 males and 16 females) volunteered for the experiments. Their ages ranged from 19 to 39 years with a mean of 24 years. All the subjects were healthy with normal hearing (tested) and sight, and none was taking any medication. Also, all the subjects had a driving licence and were relative
ly experienced drivers. They were informed of the nature and the purpose of the study. Each subject only participated once, i.e. was exposed to only one of the environmental conditions. Before their participation in the actual experiment, the sub jects trained "simulator-driving" on three different occasions.
Experimental conditions
The EEEQ that was presented to the subjects was a two
lane, 7 m wide asphalt road, rather straight but containing both horizontal and vertical curves. The most appropriate description of the road would be an "easily driven" road. It was expected to cause an unaffected driver no problems with
road-following. The simulated weather conditions could be characterized as a cloudy Swedish summer-day.
The subjects' primary task during the experiment was to keep the "car" within the right lane. They should also keep the speed at 90 km/h and, as an attentional task, react on visual stimuli by braking as fast as possible. The stimuli (light flickering squares) appeared on the screen randomly in time, with an approximate mean frequency of 5 stimuli/10 minutes. Four different, predescribed stimuli positions were used, two in the central part and two in the peripheral part of the visual field. A second attentional task was also included,
where the drivers had to blow the horn immediately when a cross appeared in the right peripheral part of the screen. Also the cross stimulus appeared randomly in time with an approximate mean frequency of 1 stimulus/30 minutes.
While driving, the subjects were exposed to different environmental conditions, i.e. combinations of noise, infra sound and temperature. Two values of each environmental variable, representing low and high levels measured in real
traffic, were used. The values were: noise 65 and 80 dB(A), infrasound 98 and 112 dB(Gl) and temperature 21 and 28°C. A constant vibration level (0.3 m/s2 rms) was present throughout all experiments to increase the realism. The vibration spectrum was similar to that of a passenger car. Considering the
environmental variables and the hypothesis of the study an experimental design, which included eight different conditions with six subjects exposed to each condition, was chosen (fig.
2). This design makes it possible to study main effects as well as interactions between the independent environmental
variables. Temperature Low High Low noise 1 5 Low infrasound Low noise 2 6 High infrasound High noise 3 7 Low infrasound High noise 4 8
High infrasound
Fig. 2. The 8 combinations of noise, infrasound and temperature, to which the subjects were exposed. Driving performance measures
Lateral position, speed and stimulus induced reaction times were used as performance measures. Both measurements and stimulations were controlled from the main computer.
Speed (km/h) was sampled with 2 Hz and mean values and variability (SD) were calculated for 15 min periods.
Lateral position (m) on the road was measured in relation to a zero position, defined as the position where the central
line of the road coincide with the central line through the driver's body. An actual position on the "road" was thus detected as a slight displacement from zero-position. The lateral position was sampled with 2 Hz and mean values and variability (SD) were calculated for 15 min periods.
Brake reaction time (s) was calculated as the time elap sing from the onset of a flickering square until the brake
pedal was depressed 10 mm or more. In the same way the blow
reaction time (s) was calculated as the time taken from the onset of a cross stimulus until the horn was activated. The
resolution of both time measures was 20 ms. If no reaction had been detected within 5 s the stimulus was regarded as unanswer ed and put out (but recorded as an undiscovered stimulus).
A 10 min standard reaction time test (RT test) was con ducted using a special equipment (not controlled from the main computer). The subjects had to push a button on a panel, when a diode lamp (LED) on the panel was switched on. The LED was
randomly lit 16 times/minute. This task was carried out twice during the experiment.
Wakefulness measures
EEG, ECG and EOG signals were recorded, by an equipment consisting of preamplifiers, amplifiers and a tape recorder
(TEAC HR 30 G), placed beside the driver in the driving simu lator. The physiological signals were computer analysed and used as wakefulness measures (Landström et al. 1987).
The Egg electrodes were applied at positions P4 O2 in the 10 20 system. As a reference the EEG activity was recorded for
3 min with open eyes and for 3 min with closed eyes before the experiment. The EEG recordings from the exposure phase (fig. 3) were subject to Spectral analysis (FFT) and power values for the alpha activity (8 12 Hz) were created for successive 3 sec periods. Those power values that exceeded 25 % of the maximum value were selected and counted. The numbers (of power values above the 25 % level) were calculated for 15 min periods, and normalized by setting the highest number to 100% and recalcul ating the others in relation to that. Increased alpha activity
recorded for open eyes is considered to reflect decreased wakefulness.
The Egg was recorded during the exposure phase by
elec-trodes applied to the chest wall. The recorded signals were fed
to a level detector, where pulses above a preset level passed and were counted as the heart rate (HR). Mean values of HR were calculated for 15 min periods.
The Egg electrodes were applied in diagonal position over the eyes. The EOG recordings were used to identify periods of closed eyes and sleep, which were eliminated from the analysis of alpha activity.
Miscellaneous measures
Audiometry was carried out, before and ca 3 min after ex posure, to observe possible temporary hearing losses caused by the exposure. A Bekesy audiometer (Model BAZ, Interacoustics, Assens, Denmark) was used. Questionnaires were given to the
subjects twice to detect their subjective evaluations of sleep iness and impaired performance.
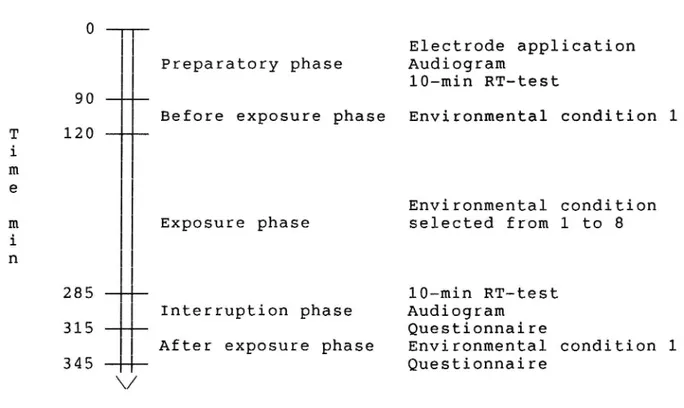
Experimental procedure
Each experiment lasted approximately six hours, which was divided into five phases (fig. 3). First, the preparatory phase took place with the subject in the laboratory. Electrodes for ECG, EEG and ECG detections were applied and reference record ings made. Audiometry and the lO min RT test were also carried out. Next, the subject entered the simulator and the before exposure phase was conducted. The subject carried out the
experimental tasks, while exposed to environmental condition 1. During the third phase, the exposure phase, the subject
continued to drive, but were exposed to an environmental
condition randomly selected from conditions 1 to 8. Driving was
interrupted after 2 h 45 min. This interruption phase included
a lO-min RT test, with the subject in the cabin and still
exposed to the selected environmental condition, audiometry and questionnaire answering. During the after exposure phase the
subject drove with environmental condition 1 present in the cabin and, finally, answered another questionnaire.
O
Electrode application Preparatory phase Audiogram
lO min RT test 90
Before exposure phase Environmental condition 1 T 120
i m e
Environmental condition
m Exposure phase selected from 1 to 8
1 n
285 10 min RT test
Interruption phase Audiogram
315 Questionnaire
After exposure phase Environmental condition 1
345 Questionnaire
\/
Fig. 3. Protocol for the experimental procedure.
RESULTS
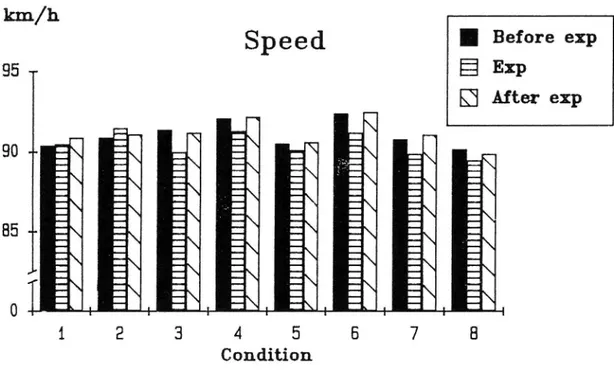
Recorded speeds and lateral positions are shown (in
figures 4 and 5 respectively) for the different environmental conditions. The speed means show that the instruction to hold 90 km/h is well obeyed. Besides, the speed is lowered during the exposure phase for all conditions except 1 and 2. The maximum decreases are of the order 1.4 km/h and obtained for conditions 3 and 6. There is also a tendency that the speed returns to "before level" after exposure. The mean values of lateral position show that the subjects keep the vehicle well within the right lane throughout all experiments. The vehicle
is, however, placed more to the left during the exposure
phase, when compared both to before and to after exposure
positions. The maximum differences in lateral position between experimental phases are of the order 0.1 m.
km/h
Speed . Before exp
95 -
å Exp
Q After exp
t h i s __ , is < . ' . 4 5 ConditionFig. 4. Speeds before, during and after exposure to each of the combinations of noise, infrasound and temperature. Each bar represents the total mean for a particular experimental phase.
. Before exp
& EXP
Lateral p081tlon
& After exp
4 5
Condition
Fig. 5. Lateral positions before, during and after exposure to each of the 8 combinations of noise, infrasound and temperature. Each bar represents the total mean for a particular experimental phase. Higher values indicate a position more to the right.
Fig. Fig. 6. 7.
km/h
Speed variability
4 T
. Before exp
& Exp
3 "
E
9 After exp
2-~
x
*X
\
\
N
1
\
\
N
\
x
x
0 4 . 1 2 3 4 5 6 7 8 ConditionSpeed variability before, during and after exposure to each of the 8 combinations of noise, infrasound and temperature. Each bar represents the total mean for a particular experimental phase.
Lateral position
m . . .
0 3
varlabihty
. Before exp
' "
å Exp
5
[S] After exp
0,2 --
\
E
\
ä
x
x
\
x
\
\
0.1 --
N
\
x
N
x
N
NN
'\
\.
N
VN '\ \ OJ \** ' e 41
3
4
5
8
ConditionLateral position variability before, during and after exposure to each of the 8 combinations of noise, infra sound and temperature. Each bar represents the total mean for a particular experimental phase.
The variabilities in speed and lateral position (calcu lated as means of the standard deviations for 15 min periods) are shown in figures 6 and 7, respectively. For all environ mental conditions the variability in speed as well as in
lateral position has its maximum during the exposure phase. The largest increases in variability are, also for both measures, obtained for conditions 2, 3 and 6. The maximum speed tions are of the order 0.9 km/h and the maximum position varia-tions are of the order 0.07 m.
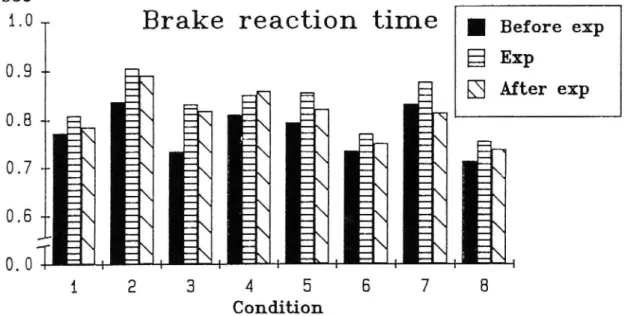
Brake reaction time (fig. 8) is prolonged during the exposure phase for all environmental conditions. The largest prolongation (99 ms) is recorded for condition 3.
SEC
1.0 ..
Brake reaction time
Before exp
0 9 __ _ Exp
EZ
HÄ
DI
After exp
0.8
/ / / / / ' 1 / / ' , / / /' // / ./ / J/ x0.0
J-ConditionFig. 8. Brake reaction time before, during and after exposure to each of the 8 combinations of noise, infrasound and temperature. Each bar represents the total mean for a particular experimental phase.
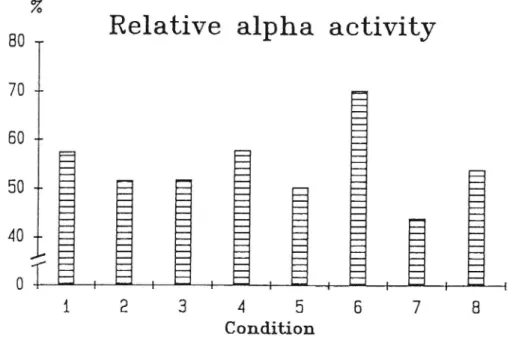
Relative alpha activity (fig. 9) reaches by far the high est value (70 %) for condition 6, while the heart rate (fig. 10) is highest (82 beats/min) for condition 8.
80 -.
Relative alpha activity
70 -~
60
Il
ll
ll
lI
HH
HH
HH
HI
II
II
TT
H
i 2 3 4 5 Condition C D \ J ( D
Fig. 9. Relative alpha activity during exposure to each of the 8 combinations of noise, infrasound and temperature. Each bar represents the total mean for the exposure phase.
B¢.==ats1/1 ttin
Heart rate
90 »
80 »
2
70 --
å
=
å
ä
å
å
5
60 __ g g % ä .5. .'--.-' å ä
g .s. å ä å ä ä %
50 - -_.'.'
5
E
E
E
E
E
E
1 2 3 4 5 5 7 B ConditionFig. 10. Heart rate during exposure to each of the 8 combina tion of noise, infrasound and temperature. Each bar represents the total mean for the exposure phase.
DISCUSSION
Recorded differences in speed variability, lateral posi tion variability and brake reaction time between "exposure" and "before exposure" are relatively small, but appear for all
environmental conditions. All the recorded changes in variabi lities and reaction time are increases, which return towards or even beyond "before exposure levels" during the "after expo sure" phase. Also, basal speed and position data show similar patterns, with decreased speed and a more left-oriented vehicle position during "exposure", for all environmental conditions. Such general reaction patterns point towards an environmental influence on the driver's performance. The environments where noise alone, infrasound alone and infrasound plus temperature are high caused the strongest influence in most of the
performance measures. As far as comparisons are possible this supports earlier results (Sandberg 1983, Meese et al. 1982, Lövsund 1980). Besides the deterioration in performance the combination of high infrasound and high temperature also resulted in the lowest relative wakefulness recorded in our study. The environments characterized by high noise and high infrasound, respectively, resulted on the contrary in compara tively high relative wakefulness. The results in terms of wake fulness partly support the studies by Landström et al. (1987) and Landström et al. (1985).
A more detailed and statistical evaluation of data is in progress. The described, basal results will in future
reports be supplemented with results from statistical analysis, where variations in time and inter individual differences will be taken into account. Interactive effects and significance levels will be reported.
REFERENCES
Landström U, Byström M, Nordström B (1985) Changes in wakeful-ness during exposure to noise at 42 Hz, 1000 Hz and indi vidual EEG frequencies. J Low Frequency Noise & Vibra tion, 4(1), 27 33.
Landström U, Lundström R (1985) Changes in wakefulness during exposure to whole body vibration. Electroencephalography
and Clinical Neurophysiclogy, 61, 411 415.
Landström U, Lindblom Häggqvist S, Löfstedt P (1987) Low frequency noise in lorries and correlated effects on drivers. Proceedings of the 4th International Meeting on Low Frequency Noise and Vibration, Umeå, Sweden, 9 11 June,1987, pp 2.4.1 2.4.11.
Lövsund P (1980) Bussförares arbetsmiljö: En sommarklimat studie. VTI rapport 206, Swedish Road and Traffic Research Institute (Summary in English).
Meese GB, Kok R, Lewis MI, Wyon DP (1982) Effects of moderate cold and heat stress on factory workers in South Africa. S African J Science, 78, 189 197.
Nordmark S, Jansson H, Lidström M, Palmkvist G (1986) A moving base driving simulator with wide angle visual system (TRB Conference Session on "Simulation and Instrumentation for the 80s" 64th Annual Meeting, Transportation Research Board, Washington D.C., 14 18 January 1985). VTI särtryck 106A, Swedish Road and Traffic Research Institute.
Nordmark S, Jansson H, Lidström M, Palmkvist G (in press 1988) The VTI driving simulator - Recent developments. Swedish Road and Traffic Research Institute.
Sandberg, U (1983) Combined effect of noise, infrasound and vibration on driver performance. VTI särtryck 86, Swedish Road and Traffic Research Institute.
ACKNOWLEDGEMENTS
This study was financially supported by grants from the Swedish Work Environment Fund, the Swedish Transport Research Board, Volvo (Bus, Car and Lorry Corporations), Scania (Bus and Lorry Corporations) and Säffle Karosseri AB.