School of Innovation, Design and Engineering
How to calculate forecast
accuracy for stocked items with
a lumpy demand
- A case study at Alfa Laval
Master thesis
Advanced level, 30 credits
Product and process development Production and logisticAbstract
Inventory management is an important part of a good functioning logistic. Nearly all the literature on optimal inventory management uses criteria of cost minimization and profit maximization. To have a well functioning forecasting system it is important to have a balance in the inventory. But, it exist different factors that can results in uncertainties and difficulties to maintain this balance. One important factor is the customers’ demand. Over half of the stocked items are in stock to prevent irregular orders and an uncertainty demand. The customers’ demand can be categorized into four categories: Smooth, Erratic, Intermittent and Lumpy. Items with a lumpy demand i.e. the items that are both intermittent and erratic are the hardest to manage and to forecast. The reason for this is that the quantity and demand for these items varies a lot. These items may also have periods of zero demand. Because of this, it is a challenge for companies to forecast these items. It is hard to manage the random values that appear at random intervals and leaving many periods with zero demand.
Due to the lumpy demand, an ongoing problem for most organization is the inaccuracy of forecasts. It is almost impossible to predict exact forecasts. It does not matter how good the forecasts are or how complex the forecast techniques are, the instability of the markets confirm that the forecasts always will be wrong and that errors therefore always will exist. Therefore, we need to accept this but still work with this issue to keep the errors as minimal and small as possible. The purpose with measuring forecast errors is to identify single random errors and systematic errors that show if the forecast systematically is too high or too low. To calculate the forecast errors and measure the forecast accuracy also helps to dimensioning how large the safety stock should be and control that the forecast errors are within acceptable error margins. The research questions answered in this master thesis are:
· How should one calculate forecast accuracy for stocked items with a lumpy demand? · How do companies measure forecast accuracy for stocked items with a lumpy demand,
which are the differences between the methods?
· What kind of information do one need to apply these methods?
To collect data and answer the research questions, a literature study have been made to compare how different researchers and authors write about this specific topic. Two different types of case studies have also been made. Firstly, a benchmarking process was made to compare how different companies work with this issue. And secondly, a case study in form of a hypothesis test was been made to test the hypothesis based on the analysis from the literature review and the benchmarking process.
The analysis of the hypothesis test finally generated a conclusion thatshows that a combination of the measurements WAPE, Weighted Absolute Forecast Error, and CFE, Cumulative Forecast Error, is a solution to calculate forecast accuracy for items with a lumpy demand. The keywords that have been used to search for scientific papers are: lumpy demand, forecast accuracy, forecasting, forecast error.
Acknowledgement
The master thesis was executed at Alfa Laval AB in Tumba, Stockholm.
The thesis includes 30 credits and is written as a final exam at the engineering program with specialization on Production and logistics at Mälardalens University in Eskilstuna.
I want to thank all those who have supported me through this work. Thanks, to the employees at Alfa Laval that with open arms made me feel welcomed, gave me new experiences and have made my execution of the master thesis to a memory for life. Thanks, to my family, classmates and other friends for the support and knowledge you have contributed with. Thanks, to the companies that have been a part of the benchmarking process. You all have been a major contributing factor to my final results.
A special thanks, I want to give to my supervisor at Alfa Laval, Alexandra Essén, and to my supervisor at Mälardalens University, Antti Salonen. The knowledge and support you have contributed with, I will keep forever. Thank you!
Eskilstuna, Sweden, 2015 Elsa Ragnerstam
Contents
1 Introduction 1
1.1 Background 1
1.2 Problem formulation 2
1.3 Purpose and research questions 3
1.4 Thesis limitations 3
2 Approach and methodology 4
2.1 General about research study 4
2.1.1 Overall approach 5
2.2 Data collection 5
2.2.1 Literature review 5
2.2.2 Benchmarking 6
2.2.3 Hypothesis test 9
2.3 Qualitative and quantitative research 10
2.3.1 Qualitative research 10
2.3.2 Quantitative research 10
2.4 Validity and reliability 11
2.4.1 Validity 11
2.4.2 Reliability 12
3 Theoretical framework 14
3.1 Logistic and the logistic system 14
3.1.1 Inventory and working capital 15
3.1.2 Delivery service 16
3.1.3 ABC-classification 17
3.2 Forecasting 18
3.2.1 Modeling and categorizations of demand 18
3.2.2 Forecasting methods 22
3.2.3 Forecast errors and forecasts monitoring 24
3.2.4 Accuracy measuring techniques 29
4 Benchmarking 36 4.1 Data collection 36 4.1.1 Company one 36 4.1.2 Company two 37 4.1.3 Company three 38 4.1.4 Company four 38
4.2 The summary of the benchmarking 39
5 Analysis 41
5.1 Formulation of a hypothesis 51
6 The company Alfa Laval 52
6.1 How Alfa Laval works with inventory management 52
6.1.1 Re-classification 52 6.1.2 ABC-classification 53 6.1.3 Categorization of demand 53 6.1.4 Forecast 54 6.1.5 Annual demand 55 7 Hypothesis testing 56
7.1 Developing of the tool 56
7.2 How to use the tool 59
7.3 The results of the hypothesis test 60
7.3.1 The hypothesis 60
8 Conclusions and discussion 63
8.1 Recommendations for further research 65
9 References 66 9.1 Articles 66 9.2 Books 68 9.3 Oral 70 9.4 Internet 70
List of figures
Figure 1 - The logistic goal mix 15
Figure 2 - The root causes of inventory 16
Figure 3 - ABC-classification based on volume value 17
Figure 4 - Trend demand 19
Figure 5 - Season demand 19
Figure 6 - Cycle demand 19
Figure 7 - Level demand 19
Figure 8 - Random variety demand 19
Figure 9 - Categorization of demand 21
Figure 10 - Forecast error and planning horizons 25
Figure 11 - How the demand can variety verses systematically forecast errors 27
Figure 12 - Disadvantages with MAD 31
Figure 13 - Categorization of demand 54
List of tables
Table 1 - Guidelines for the number of periods when using moving average 23
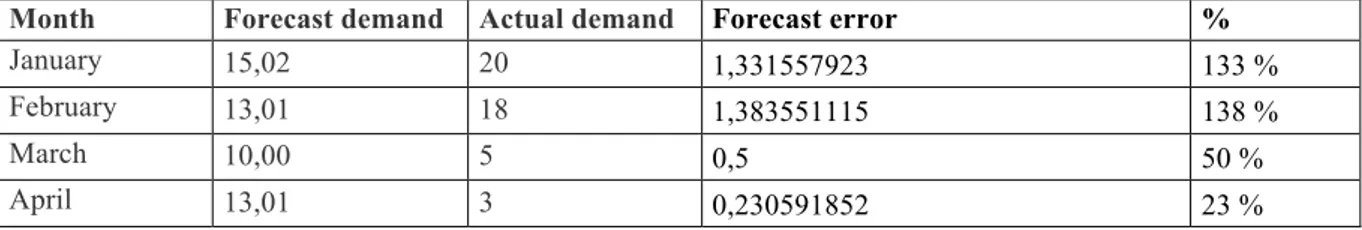
Table 2 - How Company one calculates forecast errors 37
Table 3 - The formulas Company one uses 37
Table 4 - How Company two calculates forecast errors 37
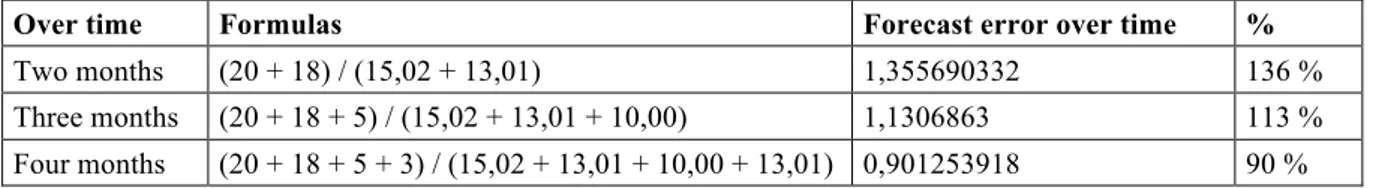
Table 5 - How Company two calculates forecast errors over time 38
Table 6 - How Company four works with forecast errors 39
Table 7 - Summary of the benchmarking process 40
Table 8 - The analysis of the hypothesis test 61
Table 9 - The connection between negative CFE and availability 61
List of appendices
Appendix 1 - Extract of demand vs. forecasts for four items
Appendix 2 - Extract from the availability report
Appendix 3 - Extract from the developed tool
Abbreviations
APE Absolute percentage error
CFE Cumulative sum of forecast errors
DC Distribution Centre
L24M Last 24 months
MAD Mean absolute deviation
MAPE Mean absolute percentage error
ME Mean error
MPE Mean percentage error
MPS Master production scheduling
MRP Material replenishment planning
MSE Mean squared error
PGP Product Group Parts
SSE Sum of squared errors
1 Introduction
This introductory chapter will first of all describe the background for the thesis. Then the problem description will be presented as a result of the purpose and research questions. And finally, the project limitation for the thesis will be clarified.
1.1 Background
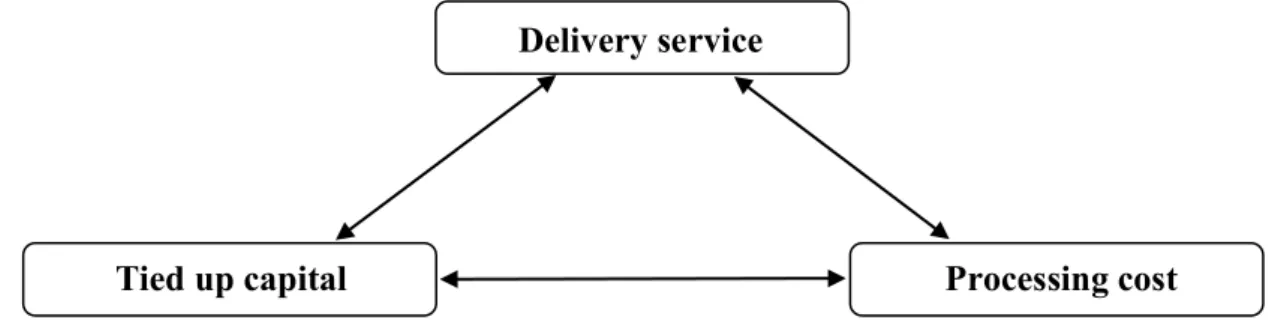
Oskarsson et.al. (2006) say that during the last twenty years logistics has grown. From the beginning, logistics were about storage and transportations but today logistics is an important part for companies’ strategies for competitiveness. Today you can find many companies that have created and increase their competitiveness by smooth and good functioning logistics. Inventory management is an important part of a good functioning logistic. Koumanakos (2008) says that nearly all the literature on optimal inventory management uses criteria of cost minimization and profit maximization. The inventory manager’s goal is to minimizing the costs and maximizing the profits while satisfying the customers’ demand. To do so it is important to have a low inventory cost and at the same time be able to deliver what the customers want. Lumsden (1998) explains that you need a balance between availability of stocked items, low tied up capital and low processing cost and he calls it the “logistic goalmix”.
Oskarsson, et.al. (2006) write about delivery service elements and one of them is availability in stock. They describe availability in stock as the number of orders or order lines that can be deliver on the customers’ requirements. Koumanakos (2008) explains how much inventory a company should have since the inventory is both an access and a debt. He mentions that too much inventory requires space, creates a financial burden, and increases the possibility of damage, spoilage and loss. It also results in poor forecasts and haphazard scheduling. He clarifies that, at the same time as it is important to satisfy the customers’ demand by maintaining the availability in stock, it is also important avoid excessive stock.
Davis (1993) writes about supply chain management and different factors that can results in uncertainties in the supply chain. One important factor he mentions is the customers’ demand. He declares that over half of the stocked items are in stock to prevent irregular orders. The customers’ demand creates a large uncertainty in the supply chain. Bartezzaghi et.al. (1999) explain that managing uncertain demands always have been a major concern in manufacturing planning and control systems, specially in master production scheduling, MPS. In particular if the items are irregular, with a roughened volume of an irregular demand pattern.
Syntetos et.al. (2005) write about categorizing of demand patterns and divide the demand patterns into the four following categories:
· Smooth.
· Erratic (in terms of demand sizes, but not very intermittent).
· Intermittent (in terms of intervals having no demand occurrences, but not very erratic). · Lumpy (intermittent and erratic).
According to the authors, the items with a lumpy demand i.e. the items that are both intermittent and erratic are the hardest to handle and to forecast. Due to the variation in the demand for items with a lumpy demand, it is a challenge for companies to forecast these items. It is hard to handle the random values that appear at random intervals and leaving many periods with zero demand.
Hågeryd et.al. (2002) say that inventory management consists of both inventory order production and customer order production. The inventory production is based on forecasts i.e. the number of products that are expected to be sold. The forecasting is important since the future demand is important to the production planning and inventory management. Robeson (1994) and Chopra and Meindl (2001) say that different companies use different methods to calculate the most optimal forecasts, depending on different parameters, as for instance the demand patterns.According to Ghobbar (2004a) a common goal when you choose a forecast method is to minimize the errors in the forecasts. The errors are defined as the difference between the actual value and the forecasted value during one period. Mattsson and Jonsson (2003) mention that forecasts always are incorrect in relationship to the actual outcome and that forecast errors hence always will exist. Therefore it is important to continuously calculate the forecast errors, to control that the forecasts are within the acceptable error margins. The authors’ conclusion is that continuous measurement of forecast errors should be a natural part of all forecasting systems. By calculations of the forecast errors Ghobbar (2004a) explains that a forecast method’s performance and accuracy can be evaluated. Mattsson and Jonsson (2003) mention that forecast errors must be measured per period to identify the items that have the largest errors and to identify any systematic errors i.e. if a forecast systematically is too high or low. They also mention that the outcome of the measured forecast errors are used as a base to decide the safety stock to ensure the availability in stock and thereby ensure a high service level to the customers.
1.2 Problem formulation
The above mentioned is a complex situation. A company needs to have a high service level and meet the customers’ uncertain demand. To achieve this you need to have a safety stock, but it costs money to keep a stock. Therefore it is important that companies have a good balance in their inventories. To achieve this they need to have an optimal forecast method. The purpose with forecasting is to increase the knowledge about the future demand by planning in advance. But, to predict a precise forecast is not easy, especially not when the demand has large variations, as items with a lumpy demand have. Forecast errors, i.e. the difference between the forecast demand and the actual demand during one period, will always exist for companies that use forecasts. It does not matter how good the forecast are or how complex the forecast methods are, the instability of the markets confirm that the forecasts always will be incorrect in relation to the actual demand, and therefore the forecast errors always will exist. Thus, forecast errors are something that one needs to accept and work with to keep the errors as minimal and few as possible. It is important to continuously calculate the forecast errors and ensure that the forecasts are within the acceptable error margins.
There are several methods to calculate forecast errors. But a big challenge is to calculate forecast errors and forecast accuracy for items with a lumpy demand. What you need to take into account is inter alia extremely irregular demand and periods with zero demand, which makes this task even more complex.
1.3 Purpose and research questions
By continuously analyze the forecasts in relation to the actual demand companies can monitor the forecasts to minimize the risks of forecast errors. The purpose with this thesis is to identify methods to calculate forecast errors for stocked items with a lumpy demand. A tool to calculate forecast errors will be developed to help companies to continuously monitor their forecasts and evaluate the forecasts accuracy.
Thus, the thesis shall answer the following questions:
· How should one calculate forecast accuracy for stocked items with a lumpy demand? · How do companies measure forecast accuracy for stocked items with a lumpy demand
which are the differences between the methods?
· What kind of information do one need to apply these methods?
1.4 Thesis limitations
The time interval for this thesis is from 2015-08-31 to 2016-01-17. The short time interval results in, firstly, limitations in the data collection, both the collection of literature and the execution of interviews. Secondly, the test of hypothesis is limited to one company, Alfa Laval, and to one distribution centre, to Alfa Laval’s centre in Tumba.
2 Approach and methodology
This chapter describes the methodology used through the work. First, a general description about the requirements for a research study will be presented. Then the research process, step by step, will be clarified for the understanding of the methodology and the approach for the research process. A short presentation of the different methods used for the data collection will be given. And finally, the difference of qualitative and quantitative research is explained and the concepts validity and reliability is clarified.
2.1 General about research study
To simplify it, the method is how you achieve the purpose of the report. The method should describe the different choices made to achieve the purpose (Paulsson, 1999).Different authors write about what research actually means and what an academic report must include.
According to Paulsson (1999) an academic report shall have the following requirements: · The study must show that the author knows about the existing theories, models and
data.
· The study is based on already existing methods, models and data.
· The result for the study must be anchored in the existing academic knowledge by discussing the conformity of the results with already existing theories, models and data and also by discussing the generalizability of the results to other types of organizations.
According to Kumar (2011) you claims, by undertaking a research study to answer a question, that the process:
· Is being undertaken within a framework of a set of philosophies, i.e. within a qualitative, quantitative and academic discipline in which you have been trained. · Uses procedures, methods and techniques with tested validity and reliability. · Is designed to be unbiased and objective.
According to Ejvegård (2003) a scientific work should be: · Factual – the information that is being used is correct.
· Balanced – the work should have a balance between facts and how you apply the facts. · Objective – all information should be neutral, fair and without personal influences. All the above mentioned requirements of a scientific work have been taken into account through the whole process, and in all aspects, of this thesis.
2.1.1 Overall approach
Based on what different authors say about the requirement of a scientific work, the work process and method used in this thesis is the one described by Kothari (2004). He describes the process like a flow chart where every step in the process can be illustrated. These following steps have been followed through this thesis:
1. Formulating the research problem. 2. Extensive literature survey.
3. Developing the hypothesis. 4. Preparing the research design. 5. Determining sample design. 6. Collecting the data.
7. Executing of the project. 8. Analysis of data.
9. Hypothesis testing.
10. Generalizations and interpretation.
11. Preparation of the report or presentation of the results.
(Kothari, 2004, p. 12-20)
2.2 Data collection
The data collection is the base for the whole work. To collect data a literature study have been made to compare how different researchers and authors write about this specific topic. Two different types of case studies have also been made. Firstly, a benchmarking process was made to compare how different companies work with this issue. And secondly, a case study in form of a hypothesis test was been made to test the hypothesis based on the analysis from the literature review and the benchmarking process.
2.2.1 Literature review
According to Ejvegård (2003) the literature review handles, for research, all relevant printed information. It can be for example articles, books and reports. Databases are one alternative to find articles, electronic books etc. for a literature review. When you search in databases it is important that you have selected keywords. The keywords shall ensure that you find relevant information. The purpose of the literature review is to give a broader knowledge about the specific topic and to clarify strengths and weaknesses in previous studies. The advantages with a litterateur review are that it clarifies the focus on your research problem and it improves your method. The literature review also gives a context to your final results (Kothari, 2004; Dawson, 2002).
In order to study what other authors have written about the specified topic, for the understanding of forecast accuracy and to identify possible methods to calculate forecast errors for stocked items with a lumpy demand, a literature review has been made for this thesis. The primary source has always been located to ensure the reliability of the study. The reliability of the study will be discussed below in chapter 2.4 on page 11.
The literature review is based on scientific articles, books and journals within the chosen topic; calculation of forecast accuracy for stocked items with a lumpy demand. By using databases as Google Scholar, Emerald, Discovery and DiVA and Stockholm and Mälardalen University Library, relevant scientific papers and books have been found. The scanning of scientific articles and books gave a broader knowledge of the chosen topic and clarified previous research conclusions and studies in this area. To see how this topic has been dealt with through the years, it was necessary to have such a wide scope as possible on the research articles. To find relevant information a final selection was made. The selection was based on the relevance of the content in the articles. The keywords that have been used to search for scientific papers are: lumpy demand, forecast accuracy, forecasting, forecast error.
In addition to examination of the scientific articles a benchmarking process has been done.
2.2.2 Benchmarking
The art of benchmarking is to be sufficiently lowly to recognize that someone is better than you and at the same time be obstinate enough to learn to be equally good or better.
(Andersen and Pettersen, 1995, p. 11) The goal with benchmarking is to develop and create changes and improvements. Benchmarking is a complement to the continuous improvement since you will:
· Find new resources for improvements outside your own organization. · Find new, innovative methods that benefit the development of the company. · Establish goals in line with the best representatives of the industry.
(Ibid)
Benchmarking is about evaluating the company, quantitative or qualitative, in relation to the company that you perceive are the best in the specific business (Codling, 1995; Andersen and Pettersen, 1995). To mark up certain parameters, products and strategies to create a perspective of the actual performance of the industry benchmarking is used. Benchmarking helps the company to compare their strengths and weaknesses with the leaders from their industry. From the comparison they develop adjustments and improvements (Codling, 1995). Karlöf (2009) considers the following elements as the most important ones for benchmarking:
· A complete and correct description of the value creating processes and activities. · A correct and fair comparison with another party – a role model or original.
· A depth understanding of the causality between work organization, skills etc. that describe the difference in performance.
Different authors describe the benchmarking process in different ways. Andersen and Pettersen (1995) describe the steps in benchmarking as follows:
· Planning – Chose and document the process that should be studied. · Search – Identify who should do the process.
· Observe – Map and analyze how the benchmarking partners do the process. · Analyze – Study the causes for the difference in the execution.
· Customize – Implement improvements based on the analyze.
All stages are important. But to eliminate the waste of time it is important to spend time on the planning stage. In the end of the benchmarking process the review is important to interweave the whole process (Codling, 1995).
Benchmarking can be divided into three perspectives: · Internal.
· External. · Best practice.
Internal benchmarking is when you evaluating something by studying something within the company. You can for example identify and compare different processes between different departments at the company. Comparing two departments in a company to identify the strengths and weaknesses and thereby develop adjustments and improvements can constitute an internal benchmarking. External benchmarking is when you study an external party. It can be companies from different industries or from the same industry. Its can be an advantage to study a company that produce different products since you can learn new things and see situations from a new perspective. Best practice benchmarking is when you study the leading company in a certain industry or process. This can be essential to be successful in your business (Ibid).
A case study has been made in form of a benchmarking process. For more information about case studies, see further below, in section 2.2.3. The benchmarking process was conducted at four different companies to compare how they measured forecast errors and forecast accuracy. The four companies are not competitors, they manufacture different products, but they are all working with inventory management and manage stocked items with a lumpy demand. They work under similar conditions and are exposed to similar challenges.
2.2.2.1 Interviews
Andersen and Pettersen (1995) mention that it exist different methods to collect data in a benchmarking process and that one is to do interviews. Interviews can be done in different ways. Edvardsson and Thomasson (1993) mention four different kind of interviews; interviews by visiting, interviews by phone, deep interviews and interviews in groups. They mention that the purpose of the survey should determine the design and approach of the
interviews. Hartman (2004) say that the reason for a person being interviewed is that someone wants to learn about the respondent’s knowledge.
It is important to choose relevant persons to interview since it takes time to do the interviews and to interview an irrelevant (for the survey’s purpose) person it is a waste of time. To remember what the respondent says one could take notes and, if the respondent agrees, the interview can be recorded. It is important to have in mind that the recording may be a disincentive to the respondent. To ensure that the respondent feels comfortable, key words can be noted during the interview and afterwards, the respondent can be given opportunity to elaborate on the answers and then finally approve the draft of the interview (Ejvegård, 2003). The benefits with interviews by phone are inter alia that you can collect a lot of data at a low cost, the respondent can answer when he or she have time and the respondent can give honest answers. The disadvantages are the risk of poor answers and that the researcher has no control of who the respondent is. The benefits with interviews by email are inter alia that it is a quick method, it is a more flexible method and you can go deeper into specific questions. The disadvantages are inter alia a risk of higher costs and that the interviewer can influence the answers by mistake (Kothari, 2004; Dawson, 2002).
Kvalie (1997) says that the quality of the interview is essential for the quality of the analysis and the report. Thus, it is important that the questions are as neutral and objective as possible, since a subjective question will influence the answer and therefore the quality of the interview. Andersen and Pettersen (1995) say that an interview should be more like a conversation rather than a questioning. But they also mention that it is important to have an overview for the topics of the interview, like a guide for the interview.
The benchmarking process in this thesis was essentially conducted by empirical and qualitative studies in the form of interviews at the four different companies. The interviews were mainly conduct by email, but two of the companies were also interviewed by a visit. These interviews were conducted verbal through an open dialogue and were semi structured, i.e. one person at the time was interviewed. And the email interviews were based on neutral questions.
2.2.2.1.1 Questionnaire design
Both the interviews by email and by visiting were based on four prepared main questions. The reason for the prepared questions was to ensure that every interview was carried out in the same way, whether the interviews were conducted by a visit or email. During the interviews conducted by a visit, these four questions were more like a guideline to ensure that each interview proceeded smoothly and structured. For qualitative interviews it is a benefit to have a standard approach and a prepared structure to ensure that every interview followed the pattern. Since the quality of the analysis and report is depending on the quality of the interviews, the questions were kept as objective as possible and questions leading the respondent to a certain answer was avoided. In order to achieve a clear and good result from
2.2.2.1.2 Sample design
The interviews were conducted with four persons working at the four companies that participated in the benchmarking process. The companies manufacture dissimilar products but they all are working with inventory management and manage stocked items with a lumpy demand. The interviewed persons were persons who work with forecast, monitoring of forecasts and inventory control on a daily basis and their responsibility was to maintain an optimal forecast.
2.2.3 Hypothesis test
After the literature review and the benchmarking process that showed how different companies are working with this issue, a case study in form of a hypothesis test was made. The hypothesis test is conducted to verify the hypothesis, which was formed based on the analysis from the literature review and the benchmarking process.
A hypothesis test is a kind of a case study. Merriam (1988) explains that case studies are not something new. Case studies got a lot of support and attention in the US during the late 1960s and the early 1970s. A case study should give a deeper and more detailed knowledge of the specific area and analyzes a phenomenon in its real context. Kvale (1997) says that the analysis is an important part of a study. Therefore it is important that the researcher in an early stage has figured out what he or she wants to achieve with the collection of the data. Ejvegård (2003) says that the purpose of a case study is to describe a specific case and not a whole process. It is important to keep this in mind when you analyze the case study, and to not try to fit in the whole process into the case study since it may result in incorrect conclusions. Yin (2003) says that a case study is one of several methods to do a social science research, other methods are for example experiments, surveys and analysis of archival information. He explains that case studies are used in many situations to contribute to our knowledge of individual, group, organizational, social, and political phenomena. He explains further that a case study is an empirical study that investigates a contemporary phenomenon within its real-life context, especially when boundaries between phenomenon and context are not clearly evident (Yin, 2003, p. 13).
According to Gilgun (1994) and Ghauri and Gronhaug (2002) case studies has been a common research strategy in different environments for example political science, business and community planning. Merriam (1988) says that a case study is an investigation of a specific phenomenon.
In addition to the literature review and the benchmarking process, a case study in form of a hypothesis test was made at the company Alfa Laval in Stockholm, Tumba. Alfa Laval is a very suitable company to conduct this kind of hypothesis test at. They have many stocked items with a lumpy demand and they require a tool to calculate forecast errors to be able to continuously measure how accurate their forecasts are. To conduct the hypothesis test, a tool was developed which calculate the forecast errors. The tool was formed based on the hypothesis.
The test was conducted by downloading historical data on Alfa Laval’s stocked articles from their order system, in order to verify whether the tool was able to identify the large forecast errors that Alfa Laval earlier had experienced and was aware of. In this way, the hypothesis test was completed in the most optimal way.
2.3 Qualitative and quantitative research
A research can be qualitative or quantitative, or a combination of both.2.3.1 Qualitative research
Dawson (2002) describes qualitative research and explains that qualitative research explores attitudes, behavior and experiences through methods as interviews or focus groups. Since attitudes, behavior and experiences are most important in a qualitative research, few persons should participate, but the contact with these persons should be longer and deeper. Patel and Davison (2011) say that qualitative research should focus on soft values, through qualitative interviews and interpreted analysis. Saunders et.al. (2007) describe qualitative data as a non numeric data that have been quantified and can be a product of several research strategies. The collection methods when you do a qualitative research can be either notifications from a deep interview or a short list with open questions in a formula. When you have collected the data it is important that you analyse the data to make it useful for the research’s conclusions. To get a good overview of how Alfa Laval works with forecasts and measures forecast errors today, open and qualitative interviews was conducted by visiting and summarized by notes. To examine and compare how other similar companies measures forecast errors, questions was sent to other participating companies by email and two of them also by visiting. Respondents from each company received the same open questions, which they replied by email and in person. Based on this data, this research is first of all a qualitative research since the collected data was collected by both open and deep interviews questions. To ensure that all interviews were conducted in the same way, both the deep interviews and the open questions emailed to the respondents were based on the same four questions. These four questions were used as guidelines for the deep interviews and as concrete open questions for the respondents answering by email.
2.3.2 Quantitative research
Regarding quantitative research, Dawson (2002) says that quantitative research should be conducted by collecting statistics through large-scale survey research, using methods such as questionnaires or structured interviews. In a quantitative research many persons should participate, but the contact with these persons is quicker and shorter than in a qualitative research. Quantitative research is a research method where statistical and quantifiable results are sought. Patel and Davison (2011) say that within the quantitative method the research includes measurement from data collections and statistics process and analyses methods. Saunders et.al. (2007) explain that quantitative data is raw data that not has been processed or analysed. To make the collected data useful, you must analyse it. Graphs, carts and statistic can be useful to analyse, explore, examine, compare, describe and present the collected data.
In this thesis four different items was studied to examine and compare how the historical demand had vary over time. The historical data was collected to measure and obtain information about the items’ demand and to illustrate how the demand pattern over time. This data is stored in Alfa Laval’s computer system, from which information about for example the forecast, the actual demand and the ABC-classification can be downloaded. Thereafter was measurement of the historical data conducted. The data, in form of statistic, was analysed and a documents was completed to use as a tool that quickly and easily could analyse and present the historical data. Thus, the research has also been quantitative. So, to summarize, the study was both qualitative and quantitative.
2.4 Validity and reliability
Paulsson (1999) mentions three central key approach concepts when you choose method for a research. The three concepts are validity, reliability and objectivity. Below the concept validity and reliability will be described.
2.4.1 Validity
Paulsson (1999) explains that validity represents the extent of what you are planning to measure in the study. Wallén (1996) gives another definition of validity and describes that when you do a model/theory, you must have no bias, i.e. any systematic deviation, to ensure the validity of the model. Further he explains that the validity can be divided into theoretical and empirical validity. Wallén (1996) and Ejvegård (2003) explain that to ensure high validity from a theoretical perspective you need to use relevant parameters in the model. The empirical validity shall be investigated by studying the model's ability to predict outcomes. Ejvegård (2003) stresses the importance of measuring the right parameters in order to achieve a useful result when the analysis is completed. He also says that it is important to know what the measurement stand for and how the measurement should be used.
For the validity of the study it is important to measure the right objects and facts for the study. The purpose of this study is to review the forecast accuracy and therefore it is important to measure objects and facts related to forecast accuracy. To compare how companies works with this specific topic it was important to ask questions related to the purpose. The questions asked was questions about forecast accuracy and intended to examine how companies measured forecast accuracy. To obtain a useful result for the analysis it was important to figure out how the companies work with this issues and which method they used.
To measure forecast accuracy you need to measure forecast errors. The methods used to measure forecast errors are methods that have been developed by different authors, for example Ghobbar (2004a), Chopra and Meindl (2001) and Chase (2013). The methods illustrate how this issue has been dealt with historically. To ensure the validity of this study, the choice of methods to measure forecast errors was based on the methods developed by these authors. Thus, the forecast errors were measured with methods that had been tested for their validity through the years. The study is therefore conducted by measuring relevant objects and facts to achieve a high validity.
The measures used in the tool are scientific tested and verified, as they must, to ensure a high validity of the result. The tool shows a result that corresponds to the purpose of the study. In this light, the study shall have a high validity. To further ensure a high validity in this case, the model was tested during a long period of time. It is not until the model has been used for a while, as you can identify benefits with the model, if the model generates improvements and if the model has any bias.
The collection of historical data on Alfa Laval’s articles was chosen to ensure a high validity of the study. Different books and articles were used to obtain broad background for the analysis and to obtain a high validity. It is always possible to obtain a higher validity by using more literature and complete more interviews, but because of the time limitation for the study no more interviews and literature reviews was possible to conduct. By analysing the results of both the literature and the interviews, formulating a hypothesis and then test the hypothesis at a company that worked with forecasts and managed items with a lumpy demand, the study achieves a high validity. Especially the hypothesis test is something that increases the validity of the study; since the test was conduct at an optimal company that managed items with a lumpy demand and the results proved to be valuable and useful for the company. Thus, the combination of the litterateur review, the benchmarking process and the hypothesis test, the study achieves high validity.
2.4.2 Reliability
Paulsson (1999) and Eriksson and Wiederheim-Paul (1999) explain that the degree of a study’s reliability shows in which extent one would obtain the same result if one repeated the study or task. In other words, if someone conducts the same study or task, with the same methodology, he or she should get the same result. Wallén (1996) give a more general definition and explains that reliability shows whether the measure is free from random errors. Ejvegård (2003) says that reliability indicates the accuracy of a tool. He further says that when a scientist does measurements he or she often develop a tool for the task. If another person tries to do the same measurement the person must be aware of the fact that the tool that was used in the first place may be different from the person’s own tool. This deferens can lead to different results. Patel and Davidson (2011) write about the reliability when interviews and observations are used in a study. If interviews and observations are used, the reliability depends on the interviewing person’s ability to interpret the collected information. The reliability is higher if the interviewer is trained and experienced and the interviews are structured.
The literature review is based on several articles and books. To ensure the reliability of the presented information in this study, the information was verified by reviewing several authors’ opinion on this topic and issue. The analysis takes into account various authors’ opinion to make the conclusions as reliable as possible. In this light, the reliability of the study is high.
Interviews and surveys is also an important part for the result and the conclusions in this thesis. The reliability of data from interviews is complex. The interviewer’s ability to interpret
interviews have been based on the same questions and guidelines the reliability of the interview data should be high. The experience achieve from conducting the literature review was useful to the interviewer when preparing questions and guidelines and during the interviews. Moreover, the interviews were conducted based on four questions that were open-generated and resulted in concrete answers. The concrete answers gave an objective result. Regarding the reliability of the measurements the following could be noted. If someone would do the same measurements, he or she would probably come to the same result. The reason for this is that the benchmarking process and the literature review showed that the applied method was the best alternative to calculate forecast accuracy under the current conditions. But if the conditions would change, it might exist a better alternative. The tool was carefully based on several methods and theories. The tool was developed to ensure a high reliability and to not generate random errors. However, random errors might occur when the tool has been used during a longer period of time. In this light, the reliability of the study should be high.
3 Theoretical framework
In this chapter, the theoretical framework, which is one part of the underlying basis to supports the results of the thesis, is presented. The chapter begins with a description of basic theories about logistic and how different authors describe the concept of logistic and logistic systems. Then a description follows on how companies should work with customers’ demand and inventory to achieve profitability. Thereafter, an explanation follows on the importance of a good forecast and a forecast method to meet the demand, and further how the choice of methods depends of the categorization of customers’ demand. Finally, uncertain demand is discussed and the different types of accuracy measures techniques are presented.
3.1 Logistic and the logistic system
Logistic is the process of strategically managing the procurement movement and storage of materials, parts and finished inventory (and the related information flows) through the organization and it’s marketing channels in such way that current and future profitability are maximized through the cost-effective fulfillment of orders.
(Christopher, 2005, p. 4) The definition of logistic varies depending on which author you ask. According to Lumsden (2012) logistic is about controlling the material flows in an effective way. He says that logistic is about controlling the material flows together with associated the activities and systems. According to Fredholm (2013) logistic is defined as the activities that intend to provide the right product or service at the right place at the right time and in the right quantity at the lowest possible cost.
Oskarsson et.al. (2006) describe that the material flow into, through and out of a company is called a company’s logistics system. The key for higher profitability and competitiveness is to work with the efficiency of a company’s logistic system. They also explain, as Fredholm (2013) do too, that the goals for the logistic is that all customers should receive the products they demand at the right place and at the right time to the minimum cost. Oskarsson et.al. (2006) further explains that the most important with logistics is to strive for the lowest possible total logistics costs and still maintain the highest possible delivery service. They stress that from the customer’s perspective these requirement are realistic. But from the producers perspective it is more complicated. To meet these requirements companies need to have a better delivery service and at the same time they need to reduce the costs. To achieve this the companies need to coordinate a well-functioning distribution, production and supply of materials.
Thus, based on Fredholm (2013) and Oskarsson et.al. (2006) definitions of logistic, logistic is about providing the right products or service at the right place at the right time, with the right quantity and at a minimum cost and to achieve this you need to, as Lumsden (2012) explains; control the material flows in an effective way.
Lumsden (1998) describes the “logistic goalmix”. It is a model that shows the connections between the basic objectives that the logistic is based on. The three objectives are that the supplier want to have a high service level by having high stock availability and quick deliveries, the tied up capital should be as low as possible with short cycle times and the processing cost should be as low as possible. It is important that the three different objectives have a balance between each other. See figure 1.
3.1.1 Inventory and working capital
Depending on which person in a company you ask they would have a different opinions on the inventory and the quantities in the inventory. Oskarsson et.al. (2006) explain that if you ask the person that is responsible for the economy, he or she would like to have the lowest inventory possible to avoid to tie capital. If you ask the person that is responsible for the marketing, he or she would like to have high availability on the items, and therefore a high inventory levels to ensure the deliveries to the customers. They say that a producer should strive for a low total costs and to keep an inventory costs money. Both Lumsden (1998), Oskarsson et.al (2006) and Koumanakos (2008) are examples on authors that describe the inventory as a cost for the logistic system. As an example on costs for the logistic system, Oskarsson et.al (2006) describe the inventory carrying costs as necessary a costs to keep stocked items. They explain that the inventory carrying costs equals the value of the stocked items. They also describe the risks associated with keeping stocked items because of:
· Obsolescence. · Wastage and scrape. · Insurance.
The costs associated to these the risks depend on the size of the inventory, more products in inventory results in higher risks that sometimes occurs (Oskarsson et.al. 2006).
Koumanakos (2008) mentions disadvantages to have an inventory and says that too much inventory:
· Brings up space.
· Creates a financial burden.
· Increases the possibility of damage, spoilage and loss.
Delivery service
Tied up capital Processing cost
Oskarsson et.al. (2006) give an example and explain that we can see the items that are in stock as bundles of cash. If the number of bundles decreases, capital are released and can be used for example investments.
3.1.2 Delivery service
One can ask why we need to keep inventories. But Davis (1993) writes that the reason why we keep inventories is simple. Davis (1993) says that inventory is insurance in an uncertain world. To meet the uncertainty demand we need to keep an inventory like insurance. Lumsden (1998) explains that the goal for a producing company is to meet the customers demand and to ensure that the company has to keep an inventory.
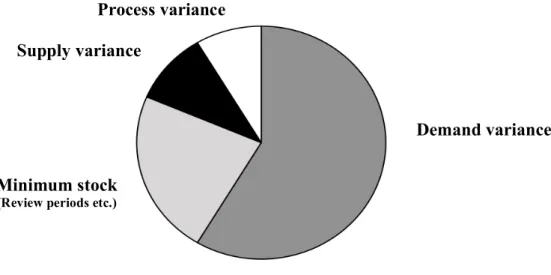
Both Oskarsson et.al. (2006) and Davis (1993) mention that the customers’ demand is uncertain and not predictable and that the customers’ demand marks a source of uncertainty in the supply chain. Davis (1993) say that to meet the objectives for the customer service and to ensure the delivery to the customer even if something goes wrong or if the demand is uncertainty, companies keep a little bit extra material around. The extra material is called safety stock. The more variable the orders are, the more safety stock is required to constantly meet the customers’ demand. Davis has made a pie chart that shows that the main reason why companies keep inventory and safety stock is the variance in the demand. See figure 2.
To ensure the customer service level it is very important to be able to meet the demand when it increases. If something goes wrong in the production or if a supplier does not deliver on time the customer service level will decrease. This is the reason why for companies, that manage uncertain demands, have safety stocks. When everything goes according to plan Oskarsson et.al. (2006) explain that the safety stock is not necessary, but when something unexpected happens, for example delayed incoming deliveries, defects in incoming deliveries or increased in demand, the safety stock will ensure that the company can deliver and maintain a high customer service level.
Demand variance Process variance
Supply variance
Minimum stock
(Review periods etc.)
Regattieri et.al. (2005) write about an example when inventory management becomes important. Their example is about management of aircraft fleets and explains that in these cases, the inventory management of spare parts is essential. In their study they explain that when it comes to spare parts, you need to keep a large stock. It costs money when an aircraft is out of service and therefore it is important for airlines to have a policy for handling with surprising mechanical problems when their aircraft’s are away from the home base. In this context the spare part inventory management becomes important. They explain that it is, in these cases, important that you quickly can handle the surprising mechanical problems so the aircraft can become active again and not cost money for the company.
3.1.3 ABC-classification
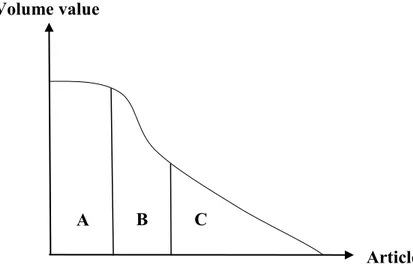
A constantly used term in logistic is ABC-classification. ABC-classification helps companies to prioritize. A company usually has a lot of articles to manage, and to do so the ABC-classification can be useful to divide the articles in different product groups based on the article’s profitability for the company. The classification is done by dividing all articles in the assortment into three groups: A, B and C. Group A is the most important articles. These articles have a high volume value and generate most profitability for the company. Group A usually consists of few but important articles. Group B is usually consists of a larger number of articles but the items do not generate as much profitability for the company as the group A-articles, i.e. the volume value is lower. Group C consists of the least important articles. These articles have the lowest volume value and generate lowest profitability for the company. A general rule for this type of classification is the 80/20 rules, which means that 80 % of the revenue shall be derived from 20 % of the articles (Oskarsson et.al. 2006; Lumsden, 1998). Figure 3 illustrating the ABC-classification.
A B C Volume value
Article
3.2 Forecasting
Mattsson and Jonsson (2003) describe that forecasts can be defined as an implementation of a future assessment. Olhager (2000) says that the purpose with forecasting is to increase the knowledge about the future demand by planning in advance and explains that the knowledge about the future demand can lead to shorter lead-times, smoothing exploitation of products and secured access to the products. Segerstedt (2008) mentions that all decisions are based on a forecast, consciously or unconsciously. If a forecast for example is wrong, you will in the future correct the forecast and hence is the decision to correct the forecast based on a forecast. Mattsson and Jonsson (2003) describe that forecasts in a company may concern of both strategically, tactical and operational decisions. Forecasts are about future conditions related to a company’s future demand of different products. In their article they clarified what needed to be forecasted and said that everything delivered to the customer within a shorter time than the production or procurement time need to be forecasted. Thus, in these cases you need to measure the previously demand. Oskarsson et.al. (2006) also describe that to make strategic, tactical and operational decisions you need information about the customers’ future demand, i.e. how much the customers will demand of each product. They explain that the goal with forecasting is to predict the future to be able to stock the right products with right quantity at the right time. Robeson (1994) explains that the forecast is based on three different types of data:
· Methods based on causation.
· Assessments by experts and historical. · Data based methods.
Mattsson and Jonsson (2003) say that the choice of material planning methods depends on the forecasted articles. They explain that to choose a suitable forecasting method, the customers’ demand and the demand pattern is of great interest. Krajewski and Ritzman (2005) agree with them and say that the responsibility for the person that calculates the forecast is to calculate a forecast that suits the demand pattern best. They finally mention that a forecast often is build on a smooth demand pattern, but that an article often have a variation in the demand and therefore it is extra important to clarify which demand pattern the different articles have.
3.2.1 Modeling and categorizations of demand
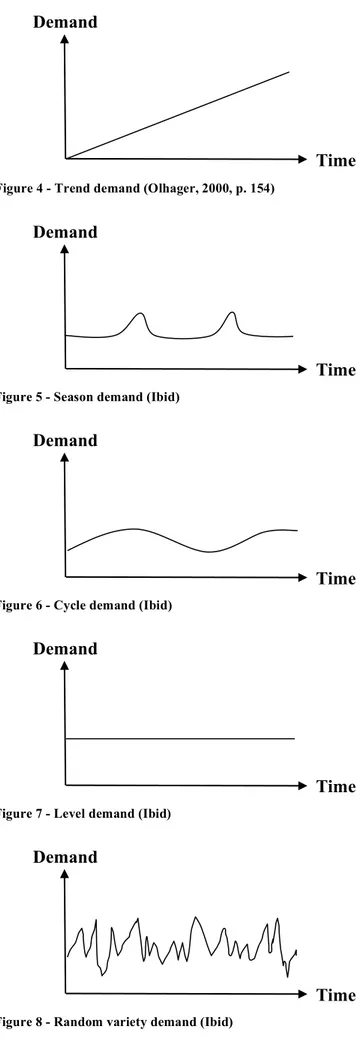
According to Axsäter (1991) it is common that forecasts are based on historical data. Therefore to choose a suitable method to calculate the forecast, knowledge about the demand pattern is needed. Olhager (2000) illustrate the most common demand patterns, see figure 4 to 8.
Demand
Time
Figure 4 - Trend demand (Olhager, 2000, p. 154)
Demand
Time
Figure 5 - Season demand (Ibid)
Demand
Time
Figure 6 - Cycle demand (Ibid)
Demand
Time
Figure 7 - Level demand (Ibid)
Demand
Time
Mattson and Jonsson (2003) explain that the random variety demand is the most difficult to meet and respond to when it comes to forecasting.
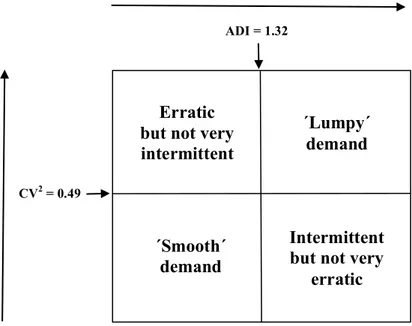
When you have a lot of different articles with different demand patterns, it is important to categorize them. Lengu et.al. (2014) are some of the authors that write about categorization of articles. In this case they do not refer to ABC-classification based on volume value and profitability for the company, cf. section 3.1.3. In this case they refer to classification based on demand, i.e. depending the level and variations in the demand. The demand classification is an important operational issue when managing stocked spare parts. Demand classification is useful when making decision regarding forecasting and inventory control issues. Syntetos et.al. (2005) describe categorizing of demand patterns and divide the demand patterns into the four following classes:
· Smooth.
· Erratic (in terms of demand sizes, but not very intermittent).
· Intermittent (in terms of intervals having no demand occurrences, but not very erratic). · Lumpy (intermittent and erratic).
Both Williams (1984) and Syntetos et.al. (2005) describe the variation in the demand and when the demand occurs. Williams (1984) mentions that the demand pattern and the variations is the most interesting when you review forecasts and categorize items. Syntetos et.al. (2005) explain that the categorization of the items is controlled by the cut-off values CV2 = 0,49 and ADI = 1,32. Where:
· CV2 is the coefficient of variation of demand.
· ADI is the coefficient of inter-demand interval.
According to Williams (1984) and Syntetos et.al. (2005), these two coefficients will decide in which category the items should be. This categorization of the demand has been done in many other studies. Ghobbar and Friend (2003) and Boylan et al. (2008) are two examples that used this categorization and these cut-off values in theirs studies about intermittent and lumpy demand. See figure 9 for an illustration of the demand classification.
To describe the demand classification more in detail see the following description made by Ghobbar (2004a):
· If the “𝐴𝐷𝐼 ≤ x, 𝐶𝑉!≤ y” condition exist, it is an item with a smooth demand. It means
that it is not so much variation in the demand and the demand occurs at regular intervals, i.e. periodically. This is the category for items that are not very intermittent and erratic. The demand pattern for these items does not result in any forecast or inventory control troubles.
· If the “𝐴𝐷𝐼 ≤ x, 𝐶𝑉!> y” condition exist, it is an item with erratic but not very
intermittent demand. This means that there are variations in the demand, i.e. the quantity of the demand has a variation, but the demand occurs at regular intervals, i.e. periodically. Thus, the challenge with these items is to meet quantitative variation since the items are erratic but not very intermittent.
· If the “𝐴𝐷𝐼 > x, 𝐶𝑉!≤ y” condition exist, it is an item with intermittent but not very
erratic demand. This means that there are small variations in the demand i.e. the quantity of the demand is more constant, but the demand occurs at irregular intervals. Thus, the challenge with these items is to meet the variations in the demand when it occurs since the demand size is not very erratic.
· If the “𝐴𝐷𝐼 > x, 𝐶𝑉!> y” condition exist, it is an item with lumpy demand. These
items generate the greatest challenge for companies. These items have a big difference between each period, i.e. the quantity of the demand varies a lot. These items have periods with zero demand and periods with demand, so it is a challenge to meet the highly irregular demand both quantitatively and with various interval.
Erratic but not very intermittent
´Lumpy´ demand
Intermittent but not very
erratic ´Smooth´
demand
CV2 = 0.49
ADI = 1.32
3.2.2 Forecasting methods
It is important to have a well functioning forecasting system to have a balance in the inventory and purchase at all time (Mattsson and Jonsson, 2003). It is important to have a appropriate spare parts inventory level that meet the customers demand and still not create an overloaded inventory level. To determine appropriate spare parts inventory levels, you must know the maintenance and parts forecasting that feed the material replenishment planning, MRP, system (Ghobbar and Friend, 2003). Ghobbar (2004b) studied a small number of companies and their inventory forecasting systems. 9% of these companies had issues in the forecast demand for parts and some of these companies therefore searched for better forecasting systems. Axsäter (1991) explains that a good forecasting system shall indicate when an inventory should be loaded and how much quantity the inventory shall be loaded with. The inventory shall ensure that the demand shall be satisfied without the risk of lacking items in the inventory. At the same time a good forecasting system shall minimize the working capital costs. Different companies use different methods to calculate and get the most optimal forecast based on the variance in the demand pattern. Chopra and Meindl (2001) and Mattsson and Jonsson (2003) describe the most common forecast methods that are:
· Moving average.
· Simple exponential smoothing.
· Trend- Corrected exponential smoothing.
· Trend- and Seasonality- Corrected Exponential Smoothing.
Chopra and Meindl (2001) explain that the goal of all forecasting methods is to forecast the systematic component of demand and guess the random component. All the different methods have its benefits and disadvantages and takes different factors into account depending on, for example, customers’ demand. Ghobbar and Friend (2003) explain that the variation in the demand constitutes a problem for companies when they decide forecasts. The intermittent demand produces a series of random values that appear at random intervals and leaving many time periods with no demand. The demand pattern from the customers’ demand should determine the most appropriate method to gain greatest benefits.
3.2.2.1 Moving average
Mattsson and Jonsson (2003) explain that the moving average method calculates the average of the actual demand over a number of periods backwards. When you are using moving average you replace the oldest periods of the demand value and replace it with the last periods demands value. Moving average method fulfills high requirements on stability and also fulfills high stability against random fluctuations if many periods of demand are included. The number of periods that should be included in the moving average calculation is determined in each case and depends on the specific situation and demand scenario. The choice of periods often depends on the period lengths and the demand variations. Mattsson (2010) gives a guideline when you choose an appropriate number of periods and explains the following:
· Many periods result in a more stable the forecast, which will not be affected by random variations.
· If there are periods of seasonal random variations an equal number of periods should be chosen.
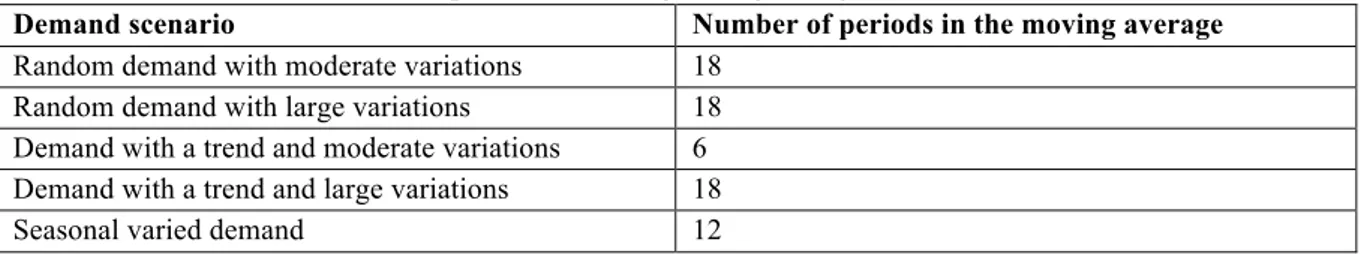
He also illustrate a table that describes how many months back you should include when you calculate the mean average, based on different demand scenarios. See table 1.
Table 1 – Guidelines for the number of periods when using moving average
Demand scenario Number of periods in the moving average
Random demand with moderate variations 18 Random demand with large variations 18 Demand with a trend and moderate variations 6 Demand with a trend and large variations 18
Seasonal varied demand 12
(Mattsson, 2010, p. 258) But the consequences of Mattsson’s instructions are they reduced the ability to see trends and other systematic changes. According to Chopra and Meindl (2001) moving average methods should be used when the demand has no natural trends or seasonality.
3.2.2.2 Simple exponential smoothing
Mattsson and Jonsson (2003) explain that when you are using the moving average as a forecast method all the demands values give the same weight in the calculations, regardless of age. Simple exponential smoothing method instead takes higher information value on the most fresh demand value. So the most fresh demand values results in higher weight than the older demand values. Chopra and Meindl (2001) say that this method counts in 𝛼, smoothing constant, which weighing the freshest values higher than the older demand values. The smoothing constant will fluctuate between zero and one.
3.2.2.3 Trend-corrected exponential smoothing
Trend-Corrected Exponential Smoothing is appropriate when the demand is expected to have a level and a trend in the systematic component but no seasonality (Chopra and Meindl, 2001). Mattsson and Jonsson (2003) describe that it is especially important to take the trends into account if the forecast not only refers to the next following period but also for a long time to come. It is especially important to use this method if you should produce a production plan.
3.2.2.4 Trend- and Seasonality- Corrected Exponential Smoothing
Trend-Corrected Exponential Smoothing is appropriate when the systematic component of demand is expected to have a level, trend and seasonal factor (Chopra and Meindl, 2001). Mattsson and Jonsson (2003) write about the variations that depend on seasons. In this case you need to take the seasonal variations into account when you calculate and determine the forecast. To do this, you need to determine the so-called seasonal index, which is expressed by the size of the seasonal variation. This method is similar to the trend-corrected exponential
smoothing method when you take the trends into account. But, in this case you take the seasonal index into account instead.
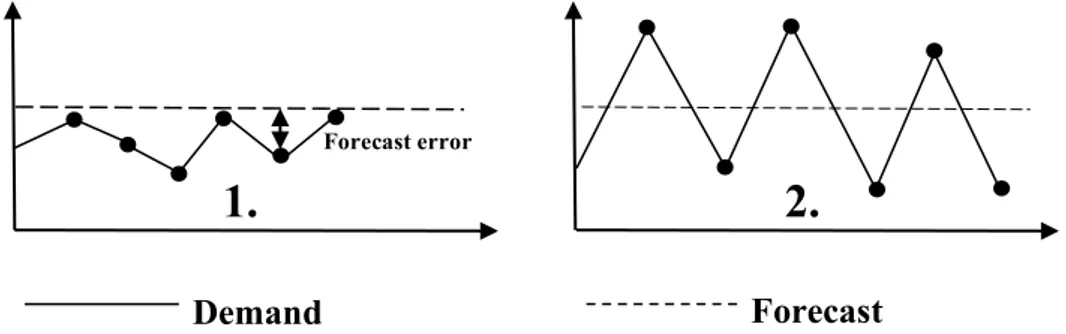
3.2.3 Forecast errors and forecasts monitoring
A common goal when you decide a forecast method is to minimize the errors in the forecast. The definition on a forecast error is the difference between the forecast demand and the same period’s actual demand (Mattsson and Jonsson, 2003; Olhager, 2000). In other words, Ghobbar (2004a) describes it as the difference between the actual value and the value that was predicted. Mattsson (2003) describes that the greater the forecast errors are the worse are the forecast quality.
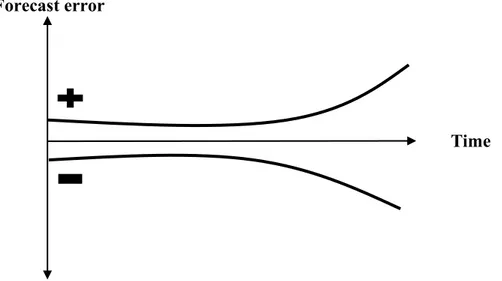
Olhager (2000) describes five characteristics of a forecast. These characteristics are important to understand to get an effective forecasting organization and these are the following:
· A forecast is usually wrong. The errors are hard to avoid but important to follow up. · A good forecast is more than a single number. Since the forecast often is wrong, the
companies should take the errors into account. A good forecast should have a measure on expected forecasting errors.
· Aggregated forecasts are better since the sum of number of independent products shows a more safe and reliable forecast than a forecast for the single product.
· The forecast accuracy is better over the forecast horizon. The forecast accuracy is betters over time since the cumulative sum of forecast errors can cancel out each other.
· Forecasts should not replace known information. Even thought the system shows good forecasts it is important to take known information into account, for example a known upcoming promotion that will increase the sales volume.
3.2.3.1 Forecast will always be wrong, why?
Both Silver et.al. (1998), Christopher (2005) and Mattsson and Jonsson (2003) describe forecast uncertainty and that the forecast probability always will be wrong. Mattsson and Jonsson (2003) also say that forecast per definition is wrong. Christopher (2005) says that an ongoing problem for most organization is the inaccuracy of the forecasts. Silver et.al. (1998) say that a forecast will be wrong and errors will occur. What they mean is that is almost impossible to predict exact forecasts. Both Christopher (2005) and Mattsson and Jonsson (2003) mention that it does not matter how good the forecasts are or how complex the forecast techniques are, the instability of the markets confirm that the forecasts always will be wrong and that errors therefore always will exist. The authors explain further why these errors occur and Christopher (2005) and Mattsson and Jonsson (2003) describe two examples. Mattsson and Jonsson (2003) say that since the forecast represent a calculation of a future demand, it will basically never be fully in line with the actual demand. We need to accept this but still work with this issue to keep the errors as minimal and small as possible. The authors mention the following as different reasons for why forecast errors exist and become unacceptably large: