The Potential of Eliminating
Government Subsidies in the Wind
Power Business Case
-
A business assessment from a technological
perspective at E.ON Vind
ii
Preface
This project marks the end of our master’s studies in Industrial Engineering and Management, at the Faculty of Engineering, Lund University. Spending the spring at E.ON Vind has truly been an inspiring time and has given us the opportunity to learn more about the wind power industry.
We would like to take this opportunity to thank everyone at E.ON Vind for all the support and the willingness to take time to contribute to this project. Also, a special thanks to our supervisor Henrik Malmberg for giving us the chance to perform this study and with his professionalism and passion inspired us to work our hardest.
We would also like to thank our never-ending source of industrial wisdom – Bertil I. Nilsson – for his guidance and support during this project. His valuable insights as well as the feedback given by our opponents – Hannes Teder and Gustav Wiklund – have helped us in producing this report. Lund 2012-06-01
Gustaf Heverius Mohammed Younis
iv
Abstract
Title The Road to Profitability through Technology Development.
- A wind power business assessment at E.ON Vind.
Authors Gustaf Heverius – Master of Science in Industrial Engineering and Management.
Mohammed Younis – Master of Science in Industrial Engineering and Management.
Supervisors Henrik Malmberg – Team leader, Project Development, E.ON Vind Sverige AB.
Bertil I. Nilsson – Adjunct Professor, Department of Industrial Management and Logistics, Lund Institute of Technology, Lund University.
Issue of study For the past ten years there has been a remarkable growth in the wind power industry. During 2003 – 2010 the production capacity increased by 456 % in Sweden, corresponding to total capacity of 2019 MW. An additional 754 MW was installed in 2011, and there is a planned capacity installation of 950 MW for 2012. This will, according to a prognosis from Svensk Vindenergi, generate a power production of 7.7 TWh in 2012 and 11 TWh in 2013. Furthermore, if the expansion continues at this rate, wind power will correspond to about 10 % of the total power production in Sweden by 2015.
Despite the rapid growth wind power projects are still dependent on government subsidies, i.e. green certificates. However, as the business continues to grow so do the technological advancements, thus providing new and more efficient wind turbine designs. Both incremental
v
as well as novel solutions have been developed over the years. In order to find new dominant designs they need to be evaluated both from a technical and a business point of view.
Purpose The purpose of this study is to investigate the possibility for technology development to further strengthen the Swedish wind power business case, and ultimately examine the potential for eliminating the need for government subsidies. Objectives The objectives of this thesis are the following:
Scan for trends in technology development and choose areas according to the scope and delimitations of the study.
Evaluate the chosen technical areas – both financial and non-financial aspects.
Depending on the outcome in the previous evaluation discuss the implications for the case company.
Methodology A case study with an analytical approach has been performed for the development of the evaluation method, which consists of both qualitative and financial measurements. The qualitative aspect is covered by a method for technology concept selection, which assesses technologies based on several criteria. These criteria have been developed through literature studies and interviews with concerned stakeholders in the wind power industry. The financial aspect is covered by a capital budgeting model, intended to assess the cost of the wind power case including all costs over its lifetime, capital expenditure, operations and maintenance, and cost of capital.
Conclusion A potential for single technology advancements to sustain the business case’s independence from green certificates has been identified. The
vi
technological development is mainly focused on increasing turbine size, i.e. generator output and rotor diameter. However, other incremental implementations have shown potential of business case improvements as well.
Key words Green certificates, technology development, onshore wind power, wind turbine generator (WTGs), business case evaluation
viii
Table of contents
1. Introduction ... 1 1.1 Background ... 1 1.2 Issue of study ... 2 1.3 Purpose ... 4 1.4 Objectives... 4 1.5 Delimitations ... 5 1.6 Target group ... 5 1.7 Report outline ... 5 2. Methodology ... 92.1 General characteristics of the study ... 9
2.2 Methodological approach ... 10
2.3 Research strategies ... 12
2.4 Data collection ... 13
2.5 Qualitative and quantitative data ... 17
2.6 Credibility ... 18
2.7 Source criticism ... 18
3. Theoretical framework ... 21
3.1 Wind power theory ... 21
3.2 Capital budgeting ... 23
3.2 Technology concept selection... 33
3.3 Strategic decision making ... 35
3.4 Linking theory with the study ... 36
4. Case company - E.ON Vind ... 39
4.1 E.ON Vind ... 39
5. Wind turbine design ... 43
5.1 General design layouts ... 43
ix
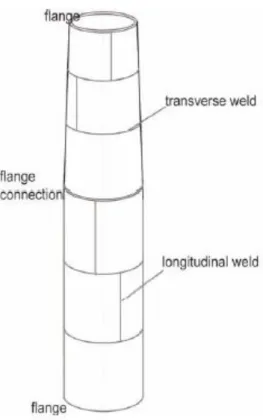
5.3 Tower ... 44
5.4 Rotor ... 46
5.5 Control system ... 48
5.6 Nacelle and yaw control... 48
5.7 Drive train ... 49
5.8 Gearbox ... 49
5.9 Generator ... 50
5.10 Transformer ... 51
5.11 Vestas V90 – reference site turbine ... 52
6. Technology development ... 53
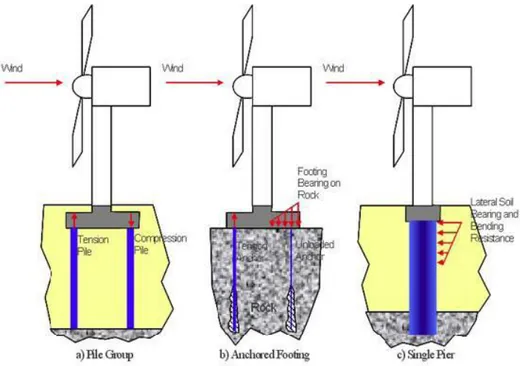
6.1 Rock anchoring foundations ... 53
6.2 Jointed blades ... 56
6.3 Tower ... 57
6.4 Erection methods ... 61
6.5 Individual blade pitch control with laser ... 62
6.6 De-icing system ... 62
6.7 Synchronous generators ... 64
6.8 Voltage converters ... 65
7. Business case evaluation model ... 67
7.1 Building the model ... 67
7.2 Financial model ... 69
7.3 Decision matrix ... 71
7.4 Combining the financial and qualitative aspects ... 73
7.5 Validating the model ... 74
8. Applying the model ... 75
8.1 Choice of reference site ... 75
8.2 Assumptions regarding financial input ... 75
x
8.4 First round results - Performance ... 77
8.4 First round results - OPEX ... 88
8.5 First round results - CAPEX... 94
9. Additional evaluation rounds ... 101
9.1 Second round results - Performance ... 101
9.2 Second round results – OPEX ... 103
9.3 Second round results - CAPEX ... 103
9.4 Third round results ... 104
9.5 Sensitivity analysis ... 106
10. Discussion... 111
10.1 First evaluation round ... 111
10.2 Second evaluation round ... 115
10.3 Third evaluation round ... 116
10.4 Sensitivity analysis ... 117
11. Conclusions and final remarks ... 119
11.1 Conclusions and suggested actions ... 119
11.2 Final remarks ... 122 12. References ... 125 Printed sources ... 125 Articles ... 127 Internet sources ... 128 Interviews... 129
Appendix 1. Nordpool electricity prices 2006 - 2012 ... i
Appendix 2. LCOE formula ... iii
Appendix 3. Overview of financial input ... iv
1
1. Introduction
This chapter is intended to provide the reader with the background of this thesis. The current situation in the wind power industry is initially presented in order to give the reader an understanding of the purpose and objectives of the thesis. Furthermore, delimitations and target group are presented.
1.1 Background
E.ON is one of the largest investor-owned power and gas companies in the world, and operates globally in a wide range of businesses within the energy sector. In recent years increased efforts have been focused towards the expansion of renewable energy production, where wind power plays a key role.
By the end of 2007 the power production from wind turbines in Sweden amounted to 1.43 TWh, corresponding to approximately 1 % of the total power production.1 The same year, EU adopted the 20/20/20 target, which states that the union’s greenhouse gas emissions are to be reduced by 20 % by the year 2020, relative to 1990 emission levels. The EU target furthermore states that 20 % of the energy consumption should come from renewable energy sources.2
Consequently, this demand for renewable energy has led to the introduction of financial incentives for the development of wind power production. The Swedish green certificate system is a market-based support system, intended to stimulate the expansion of power production from renewable sources. Producers of renewable electricity are allocated one certificate unit for every MWh they produce, which are then sold to suppliers who are obligated to purchase a certain quota of certificates.3 The
1 Energimyndigheten (2011c) 2 Energimyndigheten (2011a) 3
2
Swedish national aim is that by 2020 the production of electricity from such sources shall amount to 25 TWh annually.4 In addition, the Swedish government has set up a planning framework for wind power development equivalent to an annual production capacity of 30 TWh, of which 20 TWh onshore and 10 TWh offshore.5
For the past ten years there has been a remarkable growth in the wind power industry. During 2003 – 2010 the production capacity increased by 456 % in Sweden, corresponding to total capacity of 2019 MW.6 An additional 754 MW was installed in 2011, and there is a planned capacity installation of 950 MW for 2012.7 This will, according to a prognosis from Svensk Vindenergi, generate a power production of 7.7 TWh in 2012 and 11 TWh in 2013. Furthermore, if the expansion continues at this rate, wind power will correspond to about 10 % of the total power production in Sweden by 2015.
Despite the rapid growth wind power projects are still dependent on government subsidies, i.e. green certificates. However, as the business continues to grow so do the technological advancements, thus providing new and more efficient wind turbine designs. Both incremental as well as novel solutions have been developed over the years. In order to find new dominant designs they need to be evaluated both from a technical and a business point of view.
1.2 Issue of study
Technology development
The first mass-produced wind turbines had an average output of about 22 kW, which at the beginning of the 1990s had increased to approximately 4 Energimyndigheten (2011a) 5 Näringsdepartementet (2010) 6 Energimyndigheten (2011a) 7 Vindkraftsnytt (2012)
3
200 kW.8 Today there are turbines with an output of several megawatts, ranging from 2-5 MW, and even larger including turbines at the prototype stage. However, the average capacity for installed wind turbines in Sweden was 1.9 MW in 2010, which is an increase from 0.6 MW in 2003.9
Alongside with the increase in turbine output, there has been a gradual development towards larger turbines, e.g. higher towers and longer rotor blades. Furthermore, incremental design changes have continuously been developed in order to achieve more efficient turbines, and subsequently improved profitability.
Currently, the typical WTG (wind turbine generator) for large-scale commercial use is a horizontal three-blade turbine around 2 MW, with a welded steel tower. The conceptual design of these turbines are similar, however, technical features differ depending on the manufacturer.
Maturing market
In 2004 the Swedish Energy Agency specified a number of sites considered particularly suitable as wind power locations. Furthermore, in 2008 additional sites were included, adding up to a total of 2.2 % of Sweden’s surface.10 As the expansion continues, the competition for the most favorable sites hardens.
This growth has also led to a shift in the power balance between different stakeholders. From being a technology mostly applicable on a small scale by individual energy consumers, today’s turbines are used in large-scale commercial projects.11 This naturally provides commercial developers with more leverage over turbine manufacturers. Furthermore, on the manufacturer side, the playing field have become somewhat leveled as 8 Energimyndigheten (2011c) 9 Ibid. 10 Energimyndigheten (2011b) 11 Malmberg (2012)
4
new entrants are emerging, seeking market positions in the growing wind power industry, while existing suppliers seek to consolidate their positions. The larger, more established, manufacturers such as Vestas, Enercon, and Gamesa have faced a decline in activity over the years, while others such as GE Wind, Siemens, and Repower have increased their market shares.12 In the current situation, with an increasing number of suppliers, the developers are given a wider range of choices, thus enabling them to influence the development of technology in the desired direction. This is an important premise given the described situation, i.e. the dependency of green certificates and the limited number of appropriate sites. As the focus on these aspect surfaces it becomes clear that new turbine designs will be required to continue the expansion at the current pace.
1.3 Purpose
The purpose of this study is to investigate the possibility for technology development to further strengthen the Swedish wind power business case, and ultimately examine the potential for eliminating the need for government subsidies.
1.4 Objectives
The above described purpose will be achieved through the following objectives:
Scan for trends in technology development and choose areas according to the scope and delimitations of the study.
Evaluate the chosen technical areas – both financial and non-financial aspects.
Depending on the outcome in the previous evaluation discuss the implications for the case company.
12
5
1.5 Delimitations
Delimitations are established with regards to the project timeframe. This thesis will focus on commercial onshore projects within the wind power industry in Sweden.
1.6 Target group
The target group for this thesis is the wind power industry as a whole, but more specifically stakeholders within wind power project development.
1.7 Report outline
Chapter 1: Introduction – This chapter is intended to provide the reader with the background of this thesis. The current situation in the wind power industry is initially presented in order to give the reader an understanding of the purpose and objectives of the thesis. Furthermore, delimitations and target group are presented.
Chapter 2: Methodology – In this chapter an overview of the methodological choices that have been made are presented and discussed. Initially, in order to understand the choices made the general characteristic of the thesis is discussed. Subsequently, the chosen methodological approach, which is central to this study, is presented along with the research strategy and data collection methods.
Chapter 3: Theoretical framework – This chapter presents the theoretical framework used for this thesis. The presented framework has been chosen as a result of the methodical approach and the evaluation model. At first, the theoretical background regarding general wind energy is highlighted. Then, the theory that will constitute the business evaluation method is presented. At first, the necessary financial aspects concerning investment appraisal will be accounted for. The second aspect is the qualitative measure which implies a more strategic approach. For this measure a
6
concept selection method will be presented along with the SWOT analysis. All tables and figures in this chapter have been produced by the authors. Chapter 4: Case company – E.ON Vind – This chapter is intended to provide a short insight to the case company and the activities involved in the process of developing, constructing and operating onshore wind farm projects.
Chapter 5: Wind turbine design – This chapter presents the current characteristics in wind turbine technology. More specifically, the fundamental parts of the wind turbine, including foundation, tower and machine house, will be described in different possible layouts. It is necessary to understand the historic trends and limitations affecting technology development leading up to now. This will help understand chosen focus areas in chapter 6.
Chapter 6: Technology development – In this chapter the chosen areas of technology are presented, which are a result of the initial screening process. They constitute the different aspects of the WTG that will be further analyzed in the evaluation model. In this chapter only their technological features are described. A more detailed reasoning for including them in the study is later discussed in chapter 7.
Chapter 7: Business case evaluation method – This chapter will further describe the evaluation method, consisting of the financial model and the measuring of qualitative aspects. First, the model as a whole is discussed, followed by a review of each component regarding the underlying assumptions. Finally, the testing and validation of the model will be discussed.
Chapter 8: Applying the model – In this chapter the initial results from the business case evaluation is presented. A more extensive discussion regarding financial input parameters will follow. In addition, a sensitivity
7
analyses in the qualitative dimension will be done by considering the criteria for each decision. Moreover, the second evaluation round will be presented. For detailed information regarding input parameters and assumptions made, see Appendix 3. Also, in appendix 4 the full results of the qualitative evaluation can be found.
Chapter 9: Additional evaluation rounds – This chapter will present the evaluation rounds following the previous results, as well as a sensitivity analysis regarding the final results. Further evaluation rounds were performed after having analyzed the initial outcome. Some of the areas were chosen to be examined further with the aim of applying a more systemic approach and thus performing more detailed estimations regarding some of the cost structures. Finally, a sensitivity analysis is performed regarding uncertain parameters in the financial model.
Chapter 10: Discussion – This chapter is intended to present further discussions regarding the outcome of the business model evaluation, as well as the sensitivity analysis concerning the results.
Chapter 11: Conclusions and final remarks – In this final chapter, conclusions relating to the purpose and objectives are presented. Furthermore, the general credibility of the evaluation model and results are discussed. Finally, remarks regarding improvements and areas for further study are suggested.
9
2. Methodology
The aim of this chapter is to provide an overview of the methodological choices that have been made. Initially, in order to understand these choices the general characteristic and aim of the thesis is discussed. Subsequently, the chosen methodological approach, which is central to this study, is presented along with the research strategy and data collection methods.
2.1 General characteristics of the study
In accordance with the first objective an initial screening process was conducted. Both existing and new technological areas that were considered to potentially have an impact on the business case were examined. The second objective consists of two different aspects that make up for the evaluation of each technology area. The first aspect of measure is strictly financial, with the aim of analyzing the financial impact of chosen technological areas. The second dimension aims to cover all those aspects that are not quantifiable as input in a financial model. The purpose of this was to establish a more comprehensive view of the business case.
Moreover, the impact of each technology was subject to a comparative analysis with a specific business case, which was chosen to represent a reference point. The intersection of the two dimensions represented the chosen reference site.
A financial model was established in order to perform the calculations required by the case company for their investment decisions. The model was intended for providing a quick but accurate assessment of specific parameters to be compared with other business case evaluations. Since each case was subject to the same simplifications and assumptions it is possible to establish their relative financial status.
The qualitative dimension was examined together with key stakeholders in the industry. More specifically, surveys were distributed, section 2.3, with
10
the aim to measure the qualitative aspects of chosen areas relative to the corresponding solution at the reference site. Preceding interviews were held with employees at the case company as a part of the initial screening process. Furthermore, the outcome of these interviews, together with a SWOT analysis, was used for generating the qualitative measures used in the surveys.
2.2 Methodological approach
When conducting business research there are three different methodological approaches to be considered13; the analytical, systems, and actors approach, according to Arbnor & Bjerke (1997).
Analytical approach
The analytical approach assumes that reality has a summative character, i.e. the whole is the sum of its parts.14 Accordingly, once the researcher learns about the different parts of the whole, they can be added together to obtain the whole picture. The knowledge generated from this approach is characterized as being independent of the observer, which means that knowledge advances by means of formal logic represented by specific judgments independent of subjective experiences.15 Therefore, the result of the analytical approach provides pure cause-effect relations, logical models, and representative cases.16
Systems approach
The systems approach, which partly originated as a reaction to the analytical, is based on the assumption that reality is arranged in such a way that the whole differs from the sum of its parts. This means that the relationship between the parts is just as essential as the parts themselves,
13
Arbnor & Bjerke (1997)
14 Ibid. 15 Ibid. 16
11
due to synergy effects. The knowledge developed through this approach depends on systems, i.e. the parts are explained or understood through the characteristics of the whole, of which they are part.17
Actors approach
The actors approach states that the whole is understood by the characteristics of its parts, assuming that reality is a social construction intentionally created by processes at different levels of meaning structures. Knowledge is therefore based on actors, or individuals, where the whole is understood through the individuals finite provinces of meaning. Along with metatheories and other contributions the researcher is trying to understand relations among interpretations made by actors. These relations are various interpretations and factors mutually, and in constant transformation, influencing each other in a continuous developmental process.18
Choice of approach
The analytical approach was chosen for this thesis, since it enables the study of each variable in closer detail. The system was comprised of a single WTG, which ultimately was seen as part of the greater system, i.e. the general business case at the case company. While isolating all elements and then modifying them one at a time, the aim was to conclude rules that allows for the prediction of properties for a general system. However, the value of the analytical approach depends on the level of complexity in the studied system, where in a highly complex system it might be preferable to have a systemic approach. When aiming at deriving the optimal business case, the level of complexity rises due to the many more aspects needed to be taken into consideration, compared to when isolating elements of a single WTG. Therefore, there is a need to investigate potential synergy effects that are the result of single variable alterations.
17 Arbnor & Bjerke (1997) 18
12
This aspect will be discussed at a later stage in the report. Finally, the actors approach is not considered appropriate for this study.
2.3 Research strategies
Depending on the character and aim of the research, there are several strategies to be considered. The four most relevant, regarding master thesis projects within applied science, are survey, case study, experiment and action research.19
The approach for a survey is characterized by the study of a phenomenon within a broad research area at a specific time, dependant on the use of empirical data.20 Conclusions, regarding the target population, can be made by applying the survey on a chosen sample of the population, assuming the sample correctly represents the target population.21
The purpose of case studies is to describe an object or phenomenon in order to gain a deeper understanding of the area of study. This can be done by combining different types of data, as well as several research methods, which is encouraged when conducting a case study.22 An important issue regarding case studies is the general application of the results, where one can argue that it is not possible to draw any general conclusions regarding a target population from the results of one specific case. However, it can also be argued that even if the case is unique in some regards it is possible to place it in a wider context and therefore be able to draw conclusions regarding similar cases that share important characteristics.23
19 Höst et al (2006) 20
Denscombe (2009)
21 Lekvall & Wahlbin (2001) 22 Denscombe (2009) 23
13
An experiment is usually conducted with the aim of establishing the cause for the changes in the case issue at hand. The purpose is to determine the dependant variables from the independent variables, why it is important to arrange the experiment in such a way so that the results confirm this relationship.24
The fourth and final research strategy is action research, which is characterized by the desire to not only gain a better understanding of a phenomenon, but also manage a change within the studied issue. The process is iterative, where the initial results provide a suggested solution, which is then implemented and evaluated. The evaluation will subsequently be the basis for further studies, as this process is repeated until a desired solution is obtained.25
Choice of research strategy
The case study was considered to fit the overall purpose of the thesis. It is also compatible with the choice of the analytical approach. The studied reference site and the business case it represents were chosen as the case study. Also, the written survey strategy was included in this study as a part of the qualitative evaluation.
2.4 Data collection
It is important to distinguish between two types of data. Secondary data is information that has already been gathered and presented elsewhere. Primary data on the other hand is collected by the researcher from the original source, e.g. through interviews and observations. Research based solely on primary data rarely exists, however, it is possible to conduct research entirely based on secondary data, why it is important to scan for
24 Denscombe (2009) 25
14
existing data before gathering primary. Primary data is mainly gathered through different types of questioning and observation methods.26
Both primary and secondary data can be categorized in more or less detailed ways. According to Yin (2003) there are several sources of data when conducting case studies. There is no data source more advantageous than any other, which is why they should be used to complement each other.27 Furthermore, the use of multiple sources is an important method for enhancing the thoroughness of the research.28
Interviews
Lekvall & Wahlbin (2001) presents four typical ways of communicating with respondents when conducting interviews, i.e. written survey, telephone interview, personal interview, and interview via Internet. In the written survey, questions are asked and answered on a questionnaire that is distributed and returned by the inquirer and respondent without any mediation from an interviewer. A telephone interview is performed by an interviewer, where questions are asked and answered orally during a telephone conversation. The personal interview is similar to the latter, besides the fact that the interviewer and respondent have a personal encounter. Lastly, the interview via Internet is a relatively new way of conducting interviews. As with the written survey, there is no interviewer acting as a link between the inquirer and the respondent. Depending on the situation, each way of communication has its advantages and disadvantages. The personal interview is dynamic in terms of the possibility to ask any type of question and the opportunity to conduct an extensive interview, nevertheless, it is rather expensive and time consuming. The written survey and Internet interview are less expensive, thus appropriate for large samples. The telephone interview is somewhat a hybrid between
26 Lekvall & Wahlbin (2001) 27 Yin (2003)
28
15
the personal interview and written survey, since it utilizes some of the advantages of the personal interview, yet less expensive and not as time consuming.29
Direct observations
If a specific location of interest exists, within the scope of the case study, it can be subjected to a direct observation, which can be either formal or casual. For the formal observation certain protocols can be developed as part of the case study protocol, and the field-worker may be asked to measure the incidence of certain types of behavior during specific periods of time. Furthermore, by using multiple observers the reliability will be increased.30
Participant-observation
When conducting a participant-observation the observer may take on a variety of roles within a case study situation and even participate in the studied event. The main advantage is that participant-observations can provide the opportunity to observe a certain setting that would be inaccessible to scientific investigation. On the other hand, there are issues concerning potential biases when actively participating in a specific group or event.31
Choice of data collection method
The main source of primary data was through personal interviews. However, both telephone interviews as well as interviews via the Internet were performed, since personal interviews are time consuming and also more difficult to arrange due to different schedules. Furthermore, written surveys were distributed for gathering qualitative data. For each technology area two respondents were chosen to perform the survey.
29 Lekvall & Wahlbin (2001) 30 Yin (2003)
31
16
Regarding the collection of financial data it consists of two aspects. Namely, the cost structure for the investigated areas, which were gathered as both primary data through interviews, as well as secondary data using previously performed studies. Second, production simulations were performed using the wind assessment software WindPRO, in order to acquire production estimations for the investigated areas.
In some cases the respondents were reluctant to reveal financial data and also situations where the requested input was nonexistent due to lack of industry experience. In these cases, interviews were held in order to ask the respondent to make qualified assumptions, based on their position within the field of study.
The respondents were first approached by email, explaining the aim and prerequisites of the interview, and then asked to schedule a personal meeting if possible. The interviews were recorded in order to ensure full acquisition of information. Furthermore, written surveys were distributed among respondents internally at the case company. The intention of this was to quantify those aspects of technological enhancements that could not be taken into consideration in the financial model.
Furthermore, the data collection was characterized by several unstructured conversations and complementing questions due to the closeness to many of the sources. Complementing questions in the form of personal, telephone and email conversations were conducted in order to gain answers to additional questions, as well as verifying previously given answers.
Direct observations were performed early in the work process, in the form of field visits to specific sites. The purpose of this was to gain a deeper knowledge regarding the specific case study. In addition,
participant-17
observations were performed, since the authors spent most of the project duration at the case company’s office.
2.5 Qualitative and quantitative data
The distinction between the qualitative and quantitative research method is connected to the character of the collected data, i.e. whether or not the data is expressed in mere numbers, or in words and images. Furthermore, the research method partly coincides with the choice of research strategy, where case studies usually are more suitable with non-calculating methods, surveys and experiments generally with mathematic-statistical methods. However, it is possible to conduct mathematical calculations on qualitative data as well as performing a qualitative analysis on numerical data. According to Lekvall & Wahlbin (2001) the research strategy is more important, in regards to the outcome of the research, than the way which data is expressed. 32
Choice of method
Both qualitative and quantitative data was collected during the project. Initially, when researching the trends within technology development, a qualitative approach was used; e.g. interviews and literature studies. The qualitative evaluation of the different aspects of technological development was quantified with the distribution of surveys. Second, the data used for the financial input was gathered as both primary and secondary data regarding the cost structures, as well as production simulations as a base for the revenue input. In the case of these retrieval methods failing to deliver the required input the financial data was based on qualitative assumptions.
32
18
2.6 Credibility
There are three important aspects of valuation that should be taken into account when conducting a scientific study. Namely, validity, reliability, and representativity.33 Validity has to do with whether or not the data collection method measures what it is intended to measure.34 Reliability determines the consistency of the measurements, i.e. whether or not the results will be the same at repetition, and are not influenced by random errors.35 Representativity is to which extent the results are applicable in other cases.36
Achieving credibility
In order to achieve a high reliability multiple sources were used. Furthermore, all questions were formulated with the aim of being explicit and clear from bias. Also, whenever conflicting sources were found they were both confronted when possible. The use of multiple sources will, together with the efforts to increase reliability, ensure a high validity as well. The financial model was validated through the testing of known cases. Furthermore, a draft of the survey was initially performed on key employees before finalized. In addition, the reference site was chosen to represent the typical business case at the moment, and consequently an effort to strengthen the generalizability of the results. Finally, as the outcome of this study was presented the authors received valuable feedback from both the case company and academia that was used to further strengthen this thesis.
2.7 Source criticism
With the purpose of looking into the future development of the onshore wind business, there will be a certain degree of uncertainty affecting the
33
Rosengren & Arvidsson (2002)
34 Lekvall & Wahlbin (2001) 35 Ibid.
36
19
data. Some of the data regarding the financial input can only be based on assumptions, due to the lack of commercial projects from which data can be acquired, or the fact that existing projects are reluctant to reveal the actual outcome. Also, the qualitative evaluation of the chosen technology areas is likely to be subject to uncertainty, which is presumably due to operational inexperience among the respondents at the case company. In order to reduce the level of uncertainty that arises as a result of subjectivity it is important to ensure that the respondents receive explicit boundaries for each specific technology field so that they are able to make as qualified assumptions as possible. Furthermore, it is important to choose respondents that have particular experience in reference to each field.
21
3. Theoretical framework
This chapter presents the theoretical framework used for this thesis. The presented framework has been chosen as a result of the methodical approach and the evaluation model. At first, the theoretical background regarding general wind energy is highlighted. Then, the theory that will constitute the business evaluation method is presented. At first, the necessary financial aspects concerning investment appraisal will be accounted for. The second aspect is the qualitative measure which implies a more strategic approach. For this measure a concept selection method will be presented along with the SWOT analysis.
3.1 Wind power theory
Wind energy
Wind energy is the kinetic energy of air in motion. The wind’s kinetic energy can be determined with the following formula, where Pkin [W] is the kinetic
energy; p [kg/m3] the air density; A [m2] the area of the cross section, and v [m/s] the wind speed passing the cross section:37
The implications of this formula are that power increases eightfold when the wind speed doubles, which emphasizes the importance of choosing appropriate sites in regards to wind conditions. The amount of energy a turbine can produce is determined by the wind’s kinetic energy multiplied by the time it is producing, typically expressed in kilowatt-hours, kWh. However, it is not enough to know the mean wind speed at a location in order to assess the potential production, since the frequency may differ for two sites with the same average wind speed.38 The wind conditions for
37 Wizelius (2007) 38
22
each site are therefore carefully assessed by conducting wind measurements in order to determine the wind speed distribution.
The energy in the wind is converted to electricity by the turbine’s rotor and generator. However, it is not possible to utilize 100 % of the wind’s energy. If the turbine was to consume all of the incoming wind energy then the wind speed would be zero after the turbine, thus inhibiting more wind to pass through.39 In order to keep the flow of wind through the turbine it is necessary that not all of its energy is consumed. A WTG is most efficient when the wind speed is reduced by 1/3 at the rotor and by an additional 1/3 after the rotor. The proportion of the wind’s kinetic energy that can be utilized by a WTG is determined by Betz’s law and corresponds to the power coefficient Cpmax = 0,593. The maximum power a turbine can
generate is consequently:40
This is the theoretical upper limit that can be obtained by a turbine. In practice, Cp will be lower due to aerodynamic and mechanical friction
losses.41
Turbulence
When moving air encounters obstacles it will move around it, creating air vortexes along the primary wind direction. These air waves are measured as short variations in wind speed and direction, i.e. turbulence. With increased height the turbulence is generally lower since the winds are farther away from obstacles in the terrain.42 The avoidance of turbulence is an important aspect of wind power production, since the sudden changes in wind speed and direction have a strenuous effect on turbine components. 39 Wizelius (2007) 40 Ibid. 41 Ibid. 42 Ibid.
23
Therefore, it is necessary to aim at avoiding turbulence, but also designing the WTG to be able to handle the inevitable turbulences.
3.2 Capital budgeting
In order to determine a wind energy system’s commercial feasibility it is first necessary to be able to assess its relative economic benefits. This method should be easy to understand, free from detailed economic variables and easy to execute.43
When it comes to making investment decisions in general it is necessary to analyze profitability, and primarily making sure the investment fulfills certain requirements. Profitability alone is, however, not a sufficient enough measure when determining the appropriateness of an investment.44
The size of the investment for wind power projects will naturally depend on the size of the wind farm, but still the typical wind power project is characterized by large investments and a long project life time. For this reason, it is important to have a good understanding of the cost driving activities and cash flows, during the entire lifetime, in order to be able to conduct a reasonable profitability analysis. However, there are other important aspects of investment decision making which need to be taken into consideration, for example strategic fit as well as other qualitative assessments. Yet, simple capital budgeting methods are used as a financial measure to determine the strength of specific investment proposals.45
Investment criteria
46One of the most fundamental financial principles is that money has a time value. This means that receiving dollar today is considered to be worth 43 Manwell et al. (2002) 44 Yard (2001) 45 Ibid. 46 Ibid.
24
more than receiving a dollar tomorrow. This is the case since it is possible to invest the amount of money received in the today to generate a future profit. So when evaluating an investment proposal it is not accurate to compare cash flows that occur at different times without discounting them to a mutual date.47 When doing so it is possible to see the amount of money needed today so that the future payments can be made.
In order to calculate the present value of an investment proposal the opportunity cost of capital is used as discount rate. The cost of capital is the expected rate of return that is being given up by investing in the project. Therefore, a project’s expected future payoff should be discounted using a known rate of return offered by equivalent-risk investments in the capital market. The present value then corresponds to the market value of the project.48 The present value is then compared to the required investment, which represent the net present value (NPV). Consequently, the NPV is the amount of money that the project will add to shareholder wealth. This results in the decision rule of accepting all projects that have a positive net present value. This rule can be applied to projects of any length.
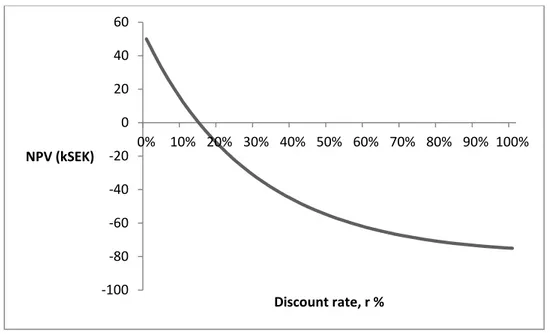
The internal rate of return (IRR) of a project corresponds to the discount rate for which the NPV is zero. Hence, comparing the IRR to the opportunity cost of capital will answer the question whether or not to accept the project. If the IRR is higher than the opportunity cost of capital the NPV will be positive and consequently negative when the IRR is lower. This means that the NPV rule and the rate of return rule are equivalent.49 However, this is only true as long as the NPV declines smoothly as the discount rate increases. Such a NPV profile is shown in the figure below.
47 Yard (2001) 48 Brealy et al. (2001) 49
25
Figure 1 – A generic NPV profile when the NPV and IRR rule are equivalent. Authors own.
Opportunity cost of capital
50The choice of discount rate can be crucial, particularly when large capital expenditures are involved and/or when the project lifetime is very long. It is therefore important to think about what the company cost of capital is, and what it is used for. It is defined as the opportunity cost of capital for the firm’s existing assets, which are used in order to value new assets that have equivalent risk. Since most companies issue debt as well as equity, the company cost of capital is a weighted average of the returns demanded by debt and equity investors. This weighted average cost of capital (WACC) will take into consideration the capital structure of the company, i.e. the proportion of debt (D) and equity (E), and the expected rate of return required from both debt (rdebt) and equity (requity) holders.
50 Brealy et al. (2001) -100 -80 -60 -40 -20 0 20 40 60 0% 10% 20% 30% 40% 50% 60% 70% 80% 90% 100% NPV (kSEK) Discount rate, r %
26
Companies can raise money from many different sources, e.g. convertible debt, warrants, options, preferred stock, etc. These different sources of finance are expected to generate different returns, thus making WACC calculations increasingly difficult as the firm’s capital structure becomes more complex. The formula above is, however, easily extended, consequently adding additional weighted securities with its expected rate of return. However, for the WACC to be an appropriate discount rate, each project must be in accordance with the firm’s existing business. Furthermore, the cost of capital must be based on what investors are actually willing to pay for the firm’s outstanding securities, i.e. the securities’ market values. Consequently, the company cost of capital depends on how its investors value the firm’s securities, which in turn depends on future profits and cash flows.
Finally, when calculating cash flows for a specific project it is considered to be all equity-financed, regardless of the structure of the financing.
Pitfalls with the IRR
As previously mentioned, the IRR rule will only provide the same answer as the NPV rule as long as the NPV is declining as the discount rate increases. Common pitfalls that may occur when it does not will be illustrated with a few examples:51
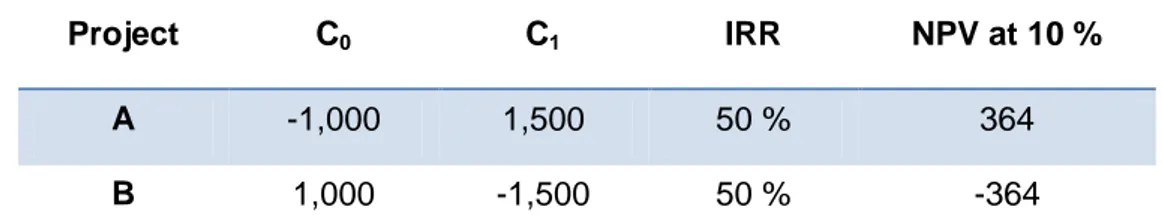
First, looking at the projects in Table 1, both of them have the same IRR, indicating that they are equally attractive investments. However, when considering their net present value it becomes clear that project B is a poor choice of investment. In project A, money is being lent out at a 50 % return rate, whereas in project B, money is being borrowed at a 50 % return rate. Consequently, the IRR rule, as earlier stated, does not apply in this case.
51
27
Project C0 C1 IRR NPV at 10 %
A -1,000 1,500 50 % 364
B 1,000 -1,500 50 % -364
Table 1 – Cash flows, IRR, and NPV for two arbitrary projects. All figures are in kSEK. Authors’ own.
The NPV profile for project B, shown in Figure 2 below, shows that the net present value increases as the discount rate increases, implying that the IRR rule is reversed in these cases. This project must have an IRR less than the opportunity cost of capital in order for it to be considered as an attractive investment.
Figure 2 – NPV profile for project B from Table 1. Authors’ own.
Project C in Table 2 below has two different internal rates of return. The reason for this is the double sign change in front of the last cash flow.
-600 -400 -200 0 200 400 0% 10% 20% 30% 40% 50% 60% 70% 80% 90% 100% NPV (kSEK) Discount rate, r %
28
There can be as many internal return rates as there are sign changes.52 This implies that the general IRR rule does not work here either.
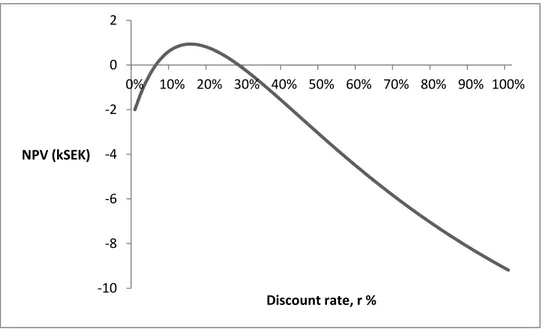
Project C0 C1 C2 C3 C4 C5 IRR NPV at 10 % C 22 15 15 15 15 -40 6 % & 28 % 0,7
Table 2 - Cash flows, IRR, and NPV for an arbitrary project. All figures are in kSEK. Authors’ own.
The NPV profile for project C, Figure 2, shows that the investment has a positive outcome when the opportunity cost of capital is in the interval 6 – 28 %, which is confirmed by the positive NPV in the same range.
Figure 3 – NPV profile for project C from table 2. Authors’ own.
Finally, caution should be taken whenever considering mutually exclusive projects. In practice firms do not have unlimited resources to spend on projects, but instead they must choose among several possibilities. Considering project D and E in Table 3, both can be said to be good 52 Brealy et al. (2001) -10 -8 -6 -4 -2 0 2 0% 10% 20% 30% 40% 50% 60% 70% 80% 90% 100% NPV (kSEK) Discount rate, r %
29
investments since the NPV is positive. However, the project with the highest NPV is not necessarily the one with the highest internal rate of return. The IRR rule does in this case favor the quick payback of project D, which has a higher percentage return but lower NPV.
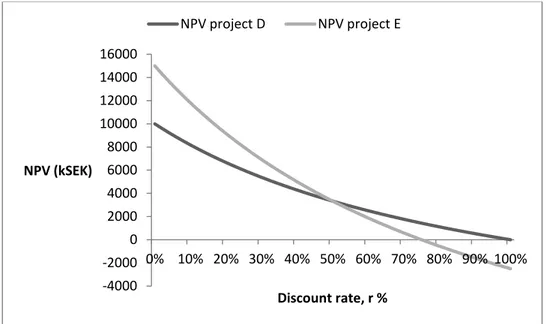
Project C0 C1 IRR NPV at 10 % NPV at 60 %
D -10,000 20,000 100 % 8,182 2,500
E -20,000 35,000 75 % 11,818 1,875
Table 3 – Cash flows, IRR, and NPV for two arbitrary projects. All figures are in kSEK. Authors’ own.
In figure 4, the NPV profiles for both projects are plotted. Clearly, the choice between the two projects depends on the firm’s opportunity cost of capital. The projects’ NPV profiles intersect at a discount rate of 50 %, which implies that if this is the firm’s opportunity cost of capital both projects are equal according to the NPV rule. However, when the opportunity cost of capital is lower than 50 % project E is the better investment, and project D is consequently better when the cost of capital is higher than 50 %.
30
Figure 4 – NPV profile for projects’ D and E from table 3. Authors’ own.
To conclude, the IRR rule is not always a sufficient measure by itself. The principle behind making good investments is choosing activities that increase the value of the firm. Projects that earn a good rate of return for a long time usually have a higher NPV compared to those who offer a high percentage rate of return for a shorter period of time.53
Forecasting cash flow
54Perhaps the biggest challenge in capital budgeting is forecasting the cash flows. Often there is only raw data available, which need to be processed before it can be used. Also, most financial forecasts are based on accounting principles that do not necessarily recognize cash flows when they happen. When identifying cash flows it is important to recognize investment expenditure as they occur, since it is the generated cash that determines if a project is financially attractive. The accounting profit differs from cash flow, in the sense that the profit can occur before it has generated any cash.
53 Brealy et al. (2001) 54 Ibid. -4000 -2000 0 2000 4000 6000 8000 10000 12000 14000 16000 0% 10% 20% 30% 40% 50% 60% 70% 80% 90% 100% NPV (kSEK) Discount rate, r % NPV project D NPV project E
31
A project’s cash flow should be based on the incremental cash flow, i.e. the additional cash flow it produces compared to the option of not proceeding with the investment. In doing so, all indirect effects of accepting a project should be included as well. There is an opportunity cost related to the resources involved in a project, that is equal to the cash generated by selling the resource, and therefore it is a relevant cash flow when evaluating the project. Furthermore, sunk costs should not be included, since they remain the same whether or not the project is accepted, thus having no impact on the net present value.
Furthermore, investments in working capital need to be accounted for. The net working capital is the difference between a company’s short-term assets and liabilities. Most projects require additional investments in working capital, since cash outflow occurs when inventories are built up or customers are slow to pay. Depending on the characteristics of the business and the payment requirements toward customers and suppliers the required investment in working capital will vary. However, the investment in working capital will be recovered at the end of the project life time.
The third component of project cash flow comes from operations, which can be calculated in several ways. One method is to subtract all cash expenses and taxes paid from the revenues. Alternatively, looking at the accounting profit and adding back any deductions made for noncash expenses, e.g. depreciation. A third way is to calculate net profit assuming no depreciation ((revenues – cash expense) * (1- tax rate)) and then adding back the tax shield created by depreciation (+ (depreciation * tax rate)). Although the depreciation deduction is a noncash expense it does affect net profit and taxes paid, which is a cash item. All three methods will give the same answer.
32
To conclude, a project’s cash flow can be considered as the sum of three components; investments in fixed assets, investments in working capital, and cash flow generated from operations.
Real vs. nominal cash flows
The distinction between nominal and real cash flows and interest rates is another important aspect of capital budgeting. Interest rates are usually expressed in nominal terms but the real interest rate on a bank deposit depends on inflation as well. Therefore, if the discount rate is nominal it is required that the cash flows are estimated in nominal terms as well, thus having to take into account trends in selling price, labor, material costs, etc.55 Applying a single assumed inflation rate to the cash flow is not sufficient enough, since some costs and prices may increase faster than inflation while others increase slower.56 It is also possible to discount the real cash flows instead of the nominal, although it is not commonly done. However, real cash flows discounted at a real discount rate will give the same present value as nominal cash flows discounted at a nominal discount rate.57
Inflation is defined as the overall increase in prices.58 This increase, in the general level of prices, means that the purchasing power of money has weakened. A way of keeping track of the general level of prices is the use of different price indexes. The consumer price index (CPI) is the most common used measure for tracking the price development, and thus inflation59. CPI is intended to show, on average, how consumer prices are developing for the private domestic consumption. Accordingly, the percentage increase in the CPI from one year to another corresponds to 55 Yard (2001) 56 Brealy et al. (2001) 57 Ibid. 58 SCB (2012) 59 Ibid.
33
the inflation rate. Sveriges Riksbank, the Swedish central bank, is responsible for the monetary policy in Sweden, thus responsible for maintaining the national inflation target, which has been set to 2 %.60
3.2 Technology concept selection
61The decision-matrix method developed by Stuart Pugh is a way of quantifying multi-dimensional options, in order to be able to rank them and thereby support the decision making process. It is frequently used in engineering field, often to solve construction and design issues, though applicable in any situation involving a set of choices.
When facing a decision or problem, the first action will be to determine a set of alternative solutions. Second, people with knowledge regarding aspects that will influence the choice are asked to list certain criteria and weight them according to the impact that each criterion has on the decision. Thereafter, each possible solution will be graded based on how well they meet each criterion. In order to be able to value the possible solutions, a reference point is used, which could be an existing product or approach that is the current solution to the problem. Nonetheless, the reference point is used as a benchmark when evaluating the different concept solutions. Therefore, it is given the value 0, thus enabling each concept to be graded as either better (> 0) or worse (< 0) than the reference, or equivalent (=0) to it. Any scale seen fit can be used, however a scale ranging from -2 to +2 is frequent implemented, where each step corresponds to the following valuation: much worse than, worse than, equal to, better than, and much better than the reference for the specific criterion.
When the grading has been finalized, the results can be computed in several ways. It is possible to simply summarize the grades for each alternative, which will provide the total score. Also, the number of plus
60 Sveriges Riksbank (2010) 61
34
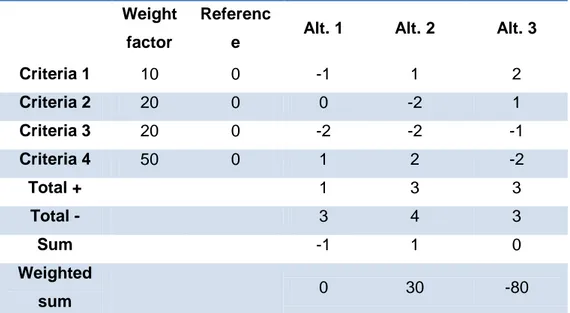
scores and minus scores can be shown separately in order to visualize the spread. It is possible that an alternative with the highest total score has a high spread, thus perhaps making the choice of that alternative questionable. However, the total score should be seen as guidance in the decision making process, furthermore if the two top alternatives have similar scores they need to be examined closely. The weighted total can also be acquired, by applying the proportion of importance to each criterion, i.e. summarizing each score multiplied with their weighting factor, thus giving each grade a more relevant significance.
Following is an example of a generic matrix representing a decision process with three possible solutions. The criteria have been chosen by the level of significance they have on the decision, and weighted accordingly. Each alternative has been graded on a scale from -2 to +2, as previously described, based on how well the alternative is considered to perform in each criterion, relative to the reference point.
Weight factor
Referenc
e Alt. 1 Alt. 2 Alt. 3
Criteria 1 10 0 -1 1 2 Criteria 2 20 0 0 -2 1 Criteria 3 20 0 -2 -2 -1 Criteria 4 50 0 1 2 -2 Total + 1 3 3 Total - 3 4 3 Sum -1 1 0 Weighted sum 0 30 -80
35
Alternative 1 has a weighted sum of 0, indicating that it performs just as well as the reference case. However, not considering the weighting of the criteria will indicate that this alternative is worse than the reference. Nonetheless, since criterion 4 has a substantial impact on the decision it will strongly favor any alternative with a positive grade in that dimension. Provided that the weightings display an accurate view of the problem situation, the weighted sum will present a more dynamic decision basis. This method is an effective approach of handling decision-processes with a set of multi-dimensional options. Furthermore, it is beneficial since it is possible to easily conduct sensitivity analyses, i.e. see the required change for a specific alternative before it becomes a high rank option.
3.3 Strategic decision making
62The SWOT analysis is a widely used planning tool for strategic decision making. It is applicable when evaluating projects or business ventures and their effects on strategy development. The aim of the analysis is to identify key internal and external factors that are significant in the process of achieving specific objectives. The internal factors include all the strengths and weaknesses of the project, which consequently can be managed within in the firm. The external factors take into account the opportunities and threats that lie in the surrounding environment. These are however much more comprehensive, including aspects of macroeconomics, technological developments, legislation and policy change etc.
The analysis is typically visualized with a matrix, and Karppi et al. (2001) suggests the following actions to be implemented after the SWOT analysis has been established: “Build on strengths, eliminate weaknesses, exploit opportunities, and mitigate threats.” This is to ensure the successful execution of long-term projects.
62
36
The method itself is however not particularly preferable for in-depth analyses since it lacks some matters that should require attention. However, if these shortcomings are adjusted for it could act as balance favoring the long-term perspective. Some of the intended concerns are displayed below. 63:
The length of the lists.
No requirement to prioritize or weight the factors identified. Unclear and ambiguous words or phrases.
No obligation to verify statements or opinions with data or analyses. No resolution to contradictions in itself.
Single level of analysis is all that is required. No logical link with implementation phase.
3.4 Linking theory with the study
An understanding of wind power theory and the physicality of wind energy is required for both identifying potential focus areas and furthermore necessary for the performed production simulations and estimations of power curves for increased rotor diameter (see Appendix 4 – Increased rotor diameter).
Theories regarding capital budgeting were used in order to ensure that the financial model functions according to the necessary economic principles and still applicable as a comprehensive and accurate, yet user-friendly tool. In order to maintain this aim it was necessary to make certain assumptions and simplifications, however the theoretical background was intended to ensure that the model fulfills the fundamentals of financing. These assumptions are further described in section 7.2.
63
37
The SWOT-analyzes was incorporated in the early stages of the project, serving as the premise for the initial meetings within the case company. The purpose of these interviews was to function as part of the technology screening process but also for mapping out the qualitative measures. To summarize, the main aspects of the presented theoretical framework will constitute the basis for the evaluation method. The framework used for the financial model will constitute one dimension in the evaluation. The second dimension will be comprised of the qualitative aspects of the business case, which will be quantified using the Pugh concept selection approach.
39
4. Case company - E.ON Vind
This chapter is intended to provide a short insight to the case company and the activities involved in the entire process of developing onshore wind farm projects.
4.1 E.ON Vind
E.ON Vind is headquartered in Malmö, Sweden and operates in Denmark, Norway and Finland as well. Its activities to achieve their aim of customer satisfaction are described by four main processes. Namely, Identify and secure business opportunities, Develop project, Construct site, and Operate and maintain site.
Identify and secure business opportunities
64A project is initiated by the search for a business opportunity, i.e. finding an appropriate site and searching for potential business partners. The potential project is evaluated further by conducting an investment calculation. However, at this stage, there are no detailed wind assessments or decisions regarding turbine specifications, thus making the initial project evaluation a rough estimation. The emphasis in this process is to secure the project by negotiating with land owners, as well as focusing on the strategic fit of the project. As the project is secured it can be planned more specifically and consequently handed in for a Gate 1 decision. Finally, when the project is approved at G1 it will then proceed to the project development phase.
Develop project
65Once the project has received its G1 clearance, the process of conducting more detailed site studies and investment calculations can take place. Several technical evaluations are performed, namely wind assessments,
64 E.ON intranet (2012) 65