Jan Olof Snihs
SSI-rapport 96-08
f'ostadress 171 16 STOCKHOLM95. o7.
r...:
Gatuadress Karolinska sjukliuset So!na Telefon 08"729 71 00Contamination and Radiation Exposure
Evaluation and Measures in the Nordic Countries
after the Chernobyl Accident
Titelblad/Title page
Forfattare I Author:
Avdelnlng I Division:
Jan Olof Snihs
Director General Office.
GD-staben
Dokumentets tlteiiTitle of the document:
Contamination and Radiation Exposure.
Nummer I Number:
96-08
Datum I Date of Issue: 1996-05-10
Antal sldor I Number of pages: 41
ISSN:
0282-4434
Evaluation and Measures in the Nordic Countries after the Chernobyl Accident.
Sammanfattnlngl Abstract:
This is a summary of the major consequences in the Nordic countries of the
Chernobyl accident during a time period of 5 - 10 years after the accident 1986. There
is information given and discussions on the emergency system at that time, the
depo-sition in the Nordic countries, the dispersion in the environment, resulting external
and internal doses, countermeasures and their costs and effects. More than 10
%
of
total release of cesium-137 was deposited over the Nordic countries, deposition
den-sity up to about 200 kBqm-
2and the estimated collective effective doses over 50 years
about 24 000 manSv.
This article has been presented in a BfS/SSK-Seminar "Ten Years After
Chernobyl, a Summation" Munich, 6- 7 March, 1996.
Detta iir en sammanfattning av konsekvenserna i de Nordiska liinderna av
Tjernobylolyckan. Beredskap, nedfall, beliiggning, spridning i rnilji:in, resulterande
closer, motatgiirder beskrivs. Beliiggning upp till ungefiir 200 kBqm-
2,cirka 24 000
manSv over 50 ar beriiknas
fran
nedfallet som motsvarade mer iin 10
%
av totala
utsliippet.
Denna artikel har presenterats pa ett BfS/SSK seminarium
"Tio ar efter Tjernobyl, en sammanfattning" i Miinchen, 6- 7 mars, 1996.
Nyckelord (valda av fOrfattaren) I Key words (chosen by the author):
Summary
Contamination and Radiation Exposure.
Evaluation and Measures in the Nordic Countries
after the Chernobyl Accident
Jan Olof Snihs
Swedish Radiation Protection Institute
171 16 Stockholm, Sweden
In the night 25/26 April1986 it all started. The radioactive releases from Chernobyl reached the
Nordic countries late 27 April. At noon the following day all the world knew that an accident had
occurred - two and a half days after it started.
In April.l986 there was, generally speaking, quite a high level of preparedness for nuclear
accidents in the Nordic countries but still, as it was shown, quite insufficient for accidents abroad
with such extensive countrywide consequences as the Chernobyl accident proved to have.
The total depo.sition over the Nordic countries was about 10 PBq Cs-137 and the major part was
found in wet deposition areas.
Asa total of about 80-90 PBq Cs-137 is assumed to have been
released from Chernobyl, more than 10% was deposited over the Nordic countries with the ·
average Cs-137 concentration of 1.2 kBqm"
2in Denmark, 11 in Finland, 5.1 in Norway and 10 in
Sweden.
The deposition from the Chernobyl accident added to the present fallout from the atmospheric
tests in early 60's. The two depositions were of the same order of magnitude e.g in Sweden 4.25
PBq of Cs-137 from Chernoby1 and 1.25 PBq from the atmospheric tests. However the fallout
during the 60's-was rather evenly distributed with an average of about 3 kBqm"
2while the
Chemobyl deposition was extremely variable from almost zero up to about 200 kBqm·
2 •.The deposition ofl-131 was also of interest from the radiation protection point of view. However
because of the relatively short half-life ofl-131 (8 days) there was only a problem the first weeks
when care had to be taken in allowing the cows to go outdoors to avoid contamination of
milk.
The deposition ofSr -90 and its dose consequences for people were minor in comparison with Cs
134+137, about two order of magnitude less.
The deposition ofPu 239+240 was on average less than 1% of the earlier deposition from nuclear
test fallout ( 40 Bqm"
2).The radiological impact ofPn is insignificant. There were also some
observations of so called hot particles in the air over the Nordic countries. They were not
considered to imply any significant radiological risk.
The Cs-activity on the ground has decreased by physical decay and by wash-out/run-off processes
followed by outflow in rivers into surrounding seas. However, the outflow to the Baltic Sea
waters decreased rapidly and the total outflow from land during the first three years corresponds
only to about 2% of the total Chernobyl fallout over Finland and Sweden as compared to 7%
diminution caused by physical decay. Therefore it could be concluded that much of the Cs-137
deposited on ground still remains in the soil and in stream sediments in catchment areas of lakes.
Most of the radiocesium eutering the lakes was rapidly trausfeiTed to the bottom by sedimeutation. The total amonnt of Cs-137 in most lakes has not changed siguificantly more than by physical decay since 1986, and the sedimeuts contain from 80 to almost 100% of the Cs-137 in ~akes. The fallout from the Chemobyl accideut caused heavy contamination ofthonsands of lakes m the Nordic conntries. In Swedeu alone about 14000 lakes were contaminated so seriously that the fish had activity concentrations exeeding the level applied for fish not allowed to be sold on the open market (1500 Bq/kg ofCs-137). There are still several thousands lakes of that kind and the problems with lakes and fish are predicted to exist even into the 21st century.
The contamination of terrestrial vegetation in the first period after the Chemobyl accident was primarily by direct contamination, particularly in the southern part of the Nordic conntries. In the northernmost part there was still some suow cover at the time of the accident. Gradually the contamination was caused by root uptake of activity deposited on gronnd. All assumed transfer factor ofO.l m2icg·1 the first year and 0.01 m2kg-1 following years does not seem to nnderestimate the uptake in grass in most cases.
For edible parts of crops the transfer factors lie between 0.001 and 0.01 m2kg·1 during 1986 aud between 0.0001 and 0.001 m2kg"1 1987-1990. Because ofthese low values contamination of agricultural products has not been a problem.
That is also tlue for milk (cow). The mean Cs-137 activity in dairy milk in 1986 and 1987 varied from 0.6 to 20 Bqr1 in the Nordic conntries. The aggregated transfer factor (Bqr1 milk per Bqm·2 gronnd deposition) has decreased for all conntries. The transfer ofCs-137 from vegetation to cows' milk did not change· siguifican(ly during 1986-1992 and ranged from 0.005 to 0.03 dr1 (Bqr1 milk per Bq ingested daily by the cow) with a general mean of about 0.01 dr1• The effective
ecological half.. life for Cs-137 in milk was 1-2 years for all Nordic conntries. The maximmn activity concentration in milk was reached 8-9 days after the cows had been taken out for grazing.
The average transfer factors for sheep (Bqkg·1 meat fresh weight per kBqm·2 soil} for the years 1990-1993 are for Denmark 0.6, Finland 0.8, Iceland 15, Norway 39 and Sweden 47 (one place only}. The ecological half-life for Cs-137 in sheep has been estimated to be about 13 years in nndisturbed areas. Contamination of sheep has been a problem particularly in Norway.
Forest and part of alpine areas are important as pasture for grazing animals, for hnnting, for · berries, mushrooms etc. After 2-4 years after the fallout the transfer factor varied between 0.005
and 0.1 m2kg·1 dry weight of wild plants. In more acid forests, the transfer factor could be 10 times higher and in fungus fruit bodies further 10 times higher. As the gronnd contamination in many areas was 50 kBqm·2 and more, it is easily nnderstood that forest berries and other edible wild plants can be heavily contaminated. This is particularly a problem with mushrooms (transfer factor aronnd 1-10 m2kg"1}. The ecological half-life ofCs-137 in forest plants may be 5-10 years or more.
Contaminated plants also mean contamination of the animals in the forest. Moose and deer are most siguificant from the radiation dose point of view. As there are several hnndred thousands of hnnters in the Nordic countries there is potentially a large critical group and therefore the activity ofCs-137 in moose and deer has been given high attention. Still 10 years after the Chemobyl accident, moose and deer constitute a problem in some parts of the Nordic countries. Until more is known, it is suggested that the effective ecological life would be the same as the physical half-life ofCs-137 (30 years).
Reindeer are ofpatticular interest because reindeer meat is an important part of the diet of the Laplanders and because reindeer meat can be heavily contaminated because of the reindeer's consnmption of contaminated lichen. The contamination of reindeer was a great problem in Norway and Sweden, and activity levels up to 150kBq!kg were foUlld. In Sweden in 1988 more than a third of the slaughtered animals had an activity concentration of more than 1000 Bqkg-1 • In Finland the levels were generally less than 1000 Bqkg'1• The estimated effective ecological half-life
ofCs-137 in reindeer is 3-4 years tending to become longer.
The radiation dose during the first weeks was dominated by the dose caused by inhalation and the external dose from the cloud and from radionuclides deposited on the groUlld. In most parts of the Nordic coUlltries the estimated effective dose caused by external radiation during the first year-after the accident was less than 0.5 mSv. In some areas it was up to about ten times that for a few hUlldred people. The collective doses over 50 years are estimated to be for Denmark 700, Finland 6000, Norway 5000 and Sweden 5000 manSv. That corresponds to a total individual dose on average for the Nordic coUlltries of about I mSv which is less than I% of the natural radiation over that period of time.
The internal doses are mainly caused by ingestion ofCs-134+Cs-137 with food. The levels of internal contamination depends on diet, composition of food, place offood production, co\llltermeasures to reduce activity concentration and time after 1986. The corresponding
collective effective internal doses caused by contaminated food over 50 years would be about 150 manSv for Denmark, 3500 for Finland, 2500 for Norway and 1000 for Sweden making about 7000 manSv in total. That means that the internal dose in average over 50 years for the Nordic coUlltries is about 0.3 mSv.
It was early concluded that measnres like evacuation, sheltering and intake of stable iodine were not justified. But other measures were taken e.g giving information and advice to general public and specific groups (farmers etc ), making measurements in the environment, on food and on m~ issning regulations, restrictions and advice and improving the emergency preparedness systems. Decisions on co\llltermeasures in the Nordic COUlltries were in the area of agriculture, reindeer, sheep, game and fresh water fish. Examples are changing farming habits, using cesium binders for animals, moving reindeer to UliContaminated areas, feeding sheep with Ullcontaminated fodder etc. The costs of co\llltermeasures, compensation, equipment, information etc because of the
Chernobyl accident have up to now been 150-250 million US$ for. the Nordic coUlltries together. The objectives of these actions have generally been reached. The measures taken were sometimes cost-effective i.e the cost per saved manSv was reasonable as compared with a Nordic agreed value of 100 000 $per manSv. But sometimes not, particularly not for more expensive co\llltermeasures.
The situation today
is
that although the radiation levels have decreased a factor 2 or more, sometimes much more in Sweden and Norway, there are still areas and food that need special attention. The areas are those most heavily contaminated and the food is reindeer, sheep, moose, roe deer, fish and mushrooms, particularly from these areas. There are still several thousand lakes with fish containing more radiocesium than allowed for fish in the open market.The emergency preparedness has been improved in all coUlltries and there is now a much better knowledge of possible consequences and preparedness for taking decisions on co\llltermeasures, making measurements and giving advice. There is also a much improved system for early warning and for exchange of data and information.
The first day
In the moming of28 April 1986 workers arriving to the Forsmark nuclear power plant in Sweden were stopped at the entrance gamma/beta monitor as being contaminated. TI1e first reaction of the radiation protection staff and management at Forsmark was that there had been an accidental release somewhere at the plant and preparation was made for evacuation of those people not absolutely necessary for radiation protection and safe operation of the reactors.
The Swedish Radiation Protection Institute, SSI, was informed by the responsible person at the Forsmark plant soon after their observations in the moming of 28 April at about I 0 o'clock am. It was first understood as "a good exercise of the emergency organization of the plant". However more information was continously reported to SSI from activity measurements in other parts of Sweden and it was soon concluded that the activity was not caused by any release from Forsmark. Information of activity measurements in Finland and Norway, air measurements from ground, weather information and dispersion trajectories indicated that the releases originated from some reactor in Ukraine. After contacts with Moscow on govemmentallevel it was announced from Moscow later that day that there was an accident in Chemobyl Unit 4, had occurred about two and a half days earlier. From that time and for several months thereafter the life was not the same for anyone in the Nordic countries and particularly not for people at the Radiation Protection and Nuclear Safety Authorities and for any other person involved and engaged in and worried about the consequences of the Chernobyl accident.
The existing and missing parts of the emergency system at that time
Already from 1960's there was a preparedness in the Nordic countries of nuclear bombtest fallout in terms of gamma- and air monitoring stations, routine measurements on environmental samples like milk, reindeer meat etc and action levels were defined for food consumption, evacuation etc. Because Finland and Sweden have nuclear power programs ( 4 operating power reactors in Fiilland and 12 in Sweden) they also have emergency preparedness plans particularly adjusted for domestic accidents. In Denmark and Norway there are research reactors in Riso and Halden-Kjeller
respectively and some emergency preparedness is justified for these reactors but the major sources of concem in these countries as a basis for their emergency preparedness plans were the reactors in their neighbour countries. In Iceland the preparedness was quite limited because of the long distance to any reactor. In conclusion, in April 1986 there was generally speaking quite a high level of preparedness for nuclear accidents in the Nordic countries but still, as it was shown, quite insufficient for accidents abroad with such extensive countrywide consequences as the Chemobyl accident proved to have.
The parts of the emergency system that worked well were the gamma monitoring stations at ground level, even if there was an uncomplete data transfer system, the airmonitoring at ground level, for instance that of the 7 stations of the National Defence Research Establishment (FOA) in Sweden, the air measurements made at high altitude from airplanes of the Airforce, the airborne gamma measurements at low altitude from airplanes ( e.g that of the Swedish Geological Company (SGAB)}, the ground deposition measurements made by experts of the Nordic radiation protection authorities, the university institutes, the nuclear power plants, the nuclear reactor research
institutes and others. There was also. an emergency preparedness in the level of knowledge in all related areas because of research in and experiences of the earlier fallout situations during the 60's and follow up studies in the 70's. Contact points were also preorganized and meetings between several domestic organisations and authorities with responsibilities in an emergency situation could
easily be mnnged. Good contacts also existed between the Nordic countries and several meetings were organized between responsible authorities in radiation protection, nuclear safety, food
contra~ agriculture etc.
But there were also lacking pmts in organization, experience, knowledge etc and because of that, rapid development and new decisions had to be made in many areas. In Sweden the SSI gamma stations worked well and gave ve1y good infonnation about the general geographical dist1ibution and levels of the deposition expressed in gamma doserates but the routines for ~mediate alarm to SSI were insufficient. Figure I shows the measured gamma levels on the island Oland which was one of the first Swedish areas reached by the radioactive plume (PE Kjelle, 1991). Ah·eady in the evening of27 April the activity reached Sweden, but SS.I was not notified and by that all
emergency activities were delayed more than 12 hours: In Finland there was a stdke among civil servants so there was nobody to look at the information given by the measurement network on the 27 April and the information reached the authorities not until the morning of the 28 Aptil.
Even if the mobile measurement equipments on land were working well after some delay they were too few and the reporting routines were not sufficiently trained. Many samples on vegetation and food were taken and had to be measured at the laboratories for Sr-90 and plutonium and the . limited capacities were quite evident in the beginning. There was a great lack of values on
inte1vention levels for various situations, and many decisions had to be taken in this respect. Tiw intervention levels from 1960's were more or less forgotten or not found to be applicable. However, the greatest surprise was expe1ienced in the area of iufonnation. The emergency plans contained organization and persollllel for information but it appeared to be much too small. In Sweden for instance, during the first days more than 1000 telephone calls were received per day and it was necessary to ask all available people from the whole of Sweden, that were reasonably competent in radiation protection and radiobiology in particular, to join the information center at SSI and answer questions. A number of publications such as brochures etc had to be produced and distributed. Tills was the situation also in other Nordic co1mtiies.
All these and other insufficiences have later ou been remedied.
The deposition in the Nordic countries
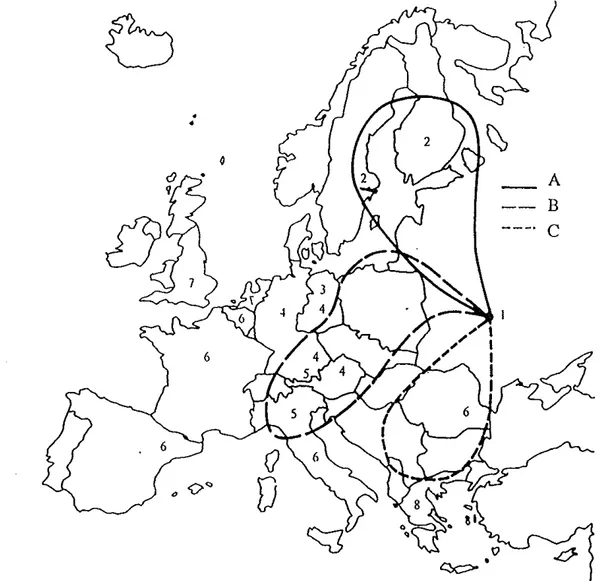
The Chemobyl accident releases stmted the night of April25-26 and continued for ten days. Airbome radioactive material reached the Nordic countries on April27 and the cloud was transp01ted northward during the following days. On May 2 the releases from the Chemobyl reactor increased again for about four days and also part of this release affected the Nordic countries. The releases and theif dispersions over Europe is discussed
ill
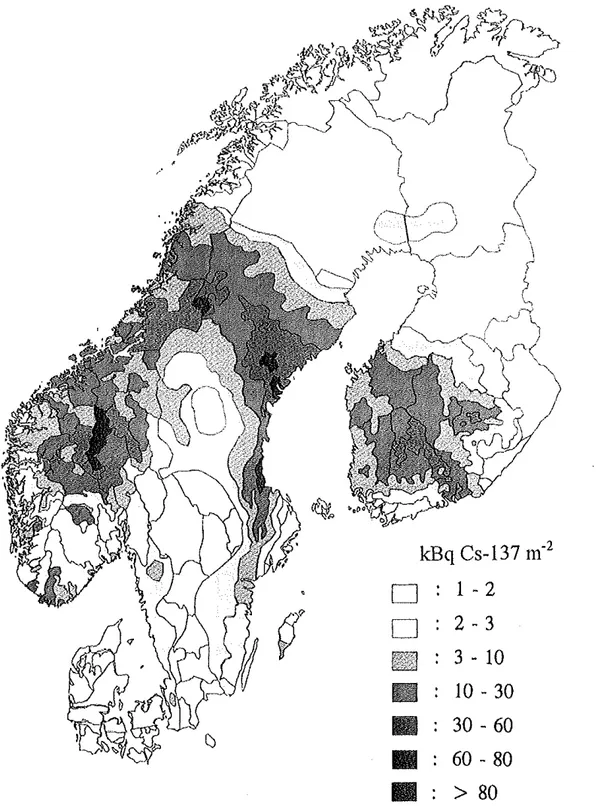
detail in the UNSCEAR 1988 report. The dispersions during the first week is shown in Fig 2 (STUK, 1991 ). Fig 3 shows the ground deposition in kBqm·2 ofCs-137 in Denmark, Finland, Norway and Sweden as the result of all releases from the Chemobyl accident. The ground deposition in Iceland and Greenland was very low (H Dahlgaard et a! 1994).The deposition pattem in the Nordic countdes is the result of the variation of amount and
composition of releases from the Chemobyl accident; the wind direction, the fractiouation effects during the atmospheric transport and the weather conditions, paiticularly the precipitation in affected areas (K Edvarson, 1991, H Arvela et al, 1990, M Suomela et a!, 1991).
5 0 0 , - - - r ' - - - , <00 1=-c~-=-'-
-!00 0.00 .c.oo 6,00 12.00 16,00 20,00 2<(,00 .c.oo 0.00 12.00 16.00 20.00 2.(,00 OA.TE!OG-0.(-27 DATE: 66-0.(_;26
Fig 1 48-hour gamma levels for station: Glands s:a udde. (PE Kjelle, 1991)
.
•
A
B
c
Fig 2 The distribution of air releases from the Chemobyl accident during the first week. Letters
A, B and C refer to the distribution in Europe of releases from Chemobyl April26, April 27-28 and April29-30. The numbers in the figure are the times of arrival at respective points counted as number of days after April26. So number 2 means arrival April27.
(STUK 1991) .
kBq Cs-137 m-
2D
1 - 2
~9
D
2 - 3
~
.3 - 10
IIIJ
10 - 30
11
30- 60
•
60- 80
1111
>
80
Fig 3 Ground deposition ofCs-137, kBq m2, in Denmark, Finland, N01way and Sweden
The total deposition over the Nordic countries was about 10 PBq Cs-137 and the major part was found in wet deposition areas. As about 80 PBq Cs-137 is assumed to have been released
(Gudiksen et al, 1989), (or about 60 PBq Cs-134 and about 90 PBq Cs-137 and 2000 PBq I-131 in later estimate conesponding to 20-40% of the total radiocesium and 50-60% of the radioiodine in the reactor core (information fi'iin IAEA Chemobyl conference 1996)), more than 10% was deposited over the Nordic countries with the average Cs-137 concentration of 1.2 kBqm-2 in Denmark (even distribution), 11 in Finland (SIIlface weighted), 5.1 in Norway (population
weighted) and 10
in
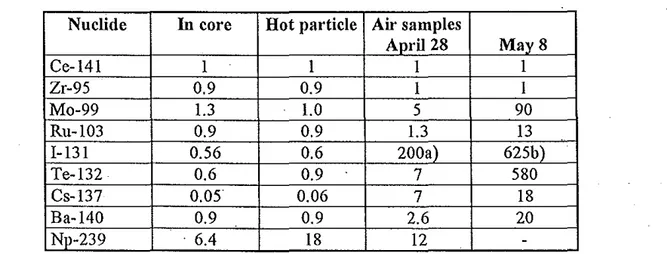
Sweden (surface weighted). As seen fi'om Fig 3 the distribution of the ground deposition of Cs-13 7 was very uneven mainly depending on the direction of the movement of the plume and the wasb-out deposition by rainfall. There was also great geographical variation of the nuclide ratios because of fractionation effects caused byi.
a va1ying meteorological conditions during the transport and because different source of release (the first and second major releases from Chemobyl) had different nuclide relative compositions and qualities (L Devell et al, 1986). This is illustrated in Table 1 (!fom L Devell, 1991 ).Table 1. Activity ratios relative to Ce-141.
Nuclide In core Hot particle Air samples
April28 May8 Ce-141 1 1 1 1 Zr-95 0.9 0.9 1 1 Mo-99 1.3 1.0 5 90 Ru-103 0.9 0.9 1.3 13 l-131 0.56 0.6 200a) 625b) Te-132 0.6 0.9 7 580 Cs-137 0.05 0.06 7 18 Ba-140 0.9 0.9 2.6 20 Np-239 . 6.4 18 12
-Figures corrected for decay to the time of the accident. a) Total iodine. Particulate 40.
b) total iodine. Particulate 250.
More than 20
ga~radiom~clides
were identified in the air during the initial period ami' maximum concentrations at ground level of any radionuclide was about 10 Bqm-3. Volatile fission productslikei-131, l-133; Cs-134 and Cs-137-were dominant but also less volatile radionuclides were presentlikeZr-95, Ce-141, Ce-144 andNp-239.
The deposition from the Chemobyl accident added to the present fallout from the atmospheric tests in early 60's. The two depositions were of the same order. of magnitude e.g in Sweden 4.25 PBq ofCs-137 from Chemobyl and 1.25 PBq from the atmospheric tests (De Geer et all978). However the fullout during the 60's was rather evenly distributed with an average of about 3 kBqm-2 while the Chemobyl deposition was extremely variable fi·om almost zero up to about 200 kBqm-2• The Chemobyl Cs-137 deposition was simultaneously followed by Cs-134
deposition, half-life two years, and the ratio Cs-137/Cs-134 was 1.7. Because all Cs-134 from the earlier fallout has decayed (initially also ve1y little as compared with Cs-137), the spatial
The measurements (in Sweden) on deposition were made by airborne or in situ
gamma-measurements. The results were assessed as average surface equivalent deposition density. The actual deposition detennined by gammaspectrometric measurements on soil samples was in
average 1.6 times higher than that based on in situ gamma-measurements (first year) (K Edvarson, 1991 ). This correction factor for penetration in soil increased continously to 2.4 in 1989 (L Moberg et al 1996). The correction factor for estimating equivalent dose rates from aerial measurements increased from l. 15 to l. 25 only.
The deposition ofl-131 was· also of interest from the radiation protection point of view. The integrated air concentration ofl-131 was even larger (about 25 times (UNSCEAR 1988)) than that of radiocesium However because of the relatively short half-life ofl-131 (8 days) there was only a problem the first weeks as regards contamination of grass-cow-milk. The deposition was 10-150 kBqm'2 and care had to be taken in allowing the cows to go outdoors. The deposition of Sr -90 and its dose consequences for people were minor as compared with Cs 134+ 137, al:JOut two order of magnitude less. The Sr/Cs ratio of the deposition also had great geographical variations. In Finland this ratio varied from 0.002 to 0.12 at different deposition sampling stations
(H Aaltonen et al, 1990).
Also the Pu/Cs ratio of the deposition had great geographical variations. The first emission starting 26 April had a higher Pu/Cs ratio than that of the second major emission started 2 May. The deposition in southern Sweden and Denmark was mainly caused by the second emission and had a ratio of only about 10-6 while the first emission affecting middle and north of Sweden and Norway and middle and south of Finland had a ratio of about 104• During the fallout in the 60's
this
ratio was about 10-2• The deposition ofPu 239+240 was in average less than 1% of earlier deposition from nuclear test fallout ( 40 Bqm-2) but at a few places reached up to the same order of magnitude (E Hohn, 1991 ).There were also some observations of so called hot particles in the air over the Nordic countries. They were quite rare and were not considered to imply any significant radiological risk even though the activity of some of them was of the order of 10 kBq mainly of the radionuclides
Ru-103 and Ru-106.
Dispersion in the environment. Radiological aspects.
Some time after. the accident the major interest was directed to Cs-137+ 134 because of their dominating amount and half life. The activity of the Cs-isotopes in various parts of the environment has continously changed by natural as well as man-made causes. The man-made causes are either specific countermeasures or normal uses of the environment. The natural causes are those which normally correspond to the radioecological behavior ofradionuclides in the environment including the human being. The two phenomena are often closely connected and sometimes completely integrated.
Air
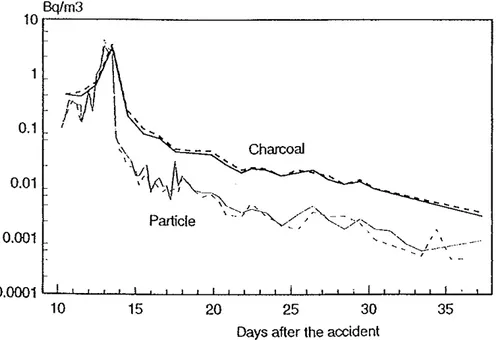
The concentration ofradionuclides in Nordic air·after the Chernobyl accident decreased irregularly after the accident depending on time, current emissions, wind and other weather conditions. Fig 4 shows the air concentration ofiodine-131 in the middle of Sweden (L Devell1991), Fig 5 the air concentration of cesinm-137 in Nurmijiirvi (in the southern half of Finland) (L Blomqvist et a!, 1987) and Fig 6 the
air
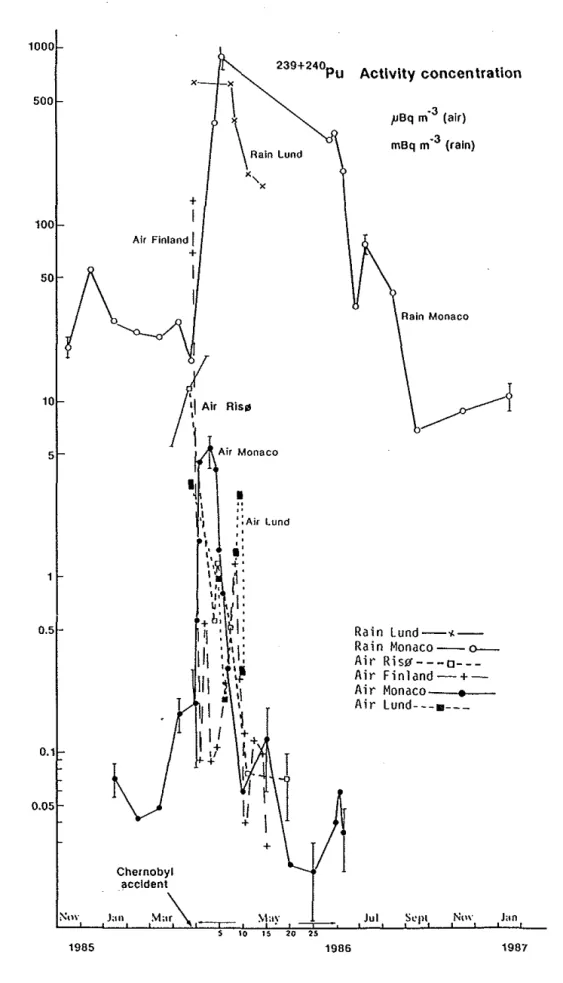
concentration ofPn 239+240 at some various places in Denmark, Finland,Bq/m3 10~---. 0.1 0.01 0.001 10 15 20 25 30 35
Days after the accident
Fig 4 Iodine-131 in air sampled
by
charcoal or particle filters. (L Devell, 1991)1000 500 100 10 5 0.5 0.1 0.05 1985 X + I Air Finland J + 239+240Pu
I
\Rain Lundx,
X l i rRis~
;r
Chernobyl accident·~
Jan Ma\
Air Monaco I " ,. ::Air Lund + s " 1986Activity cone en tratlon
pBq m·3 (air) mBq m ·J (rain) Rain Monaco Rain Lund-<-Ra in Monaco--O -Air Rislf---o---Air Finland-+-Air Monaco--.--Air Lund---•---Jul St'pl Ntw Jan 1987
Fig 6 The Pu-239, 240 activity concentration in air and rain at Risa (Denmark), southern Sweden (Lund), Finland
(Nurrnijarvi)
and southern Europe (Monaco) following the Chernobyl accident. (E Holm, 1991)Sweden and southern Europe (Monaco) (E Holm, 1991 ). The air concentration several weeks after the accident and thereafter is influenced by resuspension, which is higher in areas with d1y deposition than in those with wet and varies by season with a peak in spiing and a minimum in fall and winter ( J Vintersved et a!, 1991 ). The concentrations are very low, though.
Ground and transport to water
The radionuclide of major interest today is Cs- 137 even though there is some radioecological interest of other radionuclides like Sr-90. TI1e Cs-activity on ground has decreased by physical decay and by wash-out/run-off processes. The actual amoimt left on ground today can be approximately assessed from studies of gammaradiation from the ground and by studies of out-flow in Jivers into the Nmwegian Sea, the Atlantic, the Nmth Sea and the Baltic Sea including the core areas the Bothnian Sea and the Gulf of Finland.
Measurements of water fi·om Swedish and Fill11ish rivers to the Gulf ofBothnia in 1986, 1987 and 1989 gave an input of 181,81 and 24 TBq of Cs- 137 respectively, see Fig 7 (S Evans, 1991 ). Finnish Jiver data are found in references (R Sax en and H Aaltonen, 1987, R Saxen, 1990 and R . Saxen and U Koskelainen, 1992). This eau be compared with the fallout over GulfofBothnia, 1.9
PBq. The total inventary of Cs- 137 from the Chemobyl accident in the water colunm of the Baltic Sea was 5.2 PBq (H Dahlgaard et al, 1988). As concluded, the out-flow to the Baltic Sea waters decreased rapidly and the total out-flow from land during the first three years corresponds only to about 2% of the total Chemobyl fallout over Finland and Sweden as compared to 7% dinlinution caused by physical decay.
Some pa1t of the ground deposition that has actually migrated from soil into water has been
trapped in the sink oflakes, water reservoirs and Jivers mainly in their bottom sedinlent layers. The transport fi·om soil to the water ecosystem to lakes etc decreased quite fast the first years with an approxinlate half-life of 1.5- 3 years (B Snndblad et al, 1991). This can be compared with the estinlated half-life of0.5- 1 year the first three years after the accident of the amount transported . .
by Jivers to the sea. The rapid decrease in amount of transported mateiials may be a result of the effect ofihe sink oflakes. On the other hand studies made on lakes in Nmway, Sweden and Finland during several years, show ihat the output from a lake can be higher than input from the catchment area depending on leakage from the sediments of the lake. During 5 years of observa-tion the loss in one ofihe lakes was.30% of the initial deposiobserva-tion while ihe corresponding loss in the catchment area was only 1-8% (depending on the size of the area). TI1e general conclusion is, however, that much ofihe Cs- 137 deposited on ground still remains in the soils and the stream sediments in catchment areas oflakes (HE Bjomstad et a!, 1994). TI1is is also true for the lake sedimeuts. There ani also evidence of very low downward migration ofCs- 137 in soil since 1987 and more ihan 90% is normally found in the upper 5-10 cm of soil (B Sundblad et a!, 1991) with ihe major part in the upper 5
cm
(D H Onghton and B Salby, 1994).Therefore, the major part of the reduction of activity on ground should be caused by physical decay. This is suppmted by airbome gammameasurements. However, it cannot be unambiguously proved by the obse1vations of gammaradiation from grmmd made since 1986 (P E Kjelle, 1996).The Baltic Sea system
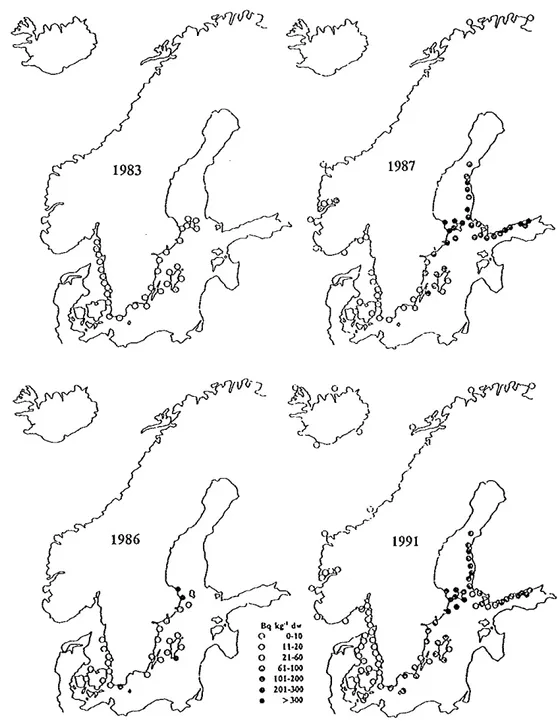
The change ofihe Cs activity ofihe Baltic Sea system by transport with water ctments has been studied by indirect meihods using the algae Fucus vesiculosus as a bioindicator (L Carlsson and P Snoeijs, 1994). The results are illustrated by Fig 8 (from ihat publication). That ihe decrease of
1999
Fig 7 Riverine inflow ofCs-137 to the GulfofBothnia 1986-1988. (S Evans, 1991)
~
J/
~
1987'
[
:
l~t~~
);
'
{
Fig 8 Activity concentrations of 137 Cs (Bq kg·• dw)
in
Fucus vesiculosusactivity along the Gulf of Finland since.1987 is larger than in the Gulf ofBothnia is assumed to depend on1arger water turnover in the Gulf of Finland than in the Gulf ofBothnia and on larger addition of Cs-13 7 to the latter from heavily contaminated drainage areas of the rivers in Finland entering the Gulf ofBothnia. The increased activity along the southem Swedish coast indicates an addition ofCs-137 caused hy Cs-137 in the out-flow from the Baltic Sea. As can be seen the activity along the Norwegian coast is low, mostly below 5 Bqkg-1 dry weight. Outside Iceland the activity is very low below 0. 5 Bqkg-1 dry weight mainly from other sources than the Chemobyl accident.
Lakes
The tuni.over ofradiocesium in the ecosystem oflakes is very complicated and variable (A
Broberg, 1994). The role of sedimentation is important for the bioavailability ofradiocesium in the lake ecosystem Generally speaking, most of the radiocesium entering the lakes was rapidly and strongly bound to particles and transferred to bottom by sedimentation.
However, many factors influenced the rate and way ofsedimentation 1986 and years thereafter. In-flow of materials to a lake and production of organic materials increased the sedimentation, lakes with large areas of shallow waters had an enhanced sedimentation process, redistribution and transportation ofradiocesium occurred to deeper parts of a lake etc. The deposited radiocesium on the pottom of a lake was covered by sediments oflower activity concentrations or mixed to a more homogeneous distribution, all factors influencing the bioavailability. The exchange of radiocesium between sediments and water varied also in different parts of a lake depending on varying local water 'flows. The total amount .of Cs-137 in most lakes has not changed significantly more than physical·decay since 1986, and the sediments contain from 80 to ahnost 100% of the
Cs-137 in lakes (M Meili, 1994).
Transfer to }tsh
The contamination of fish was predominantly caused by uptake of radiocesium in contaminated· food. The intake from water was negligable (T Andersson and M Meili, 1994 ). The tumover rate in a giv~n fish depends on fish size and temperature of the water. Both intake ·and excretion is higher in the summer than in the winter and the tumover in a fish may be higher in smaller fish than in larger because of faster metabolism
The maximum transfer to fish occurred normally in the increasing order small perch- trout and char- larger perch- pike. The times to reach the peak values ofCs-137 vary. In some studies, times about 1 year for perch and 1-2 years for pike were reported (B Sundblad,. 1991, R Saxen and U Koskelainen, 1992). Other studies and modelling work indicate that peak values occur later, for pike 5-10 years after the accident. The ecological half-life for.cesium in pike has been assessed to 10-15 years and about 2 years for perch (L Hakansson, 1991). However; the ecological half-life of Cs-137 in fish is not constant but increases with time (R Saxen, 1994). Seasonal variations of the content of Cs-13 7 in fish have been found with maximum in wintertime because oflow metabolism rate at lower temperatures. There are also great variations in relative uptake in fish between lakes (more than one.order of magnitude) that are not easily understood. The results reflect the complex relations between a number of influencing factors on the balance between input from drainage areas, sedimentation, resuspension, out-flow and the chemical and physical qualities of the lake water. and its content of various materials. ·
The fallout from the Chernobyl accident caused heavy contamination of thousands oflakes in the Nordic countries. In Sweden alone about 14000 lakes were contaminated so seriously that the fish had activity concentrations exceeding the level applied for fish not allowed to be sold at the open market (1500 Bq!kg ofCs-137). There are still several thousands lakes of that kind and
considering the large variations between lakes and fish species as reported above, the problems with lakes and fish are predicted to exist even into the 21st century (L Hakansson, 1991 ).
Transfer to agricultural products
The contamination of terrestrial vegetation in the first period after the fallout caused by the Chemobyl accident was primarly by direct contamination. 1bis was tme particularly in the southern part of the Nordic countries. In the northernmost part there was still some snow cover and the vegetation had not started. Gradually the contamination was caused by root uptake of activity deposited on ground.
There are great differences in the agricultural ecosystems in the Nordic countries. In the north there are grassland and mountains and animal husbandry is dominating while in the southern part, land is used for cultivation of grain, crops, sugar beet, legumes, potatoes together with animal husbandry. Because there was also a largely varying degree ofland contamination the·agiiculture contamination became complex and unpredictable.
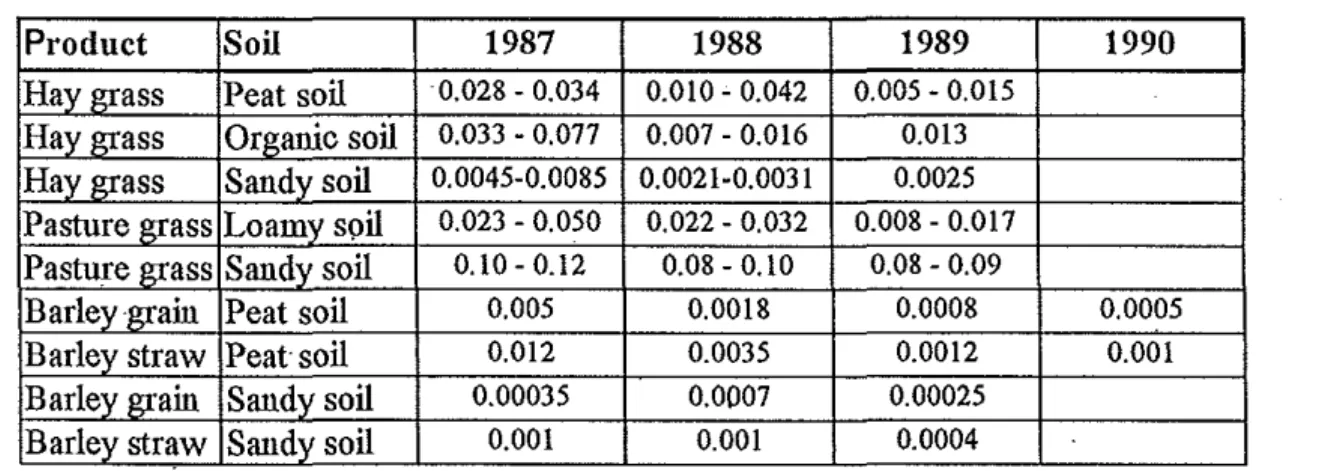
The transfer factor for agricultural products in terms ofBqkg·' per Bqm·2 (m2kg"1) depends on the qualities of soil, kind of product, soil preparation, the way of harvest, season etc. The change of transfer factors for grass and barley grown in different soils are shown in Table 2 (from data by K Rosen, 1991).
Table 2. Transfer factor (1)12kg"1) ofCs-137 from soil to vegetation.
Product Soil 1987 1988 1989 1990
Hay grass Peat soil 0.028- 0.034 0.010- 0.042 0.005- 0.015 Hay grass Organic soil 0.033 - 0.077 0.007- 0.016 0.013 Hay grass Sandy soil 0.0045-0.0085 0.0021-0.0031 0.0025 Pasture grass Loamy soil 0.023- 0.050 0.022- 0.032 0.008-0.017 Pasture grass Sandy soil 0.10-0.12 0.08- 0.10 0.08- 0.09
Barley grain Peat soil 0.005 0.0018 0.0008 0.0005
Barley straw Peat soil 0.012 0.0035 0.0012 0.001
Barley grain Sandy soil 0.00035 0.0007 0.00025
Barley straw Sandy soil 0.001 0.001 0.0004
As seen from the Table 2 the transfer is decreasing these years and variations occur depending on product and soil. The high value for uptake to pasture grass in sandy soil depends on the low clay and potassium content of the soil. As a rule of thumb an assumed transfer factor ofO.l m2kg"1 the first year and 0.01 m2kg·' following years does not seem to underestimate the uptake in grass in most cases. In barley it is lower. Table 3 is a summary of transfer factors (aggregated transfer factors) for vaiions crops in the Nordic countries (except Iceland) for the years 1986- 1990. The first value is for 1986 and the value within parentheses is the average value for 1987 - 1990 (fi·om data by M Strandberg, 1994).
Table 3. Transfer factor (m2kg-1) for 1986 and (within parentheses) average ofvalues for 1987-1990 in the Nordic countries in various crops.
All
crops are in fresh weight (except for barley in Sweden).All
values should be multiplied with10-
3.Country/Crop Barley Potatoe Cabbage Carrot Pea
Denmark 1.3 (0.60) 0.17 (0.092) 0.18 (0.050) 0.083 (0.052) 0.16 (0.012)
Finland 0.26 (0.0063) 0.19 (0.066) 0.17 (0.036) 0.10 (0.027) 0.15
Norway 0.81 0.56
Sweden 7.0(2.1) 2.0 (1.4) 1.3 0. 7 (0.88) 1
The relatively high values for Sweden seem to depend on the specific soil (peat soil and silt loam soil) but the conclusion is that the uptake offallout activity from Chemobyl accident to vegetation from soil decreases rapidly after the first year 1986 as the contamination changes from direct fallout to uptake fi·om soil through roots. The values dming 1987- 1990 lie within ±30% of the average with exception of the Swedish value for barley. In 1987 it is underestimated by a factor of 2 and for 1990 overestimated by the same factor (this is also true-for potatoes for 1988-1990). The estimated effective half-lives vary between the CO\mtries and the crops fi·om a few years to about 10 years. A general conclusion is that the uptake through roots is low in the Nordic agricultme ecosystem. Most of the transfer factors for edible patts of crops lie between 0. 00 1 and 0.01 m2kg-1 dming 1986 and between 0.0001 and 0.001 m2kg"1 1987-1990.
The transfer factor for Sr-90 in soil and vegetation was studied in N01way the years 1989-1992 (D H Oughton and B Salbu, 1994). No clear tendency of a decrease (or increase) can be seen and the transfer factors varied between 0.02 and 0.3 m2kg"1 (mostly "old" Sr-90).
Transfer to animals and animal products
Milk
Measurements were made on dairy
milk
or drymilk
and on milk from individual fanns in all Nordic countries. The mean Cs-137 activity in dairymilk
in 1986 and 1987 varied from 0.6 to 20 Bqr1 in the Nordic countries. The change of activity inmilk
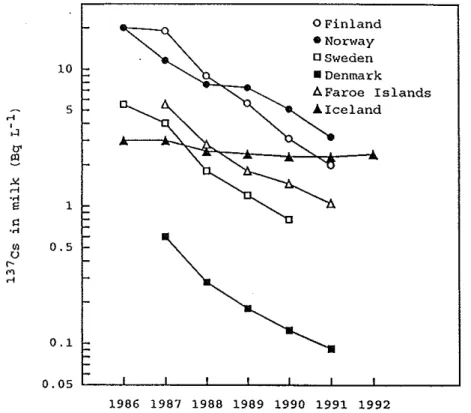
during 1986 to 1992 is shown in Fif 9 (from H S Hensen and J Andersson, 1994). The aggregated transfer factor (Bqr1 milk per Bqm· ground deposition) decreased for all countries as seen in Fig 10. The transfer ofCs-137 from vegetation to cows'milk
did not change significantly during 1986-1992 and ranged from 0.005 to 0.03 dr1 (Bqr1milk
per Bq ingested _daily by the cow) with a general mean of about 0.01 dri The effective ecological half-life for Cs-137 inmilk
was 1-2 years for all Nordic countries. Themaximum activity concentration in
milk
was reached 8-9 days after the cows had been taken out for grazing.Studies on I-131 in
milk
indicate about the same transfer factor (grass tomilk)
as for Cs-137 (E ·Wallstrom et al, 1991). The effective ecological half-life was 4-5 days and the maximum activity concentration was reached 3-5 days after "the cows had been taken out for grazing.
0 Finland • Norway osweden 10 • Denmark A Farce Islands 5 .A. Iceland .-< '
..,
0'"'
""
r i ·~ E 1 ~ ·~ 00 0.5 uc--"'
.-< 0.1 0. os L _ _ j _ _ . J . _ _ _J_ _ _L _ _J. _ _ j _ _ L_ _ _ _ _J 1986 1987 1988 1989 1990 1991 1992Fig 9 Mean Cs-137 activity concentration in cows' milk from dairies or dry-milk factories in the Nordic countries from 1986 to 1992. Values refer to Chemoby1 Cs-137, except in Iceland where global Cs-137 only was included.
(H S Hensen and J Andersson, 1994)
5.0
• Denmark
rZI Farce Islands Ea Finland 4.0 Ill! Iceland ~ Norway 8 Sweden .-<
'
..,
3.0"'
E.
"'
'
0,.,
•
2.0"'
..
"
1.0 0.0 1986 1987 1988 1989 1990 1991 1992Fig 10 Mean aggregated transfer coefficients (Tag) ofChemobyl Cs-137 to cows' milk in the Nordic countries (global Cs-137 in Iceland) from 1986 to 1992. Estinlations based om mean ground deposition, where needed corrected according to the area! distribution of milk production and mean Cs-137 content in dairy milk.
Sheep
The lamb production in the Nordic countries is most impmtant in Nmway and Iceland and least important in Denmark and Finland. The aunual per caput consumption of mutton in Denmark, Finland and Sweden is 0.6 kg and in Norway it is 9 times more and in Iceland 40 times more. Tire production occurs on mlCultivated pastures and on natural or semi-natural environments. 1l1e downward migration is normally very low which leads to a longlasting plant Cs-137 availability. However the absolute availability can vary depending on soil charactetistics. That is reflected in the transfer factor soil-grass in areas where Jambs are grazing. 11te average aggregated transfer factors (Bqki1 meat fresh weight per kBqm·2 soil) for the years 1990-1993 are for Denmark 0.6 ±100%, Finland 0.8 ±70%, Iceland 15 ±5%, Nmway 39 ±10% and Sweden 47 ±25% (one place only) (K Hove et al, 1994).
These values have been relatively constant over the years 1990-1993 except for Denmark and Finland where there has been a decrease, a factor 2-5. Herbage to lamb transfer factors (Bqkg-1
meat per Bqki1 grass) have been fairly equal between the countries with values between 0.25-0.70: The ecological half-life for Cs-137 in sheep has been estimated to be about 13 years in undisturbed areas
(P
Strand, 1994 ).Forest and alpine ecosystems
Forest and parts of alpine areas are impmtant as pasture for grazing animals, for hunting, for benies, mushrooms etc. and of course for wood production. Some of the nmthern pa1ts of the Nordic countries was covered by snow at the time of fallout from the Chemobyl accident and d1iring melting substantial translocations could occur Ji-om higher level areas to lower level areas. That led sometirues locally to a more inhomogenous ground contamination than given by the deposition distribution (RA Olsen, 1994).
The contamination occured as in other areas by direct contamination and by root uptake and after one year the dominating part in fresh plants was by root uptake. After 2-4 years after the fallout in 1986 more than 90% of the Cs-137 activity was more or less stabilized in the upper 4cm and only about 15% was bioavailable. The bioavailability was only little affected by time. The aggregated transfer factor decreased rapidly the first 3 years to a more stable condition and varied between 0.005 and O.lm2kg-1 dry weight. In more acid forests the transfer factor could be 10 times higher, 0.08-0.3 m2kg-1 and in Jimgus fruit bodies further 10 times higher, 3-11m2kg-1 • The last transfer · factor is correlated with the ability to accumalete stable cesium. In edible plants the transfer factors
are found to be 0.04-0.09 m2kg-1 for bilberry, 0.03-0.12 m2kg-1 for lingonberry and 0.13 m2kg-1 for cloudbeny (K J Joharisson, 1994 and K J Johansson et al, 1991). As the ground contamination in many areas was 50 kBqm·2 and more it is easily understood that forest benies and other edible plants can be heavily contaminated. This is particularly a problem with mushrooms (transfer factor around 1-10 m2kg-1 ).
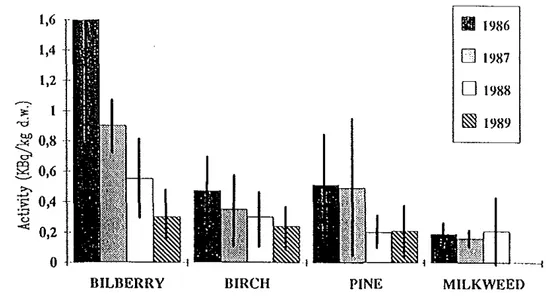
It is too early to determine the ecological half-life ofCs-137 in forest plants but it may be 5-10 years or more. Example of change of activity concentration with time in some forest plants are given in Fig 11 (from R Bergrnan et a!, 1991 ).
Contaminated plants also mean contamination of the animals in the forest. The most important aniruals as game meat in the Nordic countries are the moose, roe deer and hare. Birds like mallard, pheasant and grouse are also important as game meat in Denmark and Norway. The birds have usually quite a low transfer factor 0.01 m2kg-1 and lower (K J Johansson, 1994) and for hare it
"'
-d 1,6 1,4 1,2 ~0,8 ~ 0,6?
04 :.;::1 '"
< 0,2 0BILBERRY BIRCH PINE
lll!l
19860
19870
1988 §!§ 1989 I.1
,II!IUJ_~
MILKWEEDFig 11 The concentration of caesium 137 during 1986-1989 in "key"-plants based on pooled data from samples in July (bilberry twigs, birch twigs and milkweed) and October (bilberry twigs, birch twigs and pine).
(R
Bergman et al, 1991)0,04 Adult
1985 1986 1987 {Yearlf88 1989 1990
Fig 12 The quotient (m2 /kg) ofCs-137 concentration in moose muscle to ground
might be around 0.03 m2kg-1• For moose transfer factors between 0.0 l and 0.03 m2kg-1 have been found and 0.03 to 0.14 m2kg-1 for roe deer.
Considering the amount of meat consumed, moose and deer are most significant fi·orn the radiation dose point of view. As there are several hundred thousands of hunters in the Nordic countries (only in Sweden there are about 300.000) there is potentially a large critical group and therefore the activity ofCs-137 in moose and deer has been given high attention.
There are changes of activity concentration in these animals depending on the access to various plants with variable activity concentration. An important contributor is mushroom which normally has a high transfer factor. Fig 12 shows the variation of transfer factor for moose during
1985-1990 which reflects the variability of available Cs-137 in the forest plants. Still 10 years after the Chemobyl accident moose and deer constitute a problem in some parts of the Nordic countries. It is suggested until more is known that the effective ecological half-life would be the same as the physical half-life of Cs-137.
A plant of special interest in the alpine areas is the lichen. The ability of lichen to retain fallout . activity is well known from studies after the fallout Qfthe nuclear weapon tests in the SO's and
60's. Its large retaining ability is due to the large srnface area per unit mass, slow growth and long lifetime. The ecological half-life ofCs-137 is around 10 years. Most of the activity is in the upper 3 ern of the lichen carpet (P Roos, C Samuelsson, S Mattsson, 1991 ).
Reindeer accumulate fallout nuclides in their bodies by eating lichen, particu.larly·in the winter (1-4 kg per day). Because reindeer meat is an important pmt of the diet of the Laplanders it has a special radiological significance. In Sweden some 70.000 reindeer were located in the most
contaminated areas up to 80 kBqm-2 and more locally (0 Etiksson et a!, 1991). The contamination of reindeer was a great problem particularly in Norway and Sweden, and activity levels up to 150kBqlkg were found
(P
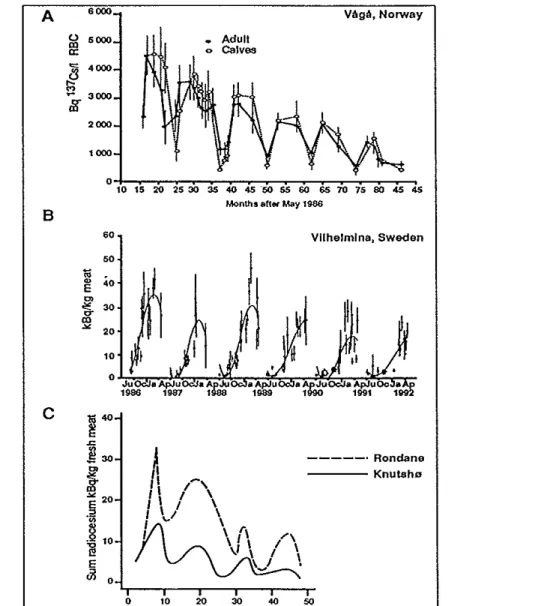
Strand, 1994). In Sweden 1988 more than a third of the slaughtered animals had activity concentration more than 1000 Bqkg-1 (SSI-88).The cesium intake shows large seasonal variations depending on the feeding habits of reindeer. The lichen constitute the major diet (70-80%). The seasonal variation of the Cs-137 intake by the diet of the reindeer has been predicted as is shown in Fig 13 (from E Gaare and H Staaland, 1994). That means that there are sinillar seasonal variations of the ceasium activity in meat with a maxi-mum in the early spring and a minimaxi-mum in the autumn, see Fig 14 with measurements up to 1992. The biological half-life ofcesium in reindeer is only 1-3 weeks (E Gaare and H Staaland, 1994) · and therefore the levels of meat activity follow the vatiations of activity intake with relatively sh01t
delay. With constant intake there is an equilibtium activity concentration in reindeer after 1-2 months. The ecological half-life of Cs-137 in reindeer in the first 5-8 years has been fmmd to be 3-4 years but it tends to increase (B and G Ahman 1994). In compatiso'n, the conesponding half-life for the nuclear weapon test fallout from the 60's is around .10 years.
The aggregated transfer factor is found to be 0.4-0.8 Bqkg-1 per Bqm-2 drning wintettime and somewhat lower in the summer (0.1-0.2). Assuming the contamination of ground was 50 kBqm-2 the expected levels would be 20-40 kBqkg-1• Cs-137 concentration in meat is sinillar to. or higher
than the activity concentration of the lichen the reindeer eat. Activity concentration up to 50 kBqkg-1 or more has been found wherefore meat concentrations of the same order of magnitude can be expected.
Radiocaesium in natural reindeer food A B 35 Vaar:1987 35 Yoaar:1989 ~ ~30 30 .E 25 25 ~ ~20 20 m ~ (; 15 15
!'!
10 10 5 5 0 J f " A U J J A S 0 N 0 FWAUJJA S 0 N D Month Monthc
D 35 Yoar:1993 35 Y•ar:2005§30
30 .E 25 m 25 ~20 m 20 ~ tJ15 15t!
10 10 5~
5 0 0 J F U A U J J A S 0 N D J f U A U J J A S O N D Monlh MonthFig
13
Predicted seasonal variations in Cs-137 concentrations in reindeer food. Further explanation in text. (E Gaare and H Staaland, 1994)A 0 Dl a:
g
{K 8c
6000 VttgA, Norway 5000 Adult ;, Calves 4000 3000 2000 1000 ·~----~~~~~~~~~~~~~ W1520~~35w~•~w~ronro~~Months after May 1986
60 Vilhelmlna, Sweden 50
I
10 4o ~ E"'
~30
Dl ~ 20 10"
,,
,-,
rl I \ I I I \\ I I I I "" \ r, I \ 1 I ..-, ,I \ / I \.../ \ - - - · Rondane - - - - Knutsho 0 10 20 30 4() 50 MQnth after Ma 1986Fig 14 A: Seasonal variation in red blood cell (RBC) Cs-137 activity in domestic reindeer from Vaga, Norway. In meat from reindeer B: slaughtered in Vilhelmina, Sweden and C: wild reindeer, Norway. (E Gaare and H Staaland, 1994)
Other Contaminations
Besides those patts of the ecosystem described above there were other patts of that system of minor imp01tance but that nevettheless influenced the exposure of man and the environment. Examples are other animals on grmmd than those mentioned, birds, fishes in the sea etc. Dtinking water was very little affected if taken from wells. During the first days, when the radionuclides were still in the air, large airfilters in industries etc could be so contaminated that some precaution was justified. Contamination of sludge in sewage treatment plants was another problem. This sludge is used as fettilizer in many farms and in May 1986 the activity concentration at some places was up to 100 kBqkg-1 (20% dry substance). This was in areas with a g:rom1d deposition of 50-70 kBqm-2• In spring 1987 the activity levels had decreased factor 100-1000 (SSI-88).
Contamination of agricultural soil could cause problems from resuspension of deposited cesium during ploughing etc. However, measurements during 1986 and 1987 did not indicate any significant problem. The air concentration ofCs: 137 was fom1d to be a few ~tBqm·3 (SSI-88).
Another example was the contamination of peat. Peat is used as fettilizer and for cumbustion for production ofhot water. In the first case there is a tisk of contamination of food and in the second case there may be problems with aiJ·boru activity and activity in the ash. Therefore intetvention levels were given (see below).
Resulting external and internal doses
External doses
The radiation dose during the first weeks was dominated by the dose caused by iithalation (in Sweden resulting in about 150 manSv, see SSI-88), the extemal dose from the cloud and the external radiation from radionuclides deposited on the ground. The radionuclide composition of the fallout from the Cheruobyl accident varied between different pa1ts of the Nordic countries depending on time of deposition and kind of deposition (dry 01· wet). In wet deposition the cesium isotopes were relatively more significant in terms of resulting extemal dose rate than other
radionuclides. Generally speaking the first days after 28 April the dominating radionuclides were 1-131, Te-132 and Ba-140. Zr-95 and Nb-95 also gave significant contribution to extemal dose rates the first days in some areas. However, after 1-2 months the dominating radionuclides in most areas were Cs-134 and Cs-137 (in that order from the point of view of dose rates). An exainple of how vatious radionuclides contributed to the effective dose rate as a function of time is shown in Fig 15. This is fi·om southem part of the wet deposition area in Sweden (K Edvarson, 1991).
The resulting extemal dose rate in air decreases in time due to physical decay and penetration of radionuclides into the ground. However after a few years the penetration has stabilized in a layer of3-5 cm depth. The effective dose rate is influenced by snow cover and shielding in houses. Tite population weighted shielding factor caused by snow is about 0.9 in the Nordic countries and the one caused by buildings taking account of an assumed 15 percent out-door occupancy is about 0.3 (R Finek, 1991 ).
The estimated effective dose caused by extemal radiation during the first year after the accident was in most patts of the Nordic c01mtries below 0.5 mSv. In some areas it was up to about ten times that for a few hundred people. The first year average effective dose and the collective doses for the first year and 50 years are shown in Table 4.
tO'
________
.,,
-110m u-106
0 tOO 150 200 250 300
Days after 28 Aprtt 1986. 350 400
Fig 15 Effective dose equivalent rate
in
microsievert per hour (Uppsala county). (K Edvarson, 1991)IOOO
800
Jt.N FE5 HAll APR SEP OCT NOV OEC
Table 4. First year effective dose and collective doses in the Nordic cmmtries caused by external radiation.
Country First year mean Collective dose Collective dose
effective dose, mSv 1st year, manSv 50 years, manSv
Demnark ro.04lll J200]1l 700 6l
Finland 0.152) 7501) 55007
)
Norwav 0.083) 3001) 50001)
Sweden 0.084) 6005) 50005)
1) Approximate assessment from data in references below 2) STUK 1991.
3) T Strand, P Strand and J Baarli, 1987. 4) SSI-88.
5) K Edvarson, 1991. 6) Ris0 1986-1992. 7) M Suomela et al1996
The decrease of external dose rate in air since 1987-88 is at least according to physical decay of Cs-134 and Cs-137. Since the two isotopes contributed quite similarly to the effective dose in the first years, the external dose rate is expected to have decreased about a factor 3 up to 1996. Fig 16 shows the annual change from 1985 to 1988 of the external dose rate in one of the heavily
contaminated areas in the northern part of Sweden (P E Kjelle, 1991 ).
Internal doses
The internal doses are mainly caused by ingestion ofCs-134 + Cs-137 with food. The levels of internal contamination depends on diet; composition, place of food production, countermeasures to reduce the activity concentration and time after 1986. The countermeasures and their effects are discussed below.
Differences between the Nordic countries in soil qualities, agriculture methods, diet composition etc are reflected in different in!ake with food per unit deposition and can be expressed as different radioecological sensitivities for the Chemobyl derived radiocesium contamination of the ground. The radio ecological sensitivity for Cs-137 in diet is defined as the infinite time-integrated concentration of cesium in diet per unit deposition (A Aarkrog, 1979).
Table 5 shows some estimated values of the radioecological sensitivity after Chernobyl. It is to be observed that for another fallout situation the values may be different (H Dahlgaard et al, 1994). Table 5. Radioecological sensitivities in total diet for Chernobyl Cs-137 in the Nordic
countries. Country Sensitivity BQakg-1/kBQm-2 Demnark 4,4 Finland 13 Iceland
-Norway 33 Sweden 20The range given in Table 5 is somewhat higher than that given by UNSCEAR 1988, I to 9 Bqakg-1 per kBqm-2 with a geometric mean of2.6 Bqakg-1 per kBqm-2 ofCs-137.
The resulting dose caused by intake of radionuclides with food is the end result of a combination of independent influencing factors like activity concentration in food, dietary composition, age and sex. Intenelated factors are biological half-life, chemical composition and physical qualities. The transfer factor fi'om total diet to body burden is defined as the quotient of time integrated concentration and dietmy concentration. The value is estimated by multiplying total food
consumption kga-1 by 143 Bqd per Bq (mean residence time in body) and divide with 365 da-1 and 70 kg (body weight). The value for the Nordic countries is about 3.0 Bqakg-1 (body) per Bqakg-1 (diet) (UNSCEAR 1988).
An intake ofl Bq Cs-137 conesponds to 5.6 x 10⁻³ Bqakg-1 in the body (1 Bq x 143d/360 da-1 x 70kg). The effective dose caused by time integrated concentration in the body is for Cs-13 7 equal to 2.5 J.!SV per Bqakg-1. Therefore an intake of !Bq Cs-137leads to 13 nSv (adults). The COITesponding value for Cs-134 is 19 nSv. That means that an effective dose of I mSv
conesponds to an intake of75000 Bq Cs-137 or 50000 Bq Cs-134.
Using the UNSCEAR values for the transfer factor for deposition to diet 2.6 Bqakg-1 for Cs-137 and the other transfer factors given· above the total transfer factor cap be calculated. The total transfer factors in units of J.!SV per kBqm·2 are given in Table 6 (from UNSCEAR 88) for the northern countries. The contribution from external radiation is also included.
Table 6. Total transfer factor for effective dose based on Cs-137 deposition, J.!SV per kBqm-2.
Pathway/ J.iSv per kBqm·2 (Cs-137)
radionuclides First year Total
External galllllla Cs-137 2,2 73 Cs-134 2,5 7 Other 5,6 6 Subtotal 10 86 In_gestion Cs-137 15 35 Cs-134 11 23 1-131 I I Subtotal 27 59 Total (rounded) 40 150
These are the general principles and values for calculating doses from data on ground deposition and dietary intakes. Another method is to measure the whole body content of cesium in people and make the assessments from that. The two results are not often identical which illustrates the differences between intemational average values and the actual regional and local values of those parameters that are significant for the resulting dose (see below).
In the Nordic countties there are groups of people and food that are of special interest fl'om the radiation protection point of view. These are hunters and fishermen, reindeer keeper, beny pickers and other people eating much wild produced food. Special food are reindeer meat, mutton, moose and deer meat, freshwater fish, mushl'Ooms. Other food like
milk
(with the exception of goatmilk), milkproducts, pork and beet; grain products, vegetables, potatoes and fiuit have not been aproblem in the Nordic countties after the Chemobyl accident. The mother's
milk
has not been a problem either, 1-5 Bql-1 was measured in Sweden in most contaminated areas and exceptionally up to I 0 Bql-1 when the mother had eaten contaminated fish or reindeer (SSI-88). It has been estimated that mother'smilk
concentration of cesium is about 15% of the concentration in the woman's body.An example of a Laplander family diet of special interest is given in Table 7 (W Becker). Table 7. Consumption of some food by Laplander families.
Food Kg per person
and year
Reindeer meat 50-150
Moose meat 5-15
Fresh water fish 10-40
Ben'ies 10-20
Because these food products in most contaminated areas might have activity concentrations much above 1000 Bqkg-1 the corresponding doses would be up to I 0 mSva-1 or more.
If
the Cs-137 activity concentration is 1500 Bqkg-1 (the limit in Sweden for this kind of food) and theconsumption is 200 kg of this food per year, the resulting effective dose caused only by Cs- 13 7 would be 4 mSva-1, disregarding the leak-out effect of cooking.
These are the extremes. Because there are limits for activity concentration in food to be sold and because of additional precautions of farmers and food production industties the actual activity levels were and are much below the limits. A reliable way to assess the average intake by food is to measure on "food baskets" which are baskets with annual average composition of daily food consumption
in
various parts of a country. More thau hundred kinds offood compose the basket and is measured and the daily average intake is calculated. In 1986 the average intake in Sweden was estimated to be about 1900 Bq ofCs-137 (7 months), in 1987 3000 Bq (SSI-88) and in 1994 274 Bq per year. For 1994 the intake corresponds to an effective dose of3.6 11Sv (H More et al, 1995). In most contaminated parts of Sweden the average annual intake in 1994 was 815 Bq of Cs-137 and the corresponding dose about I 0 11Sv.How well do these results agree with results that are assessed otherwise? Questions relate to the effective half-life of cesium in the body, the diet composition, the ecological half-life, the total transfer factor and others.
i) The effective half-life:
A dose conversion factor of 1.3 x 10·8 SvBq-1 ofCs-137 has been used (ICRP 89) in the
calculation of the dose (3.6 11Sv). ICRP uses a half-life of 104 days but whole body measurements give a shorter time, 81 days (R Falk et a!, 1991 ). Similar values have been reported also in Finland
(E Hiisanen and T Rahola, 1971, M Suomela, 1968). That means that the dose might be overesti-mated by about 20%. On the other hand, an intake of274 Bq per year (Sweden) corresponds to a
body bmden at equilibrium of 1.3 Bqkg-1 using a half-life of 81 days. Whole body measurements 1994 gave a body burden of2.0 Bqkg-1 which means that
1.3
Bqkg-1 might be an underestimation of body bmden of about 50%.ii)
The diet composition:
It might be that the foodbasket composition does not correctly reflect the tme food composition after all. Wild produce food (moose, roe deer, reindeer, fresh water fish, mushroom, benies) fi·om contaminated areas might play a greater role in average consumption then assumed. It is proposed that as much as 30, 70 and 80% of total intake of Cs-137 might come from wild produce food in Norway, Finland and Sweden respectively (H Dahlgaard et a!, 1994). These discrepancies are still
to be examined. ·
iii) Ecological half-life:
There are many different values given in literature on ecological half-life. They vary between different soil, plants and location from a few years to 10-30 years, which influence the calculated individual and collective dosecommitment.
In conclusion; there are so many uncertainties in the assumptions necessa1y for calculation of resulting doses caused by intake of radiocesium that the most reliable way is to use whole body measurements and reasonable dose conversion factors (Sv per Bqkg'1 body burden). Fig 17 is a summary of doseestinlates for the years 1986-1990 based on whole body measurements
(M Suomela and T Rahola, 1994, reassessed 1996). Results of whole body measurements in Sweden are given in Fig 18 (L Moberg et a! 1996).
The corresponding collective effective doses over 50 years would be about 150 manSv for Deill'Jlark, 3500 for Finland, 1500-2500 for Norway and 1100 manSv for Sweden making about 7000 manSv in total. UNSCEAR 1988 has estimated the total collective effective dose caused by internal radiation to be about 10000 manSv which probably is an overestimation.
Countermeasures
The fallout from tl!e Chernobyl accident affected the Nordic countries very differently. Some parts were affected only marginally others quite heavily and in combination with specific environmental conditions and living habits resulted in significant contamination of vegetation, aninlals and man. One example is tl!e ecological chai,n lichen-reindeer-man, which in Sweden and Norway could lead to dose commitments caused by Cs-137 in the diet of the order of a hundred mSv unless precautiona1y actions were taken.
There were several reasons to effectuate countermeasures to avoid high individual doses
(Laplanders, fish consumers, hunters etc), to avoid doses to large population groups, if that was justified, and to avoid.unnecessary doses, if that was easily done and if they caused societaiJ psychological concern. It was early concluded that measures like evacuation, sheltering and intake of stable iodine were not justified. But other measures were taken e.g giving information and advice to general public and specific groups (fanners etc), making measurements in tl!e environ-ment, on food and on man, issuing regulations, restrictions and advice and improving tl!e emergency preparedness system
,E_FF_E_C_T_IV_E_D_O_S_E_(~m_S~0~---~======~
0,15 I 0,1 0,05 0 1986 1987 1988YEAR
1989Ill DENMARK
llllllFINLAND
GINORWAY
GISWEDEN
1990Fig 17 Effective internal doses from Cs-134 and Cs-137 delivered to the Danish, Finnish and Swedish populations and to the Sel group (Norway)
in
1986-1990.(M Suomela and
T
Rahola, 1994, reassessed 1996)-4-Laplander -£- Giivle, non fanners+ SSI. Stockholm
0 Mean value SwcdenO- G3vle fanners
Cs-137 ( Bq/kg)
1000
500
100
>f~'
<·1
. !/z=4.7 year50
10
5
I0.5
1950
1960
19701980
1990
2000 YearFig 18 Measured body burden ofCs-137 (Bq!kg body weight)
in
a number of groups in Swedenbetween 1959 and 1995. During the period 1965 to 1975, the yearly intake ofCs-137 decreased with half a time of 3 - 5 years. The squares show the measured average body burden of the whole population. (L Moberg et al, 1996)