V T 1 särtryck
Nr 221 - 1994
Changes in Driver Behaviour as a Function of Handsfree Mobile Phones - A Simulator Study
Håkan Alm and Lena Nilsson
Reprint from Accident Analysis and Prevention, Vol. 26,
-No. 4, pp. 441-451, 1994
Väg- och transport-forskningsinstitutet
VTI särtryck
Nr 221 0 1994
Changes in Driver Behaviour as a Function
of Handsfree Mobile Phones
A Simulator
Study
Håkan Alm and Lena Nilsson
Reprint from Accident Analysis and Prevention, Vol. 26,
No. 4, pp. 441-451, 1994
(db
Väg- och
transport-farskningsinstitutet
'
Pergamon Accid. Anal. and Prev., Vol. 26, No. 4, pp. 441 451, 1994Copyright © 1994 Elsevier Science Ltd
Printed in the USA. All rights reserved
0001 4575/94 $6.00 + .00
0001-4575(93)E0003-P
CHANGES IN DRIVER BEHAVIOUR AS A
FUNCTION OF HANDSFREE MOBILE PHONES
A SIMULATOR STUDY
HÅKAN ALM and LENA NILSSON
Swedish Road and Transport Research Institute, S-581 95 Linköping, Sweden
(Accepted 21 September 1993)
Abstract The effects of a mobile telephone task on drivers reaction time, lane position, speed level,
and workload were studied in two driving conditions (an easy or rather straight versus a hard or very curvy route). It was predicted that the mobile telephone task would have a negative effect on drivers
reaction time, lane position, and workload and lead to a reduction of speed. It was also predicted that
the effects would be stronger for the hard driving task. The study was conducted in the VTI driving simulator. A total of 40 subjects, experienced drivers aged 23 to 61, were randomly assigned to four experimental conditions (telephone and easy or hard driving task versus control and easy or hard driving
task). Contrary to the predictions, the strongest effects were found when the subjects were exposed to
the easy driving task. In the condition where drivers had to perform the easy driving task, ndings showed that a mobile telephone task had a negative effect on reaction time and led to a reduction of
the speed level. In the condition where drivers had to perform the hard driving task, ndings showed
that a mobile telephone task had an effect only on the drivers lateral position. Finally, the mobile
telephone task led to an increased workload for both the easy and the hard driving task. The results
are discussed in terms of which subtask, car driving or telephone task, the subjects gave the highest
priority. Some implications for information systems in future cars are discussed.
INTRODUCTION
The number of mobile telephone users is steadily increasing in many European countries. This in-crease has made researchers and authorities worry about the effects of mobile telephone use on traf c safety. Some studies have addressed this question. Brown, Simmonds, and Tickner (1969) investigated the effects of divided attention resulting from the use of mobile telephones during driving. Their subjects drove on a test track and were given the task of judging whether to drive through gaps of different sizes, some smaller than the size of the car. Concur-rently, the subjects were performing a telephoning task. The conclusions from the Brown et al. study were that overlearned tasks of car driving (i.e. steer-ing skills) were not affected by the use of a mobile telephone during driving. On the other hand, some perceptual and decision-making tasks (i.e. judging whether a gap was wide enough to pass through) were negatively affected. Brown et al. also found a reduction in speed as a function of the divided attention. Zwahlen, Adams, and Schwartz (1988)
441
investigated lateral path deviations when drivers were dialling a long-distance telephone number and
driving on a test track. They found that 2% 12% of
the drivers made lateral deviations of a dangerous nature (intrusion into the opposite driving lane). In a simulator study, Stein, Parseghian, and Allen (1987) also found that the drivers lane position was nega-tively affected when a telephone call was initiated manually. This effect was especially pronounced when the telephone was mounted on the console and not so severe when it was mounted on the dash- ' board. The effect was also more pronounced for old than for young drivers.
The purpose of the present study was to con-tinue the line of research initiated in the above-men-tioned studies, and to introduce some variables of interest. One variable of interest is driving-task com-plexity. On theoretical grounds it seems reasonable to assume that a mobile-telephone conversation can have different effects on driver behaviour, de-pending upon the complexity of the driving task. A common assumption seems to be that a mobile-telephone conversation can be performed without
risk when the driving task is easy, and it has even been suggested that it can increase safety by alerting the driver. To measure the effects of mobile tele-phone use, earlier studies have concentrated on ob-jective behavioural measures. In this study we also included a subjective measure of mental workload. The reason for doing this was that it is generally assumed that extreme levels of mental workload can increase the risk of an accident. Therefore, it is of interest to investigate whether a mobile-telephone conversation will lead to an increased workload, or if drivers compensate for the increased workload by, for instance, slowing down.
More speci cally, the purpose of the study was to address the following questions. First, is there an effect of mobile-telephone conversation on drivers ability to detect quickly an object or event in a traf c environment? Second, is there an effect of a mobile-telephone conversation on drivers ability to monitor and adjust the lateral position of the vehicle? Third, is there an effect of a mobile telephone conversation on drivers workload and speed level? Fourth, is there an effect ofthe dif culty ofthe driving task on drivers ability to carry on a telephone conversation? Reac-tion time, handling of the vehicle, and speed all have some connection with traf c safety. The performance in a telephone conversation gives an indication ofhow drivers distribute their resources on the driving and the mobile-telephone tasks. It was decided to study the effects of incoming telephone calls, where the driver uses a mobile telephone with a handsfree func-tion. When answering a call a driver had to activate the handsfree function, and thereafter divide atten-tional resources between the driving and the tele-phone task. The following predictions were made: First, it was predicted that the distraction caused by the activation of the handsfree function and the con-tent of the telephone task would negatively affect a driver s ability to detect quickly an object in the traf c environment. These effects were predicted to be stronger when the demands of the driving task in-creased. Second, it was predicted that this visual and cognitive distraction would also have a negative ef-fect upon the driver s ability to control the lateral po-sition of the vehicle. The effect was predicted to be stronger when the tracking demands of the driving task increased. Third, it was predicted that the driv-er s workload would increase as a result ofthe mobile-telephone task, and that the addition in workload would increase in proportion to the demands of the driving task. The increase in workload was predicted to lead to a reduction of speed. Fourth, it was pre-dicted that the increased demands of the driving task would have a negative impact on the subjects ability to perform a telephone task successfully.
METHOD
Subjects
Forty subjects, 20 men and 20 women, aged 23 to 61 (mean age 32.4, std. 9.5 years) participated in the study. They all had a driving license, and were experienced drivers, i.e. they had had their driving licences for at least ve years, and were driving at least 10,000 km per year. The subjects were re cruited via advertisements at various public places. They were paid 250 SEK for their participation in the experiment. The subjects were randomly assigned to four experimental conditions. After the completion of the experiment it was checked whether the ran-dom assignment of subjects to the different condi-tions had produced four equal groups in the critical variables age: distance driven and number of years as a holder of a driver s licence. A one-way ANOVA was performed on each variable and did not show any signi cant difference between groups. Thus it can be concluded that the four groups were not dif-ferent in any of these variables.
Design
Two factors were varied in the experiment: the curvature of the driving task (rather straight versus very curvy), and whether the subjects were exposed to a number of telephone calls (experimental group) or not (control group). The design of the experiment was a completely randomized two-by-two factorial design.
Apparatus
The VTI driving simulator was used for the study. It is an advanced simulator that consists of a moving base system, a wide-angle visual system, a vibration-generating system, a sound system, and a temperature-regulating system (Nordmark, Jans-son, Lidstrom, Palmkvist 1986; NilsJans-son, 1989). These ve subsystems can be controlled to operate in a way that gives the driver an impression that is very close to real driving.
Driving tasks
The road type that was presented to the subjects in the simulator was a two-lane, seven metre wide asphalt road. It contained both horizontal and verti-cal curves. The road surface was characterized by high friction corresponding to the friction of dry summer roads, and the visibility condition was simi-lar to that of a cloudy summer day. Three different routes, one practice route, and two test routes were used in the experiment. All three routes had the same general characteristics as described above, but differed in length and in the number and radius of
Driver behaviour as a function of handsfree mobile phones 443
the curves. The practice route was 20 km long, rather straight, and easy to drive. The two test routes were
both 80 km long. The easy route was rather straight
and was not expected to cause the subjects any prob-lems with the choice of speed and steering strategy.
The workload imposed upon the driver was thus
supposed to be very low. The hard route was very curvy, which forced the subjects to check the road layout more or less continuously and make decisions about a suitable speed level and steering strategy. The workload imposed upon the driver was assumed to be higher than for the easy route.
Vehicle
The car body used in the experiment was an ordinary Volvo 740 with an automatic gearbox. The simulated physical environment in the car corre sponded to that in modern passenger cars. Thus, the noise level, the infra sound level, and the vibra tion level were all within the respective intervals for modern passenger cars when driving in real traffic. The thermal environment was according to normal indoor climate.
Visual stimulus
A red square measuring 4 X 4 cm was used as a visual stimulus. It always appeared in the same position on the left shoulder of the road at a rather long distance in front of the car .
Mobile telephone
The mobile telephone used was an Ericsson Hot Line device with a handsfree facility. It was mounted at the height of the steering wheel, over the ventila tion controls, on the instrument panel to the right of the steering wheel. The telephone communication was simulated with the help of a microcontroller and two tape recorders with remote controls. Via the serial channel of the telephone system, the micro-controller activated the telephone, generated the ring signal, and detected when a button was pressed on the telephone. The microcontroller communi-cated with the main simulator computer, which con-trolled where, along the routes, the telephone calls occurred. When a subject answered the telephone by pressing a button, one of the tape recorders was activated and read the telephone task to the sub-jects. Tasks for eight telephone calls were prere-corded on one of the tape-recorder channels. The presented telephone tasks, together with the sub-jects answers, were recorded on the second tape
recorder.
Telephone task
The Working Memory Span Test (Baddeley, Logie, Nimmo Smith, and Brerefon 1985) was cho-sen for the telephone task. This test contains a work-ing memory part and a decision part. The subjects in the experimental groups were exposed to a
num-ber of sentences. Each sentence had the form X
does Y and contained three to ve words. After
each sentence the subject was supposed to answer yes , if the sentence was seen as sensible, and
no , if it was perceived as nonsense. The test
contained 50% sensible and 50% nonsense senten ces. When ve sentences had been presented, the subjects were required to recall the last word in each
sentence, in the order they had been presented. This
completed the task of each telephone call. During the experiment the subjects in the experimental groups received eight telephone calls, with different senten ces each time. The Working Memory Span Test was chosen because it is possible to repeat the test sev-eral times without strong learning effects, keep the presentation time constant for each call, and evalu-ate the subjects performance.
Presentation of the telephone task
The Working Memory Span Test sentences were prerecorded on tape. Each call started with an instruction, followed by the presentation of ve sentences. Each presentation took roughly 60 seconds.
Position of telephone call and visual stimulus along the route
Eight telephone calls were presented to the sub jects in the experimental groups during the
experi-ment. Therefore, eight speci c positions (distances between 0 and 80,000 m) along each of the two test routes were randomly selected. When the car passed these xed points a telephone call was initi-ated. At four of these eight positions, also randomly chosen, the visual stimulus, a red square, appeared in connection with the telephone calls. For two of these four occasions, again randomly chosen, the visual stimulus appeared shortly after the telephone had rung, while for the remaining two occasions the visual stimulus appeared later, when the driver concentrated on solving the telephone task. The ran-dom procedure was used to make it impossible for the subjects to anticipate correctly when the tele phone should ring, if the visual stimulus should ap pear in connection with the telephone call and, in case it did, to make out the temporal relationship. Driving performance measures
Speed, lateral position, and reaction time were used as performance measures. All measurements
and stimulations were controlled by the main com-puter controlling the simulator. Speed (km/h) was sampled at a rate of two Hz. Lateral position (m) on the road was measured in relation to a zero position, de ned as the position where the central line of the road coincides with the central line through the driv-er s body. The latdriv-eral position was also sampled at a rate of two Hz. Brake reaction time(s) was calculated as the time elapsing from the appearance of the red square until the brake pedal was depressed 10 mm or more. The resolution was 20 ms. If no driver reaction (suf ciently hard braking) has been detected within ve seconds, the stimulus was re-garded as unanswered and put out.
Subjective measures
In order to measure the subjects workload the NASA-TLX rating scale (Hart and Staveland, 1988)
was used.
Communication measures
The number of correct sentence judgements (sensible/nonsense) was used as a measure of the decision part of the telephone task. For the working memory part of the telephone task, the number of correctly recalled last words in the order they were presented was used as a measure.
Procedure
The subjects had to ll in a questionnaire about background variables (sex, age, driver licence, an-nual distance driven, experience of car driving and mobile telephone). Each subject was then randomly assigned to one of the four experimental conditions and given a written instruction describing the experi-mental task. The subjects in the experiexperi-mental groups were told that they were supposed to drive an 80 km-long route in the simulator. They were asked to drive the simulator in the way they normally drive a car and avoid playing with it. They were told to brake with the right foot. They were also told that when they were driving, two things would happen. The mobile telephone would ring, and a visual stimu-lus (a red square) would appear on the screen. When the telephone rang, the subjects were instructed to answer by pushing the button for the hands-free function. After doing so they were to listen to the instruction that followed and solve the task pre-sented over the telephone. When the visual stimuli appeared they were told to brake as fast as possible. After reading and asking questions about the instruc tions, the subjects in the experimental groups had some training in the telephone task. They practised three tasks of varying dif culty. The subjects in the control group were exposed to identical instruction,
but without the part containing the telephone task. In the next training phase, all subjects were intro duced to the driving simulator. For the experimental groups the handling aspects of the mobile telephone were repeated, and they could practice to locate and push the button for the handsfree function. Thereaf-ter, all subjects drove a 20 km-long practice route. For all subjects the visual stimulus appeared three times, and the subjects could practice braking as fast as possible. For the subjects in the experimental groups the mobile telephone also rang three times, and the subjects could solve the same problems as they did before, but now via the telephone and while driving. When the training phase was over, all sub jects had a short break and were offered coffee, tea,
or juice. After the break, the test phase began. After completing the 80 km-long test route each subject had to complete the NASA TLX. Finally the sub-jects were thanked for their participation in the study and paid 250 SEK. The running of one subject took 2 2.5 hours in total.
RESULTS
The following results will be presented. The subjects reaction time to the detection of the visual stimulus, the subjects lateral position in connection with the telephone call, the subjects workload and speed, followed by the effects of driving task com-plexity on subjects performance in the telephone task. Data from all 40 subjects were used in the analysis.
Reaction time
It was predicted that the subjects in the experi-mental conditions would react more slowly com-pared to the subjects in the control conditions. A two-way ANOVA showed a signi cant interaction between route and RTI system, F(1,36) = 6.40, p =
.0124. Figure 1 shows the nature of this interaction. Figure 1 indicates that there is a difference in the predicted direction for the easy route. A mobile telephone task seems to have affected the subjects reaction time towards longer ones. The difference in reaction time between the two groups in the easy driving task is also rather big (0.385 seconds). For the hard route the situation is different. No signi -cant effect of the mobile telephone task on the sub-jects reaction time could be shown. Thus, the hy-pothesis is supported for the easy, but not for the hard route.
Lateral position
To check the hypothesis about a negative effect
upon the drivers ability to control the lateral posi-tion of the vehicle due to the mobile telephone tasks,
Driver behaviour as a function of handsfree mobile phones 445
+ Phone condition + Control condition
Easy Hard
Driving task
Fig. 1. Reaction time as a function of driving task and experimental condition.
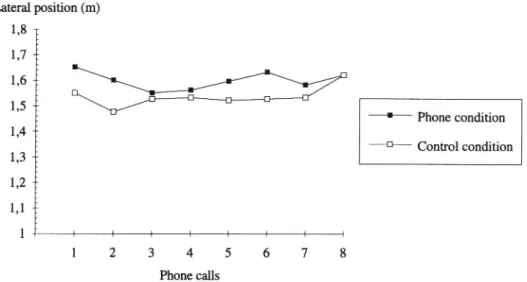
the mean lateral position and the variation in mean lateral position were measured for each subject in the experimental groups for a distance of 500 and 2,500 meters from the onset of each telephone call. During the first distance (0 500 m) the subjects had to initiate the hands-free function of the mobile tele-phone and, therefore, this distance should be studied more closely. It is also of interest to analyze the entire period during which the telephone task is per
formed in parallel with car driving. The second
dis-tance (O 2,500 m) covers that period. For the control groups corresponding measures were taken. Figures 2 and 3 show the results of the 500-metre distance after each call, for the respective driving task. Figure 2 shows that the difference between experimental and control groups for the easy driving condition is
Lateral position (m)
1,8 l
1,7
1,6
1,5
1,4
1,3
1,2
1,1
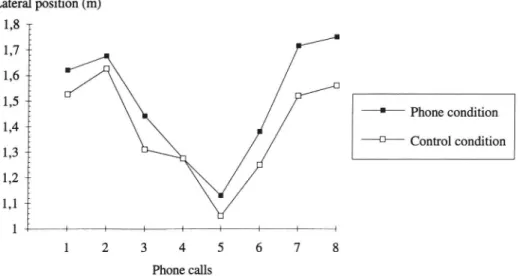
very small. The difference was tested with a two way ANOVA, and did not reach statistical signi cance, F(l,144) = 2.32, [) = .1302. Figure 3 shows that the difference between experimental and con-trol groups was larger for the hard driving condition. There was a signi cant main effect of the RTI sys tem, F(1,144) = 10.97, p = .0012, and a significant interaction between the RTI system and calls, F(7,144) = 19.89, p = .0001. This interaction had to do with the fact that the positions of the telephone calls were randomly generated, and some calls oc-curred on straight sections of the road. Thus the hypothesis was conf1rmed for the hard route, but not for the easy.
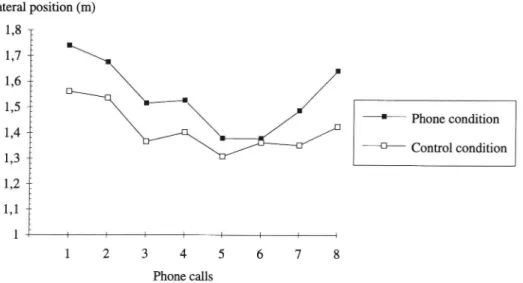
Figures 4 and 5 show the corresponding results for the 2,500-metre distance after each call. Figure
+ Phone condition + Control condition
1 I
Phone calls
Lateral position (m)
1,8 E
1,7
1,6
1,5
1,4
1,3
1,2
1,1
+ Phone condition _D Control condition 1 I Phone callsFig. 3. Lateral position 0 500 m after each telephone call for experimental and control groups in the hard condition.
4 shows that for the entire 2,500-metre period there exists a difference between experimental and control groups for the easy driving task. A signi cant main effect of the RTI system was found, F(1 , 144) = 5.67, p = .0185. Figure 5 shows the corresponding results for the hard driving task. There was a signi cant main effect of the RTI system F(1,l44) = 22.95; p = .0001, and a signi cant interaction between calls and the RTI systems F(7,144) = 6.78; p = .0001. Consequently, the hypothesis was fully supported considering the entire distance where the telephone conversation was performed.
The same calculations were made concerning the subjects variation in lateral position. No signi -cant differences at all were found.
Lateral position (m) 1,8
-1,6
1,4 ;
1,3
1,2
1,1
;
%
1,5
W
WorkloadThe use of the NASA-TLX rating scales gives scale values, weights, and the combination scale values X weights for six different factors. These factors are mental demand, physical demand, time pressure, operator performance, operator effort, and frustration level. The rating value of each factor multiplied by the weight for the respective factor was used for further analysis. A two way ANOVA was performed on each factor. Table 1 shows the results from ANOVAs performed on each factor.
Table 1 shows that there is a signi cant main effect of the RTI system on the factor mental de-mand . The same main effect was found for every factor. It should also be emphasized that the factor
' Phone condition + Control condition
1 I
Phone calls
Driver behaviour as a function of handsfree mobile phones 447 Lateral position (m)
1,8 i
1,7 ;
1,6
1,5
" '
1,4
1,3
1,2
1,1
1 : + Phone condition _D Control condition Phone callsFig. 5. Lateral position 0 2, 500 m after each telephone call for experimental and control groups in the hard condition.
physical demands also showed a signi cant main effect of the RTI system F(1,36) = 5.18; p = .0289. So the introduction of the physical demands associ-ated with the activation of the handsfree function seems to have produced a higher subjective rating of physical demand. Finally, for the factor frustration level there was a signi cant main effect of the RTI system F(1,36) = 6.62; p = .0143, and a signi cant interaction between the RTI system and the route F(1,36) = 5.95;p = .0198. The subjects were more frustrated during mobile telephone use, and this ef-fect was in uenced by route dif culty. In summary, the hypothesis about higher workload due to the use of mobile telephone was supported, but the hypothe sis that workload should increase with the complex-ity of the driving task was refuted.
Speed level
For the experimental groups, the subjects speed was measured from the onset of each mobile telephone call and 80 seconds forward. This covered the entire telephone task for all subjects. For the control groups corresponding measures were taken. According to our hypothesis, the subjects in the
Table 1. Results of ANOVAs performed on the subscales in the NASA-TLX rating scales
Factor Source df F p Mental demand RTI 1,36 30.40 .0001 Physical demand RTI 1,36 5.18 .0289 Time pressure RTI 1,36 6.72 .0137 Operator performance RTI 1,36 7.01 .0119 Operator effort RTI 1,36 5.05 .0308 Frustration level RTI 1,36 6 62 .0143
Frustration level
RTI>1<ROU
1,36
5295
.0198
experimental groups should have a lower speed due to the extra workload introduced by the telephone task. Figure 6 shows the speed levels relevant for this hypothesis.
As can be seen from Figure 6, a difference in
speed exists between experimental and control
groups for both routes. As predicted, the speed is
lower for the experimental groups. The difference
is rather large and also statistically signi cant, F(1,144) = 14.65,p = .0002, for the subjects driving the easy route, thus supporting the hypothesis. The difference for the subjects on the hard route is very small and does not reach statistical significance, F(1,144) = 1.36,p = .2453. In this case the hypothe-sis is rejected.
Effects Of driving task complexity on achievement of the telephone task
To investigate if the complexity of the driving task had any effect upon the subjects performance in the telephone task, the number of correct judg-ments, and correctly recalled last words in correct order for the respective driving conditions were counted. Table 2 shows that there was practically no difference between the tasks when considering the number of correct judgements of the sentence sense. There is a small difference in the number of correct recalls of the last words (in the correct order) in each sentence. That difference is, however, very small, and does not reach statistical signi cance. Consequently, the hypothesis was not supported.
DISCUSSION
It was found that when the driving task Was easy, a mobile-telephone task had a negative impact
Speed (km/h) 110
100 --
w
90 7080 __ W
+ Phone condition easy task + Phone condition hard task Control condition easy task"_o Control condition hard task
J-60
Phone calls
Fig. 6. Speed level 0 80 5 after each telephone call as a function of driving task and RTI system.
on drivers ability to react quickly, but when the driving task was hard no negative impact was found. These results are somewhat surprising. A rather common assumption is that nondriving related infor-mation can be given to a driver when the driving task is easy. The addition of a secondary task is often supposed to have a positive effect, by alerting the driver. The results of this study do not support that assumption. One possible way to explain these results is to consider how the subjects have given priority to either the task of driving (the primary task) or the telephone task (the secondary task). The demands of the hard-driving task mayhave induced the subjects to concentrate more on the driving task. This involves attention to and judgments of the road geometry and judgements of how to adapt the speed and steering strategy to the road geometry. The task demands may have forced the subjects to regard the tracking task as their primary task (see Rumar 1987 for a discussion of drivers priorities between
differ-Table 2. Performance in the telephone task as a
function of driving-task complexity
Correct judgments Correct recall Easy Hard Easy Hard
38 40 10 6 39 39 16 2 38 38 12 14 37 40 37 14 39 40 12 15 40 39 28 26 37 40 22 29 40 38 23 25 40 38 14 14 39 40 10 17 Mean 38.70 39.20 18.40 16.20
ent subtasks of driving). Consequently, the tele-phone task may have been given a secondary status and was therefore not allowed to in uence the driv ers driving behaviour to any great extent. This could explain the lack of difference between experimental and control groups in the hard driving-task condi-tion. In the easy driving task the subjects did not have to allocate much attention to the driving task, and this may have led the subjects to give the tele-phone task primary status. The fact that there was a tendency for the subjects in the easy driving condi-tion to perform better on the memory retrieval part of the telephone task and that the subjects in the hard driving condition were more frustrated according to the NASA-TLX scores, gives some support to this explanation.
If this explanation is correct, the introduction of a nondriving task can have different effects, de-pending upon what priority drivers give the nondriv-ing task. This in turn depends upon the drivers judgement of the complexity of the driving task, and
their own ability to cope with that complexity. If the driving task is perceived as very easy, the nondriving task may be treated as the primary task, and this
may have negative effects upon the drivers ability
to react quickly to an emergency. On the other hand, if the driving task is perceived as hard, it will
presum-ably still remain the primary task even if a
second-ary, nondriving task, is introduced. If this line of reasoning is correct, then it may not always be wise for RTI systems to give their information when the driver s driving task is extremely simple. Instead it may be better to provide the driver with information when the driving task has a medium complexity. This explanation does not deny the possibility that a secondary task may have an alertness-arousing
Driver behaviour as a function of handsfree mobile phones 449
effect. But it argues that an increase in alertness will not necessarily have positive effects upon the driving task. Instead it may sometimes be used to improve the performance in the secondary task.
Other explanations of the reaction time results fail in one way or another. For instance, another possible way to understand these results is to take a closer look at the task demands of the respective driving tasks. Common for both tasks is that the subjects must detect the red square and perform a braking manoeuvre. To detect the red square they must direct their attention to the field where it oc-curs, and to brake quickly they must shift their foot from the accelerator to the brake pedal. In the easy driving task, the tracking component was fairly easy, which probably led the subjects to have their visual attention focused straight ahead most of the time, that is, in the area where the red square occurred. In the hard driving task the subjects drove a rather curvy road, which most likely led them sometimes to focus their visual attention on areas where the red square did not occur. Thus it seems reasonable to assume that the subjects detection of the red square was somewhat faster in the easy (straight), compared to the hard (curvy), driving task. Another aspect also speaks for this conclusion. It seems rea sonable to assume that the subjects stress level was somewhat higher in the hard driving task, due to the more complex tracking component. The results from the NASA-TLX also speak for this conclusion since the subjects in the hard driving task were more frus-trated than the subjects in the easy driving task. When the stress level increases this normally leads
to a narrowing of attention, in extreme cases to tun- .
nel vision . This presumed narrowing of attention could have made it somewhat harder for the subjects in the hard driving task to detect the red square. The next phase in the reaction-time measurement involves the action of moving the foot from the accel-erator to the brake pedal. Since the mean speed for the easy versus hard route was different, we should also expect a time difference between the groups due to the differences in relative position between accelerator and brake pedals. Earlier studies, for instance that of Davies and Watts (1969), have indi-cated such a difference. Since the subjects in the easy condition were driving faster and thus had a somewhat longer relative distance between acceler-ator and brake pedal, it seems reasonable to assume that they needed a somewhat longer time to initiate the brake manoeuvre. Consequently, the subjects in the easy condition may detect the red square more quickly, but should need a somewhat longer time to initiate the brake manoeuvre. The subjects in the hard condition may detect the red square somewhat
more slowly, but may be slightly quicker to initiate the brake manoeuvre. If detection time is the largest component, then these two components can be used to explain the results of the control groups in both driving tasks. But to apply the same logic to explain the opposite results of the experimental groups is not possible.
Another possible way to explain the results is in terms of arousal level. It is possible to assume that the subjects in the easy driving condition had a very low level of arousal caused by the rather boring task of driving straight ahead. This could explain their relatively slow reaction to the red square in the experimental group. In the hard
driving condition the subjects level of arousal
may have been higher due to the rather complex tracking component. This could explain their some what quicker reaction to the red square in the experimental group. The problem is, however, that this cannot explain the opposite results for the control groups.
It was predicted that a mobile telephone task
would negatively affect drivers ability to monitor and adjust the vehicle s position on the road. The effect was predicted to be stronger when the de-mands of the driving task increased. The results from this study showed an effect on the drivers mean lateral position, where the mobile-telephone task made the drivers drive somewhat closer to the right side of the road. This effect was more pro-nounced when the tracking task was complex. No negative effect on the drivers variation in lateral position could be detected. Thus it seems as if the mobile-telephone task made the subjects drive somewhat closer to the right of the road, without any increase in variation in lateral position. In this context it is important to remember that the subjects did not have to make a call. Instead, they received a call and only had to activate the handsfree function. During the rest of the telephone task they could devote their visual attention to the road and their own position on the road.
The prediction was that the workload would be increased due to the mobile-telephone task. Also this prediction was con rmed. A somewhat surprising nding was that even their assessment of physical workload was increased, despite the fact that the only physical manoeuvre the subjects had to do was to activate the hands free button. This may mean
that the activation of the handsfree button should
be improved. One improvement would be to indicate the handsfree button more clearly.
It was also predicted that the workload would increase even further when the driving task was complex. This hypothesis was not supported, with
the exception of a higher frustration level. This can
be interpreted to mean that the subjects in the hard driving task gave the task of driving the car the
highest priority, and that the demands from the
sec-ondary task (the telephone task) were not allowed to interfere with the driving task. When the workload is increasing and threatens to be higher than driver capacity, one strategy is to concentrate the efforts on the most important task. This will result in an increased frustration level, since the driver must pay secondary attention to some tasks and partly ignore others.
It was predicted that increased workload would lead to decreased speed and that the decrease in speed would be proportional to the increase in work load. It was found that there was a signi cant differ ence in the predicted direction for the subjects in the easy, but not for those in the hard driving task. Again, these results are somewhat surprising, but can be explained in the same way as the results concerning the subjects reaction time. That is, the subjects in the easy driving task may have turned the telephone task into their primary task. Because of the high workload devoted to the telephone task, this may have led to a decrease in speed. The sub jects in the hard driving task may, according to this
hypothetical explanation, have devoted most of their workload to the task of driving and less to the task of solving the telephone task. Consequently, the de-crease in speed was not performed to the same
extent.
The prediction was that the complexity of the driving task would have an effect upon drivers abil-ity to successfully perform the mobile telephone task. An analysis of the decision and memory com-ponents in the telephone task did not reveal any signi cant differences due to the complexity of the driving task. It was also noted that the subjects performance on the decision aspect of the task was close to perfect. In other words, we had a ceiling effect, meaning that this part of the test may have been too simple. On the short term memory aspect there was a tendency for the subjects in the easy task to perform better, but this tendency was not signi cant. Consequently, the prediction was not supported. This can be interpreted in many ways. One possible interpretation is that the test used is not sensitive enough to detect any difference in per-formance. Another possible interpretation is that the difference in driving task complexity was too small. Manipulation of the tracking component can be the wrong way to increase task complexity since the tracking task of driving should be one of the most overlearned tasks. It would be of interest for future studies to vary driving task complexity in other
ways, and to investigate the effect(s) on a secondary task.
Finally, a re ection concerning the method used in the experiment. The advantages of using a driving simulator are many. It is possible to have an optimal
control of the experimental setup, which makes it
possible to use relatively few subjects in an experi ment. It is also possible to expose subjects to situa-tions that would be dangerous in real life. One of the drawbacks is, of course, the question of external validity. To what extent is it possible to generalize from these results to a real situation? This question can only be solved through empirical studies of the simulator s external validity. In this context it can be noted that the lateral path deviations found by Zwahlen et al. (1988) in a eld study, were also found in the simulator study conducted by Stein et al., (1987). The reduction in speed level in a eld study by Brown et al. (1969) was also found in this study for one experimental condition. Thus there is some support for the external validity of simulator studies. The quality of realism of a simulator is probably very important for the external validity of the studies and probably also the way the subjects are instructed and trained before the experiment. Despite the fact that the VTI simulator is very advanced and that the subjects in the study were well pretrained and instructed, the results from this study may depend to some extent upon the use of a driving simulator. The fact that no real threat or real consequences occur if the subjects commit an error may have in-uenced the results. But, in this context it must be noted that exactly the same argument is also valid for any eld study. For ethical reasons it is not possi-ble to conduct a eld study in which a participant runs a risk of being exposed to any real threat or
dangerous consequences.
Acknowledgements The study was performed as a part of the
DRIVE project V 1017 BERTIE, Changes in Driver Behaviour
due to the Introduction of RTI systems. We are indebted to the members of the BERTIE consortium and especially to HUSAT,
Loughborough. The authors are indebted to a number of persons at the VTI, who have helped us to plan, perform, analyze, and interpret this study. Maria Berlin has assisted in the running of many subjects and also participated in the data analysis. Håkan Jansson created the routes and routines for collection of driving performance data needed in this study. Besides, he was most helpful during the running of the experiment, at any hour of the day. Roland Ostergren was responsible for the function and control of the mobile telephone equipment and the collection of data from the telephone task. A number of colleagues have made critical and helpful remarks on earlier versions of this manuscript. Special thanks to Kåre Rumar, Roger Johansson, Irma Alm, Sven Dahlstedt, and two unknown reviewers for valuable comments. Christina Ruthger has corrected the language. We are most grate-ful to Ericsson Radio Systems, represented by Erik Andre , who provided us (at no cost to the project) with the mobile telephone equipment necessary to perform this study. This study was
nan-Driver behaviour as a function of handsfree mobile phones 451 cially supported by the Swedish Transport Research Board (TFB)
and the Swedish National Road Administration (SNRA).
REFERENCES
Baddeley, A. D.; Logie, R.; Nimmo-Smith, I.; Brerefon, N. Components of uent reading. Journal of Memory and Language 24:119 131; 1985.
Brown, I. D.; Tickner, A. H.; Simmonds, D. C. V. Inter-ference between concurrent tasks of driving and tele-phoning. Journal of Applied Psychology 53:419 424; 1969.
CHP: Mobile telephone safety study (1987). Department of California Highway Patrol, USA.
Davies, B. T.; Watts, J. R. Preliminary investigation of movement time between brake and accelerator pedals in automobiles. Human Factors 11:407 410; 1969. Hart, S. G. ; Staveland, L. E. Development of NASA-TLX
(Task Load Index): results of empirical and theoretical research. In: P. A. Hancock and N. Meshkati (editors),
Human Mental Workload. Amsterdam: Elsevier Sci-ence Publishers B.V. (North-Holland); 1988.
Nilsson, L. The VTI Driving Simulator. DRIVE Project V1017 (BERTIE), Report No. 24. Linköping: Swedish
Road and Traffic Research Institute; 1989.
Nordmark, S.; Jansson, H.; Lidström, M.; Palmkvist, G. A moving base driving simulator with wide angle visual system. VTI särtryck 106A. Linköping: Swedish Road and Traffic Research Institute; 1986.
Rumar, K. Information needs. In: Route guidance and in-car communication systems. Paris: OECD, Road Trans-port Research, Scienti c Expert Group MC 5; 1988. Stein, A. C.; Parseghian, Z.; Allen, R. W. A simulator
study of the safety implications of cellular mobile tele-phone use. In: American Association for Automotive Medicine (AAAM), Proceedings of the 31st Annual Conference. Des Plaines, IL: AAAM; 1987.
Zwahlen, H. T.; Adams, C. C., Jr., Schwartz, P. J. Safety
aspects of cellular telephones in automobiles.