Actively Managed
Investments
A comparison of US hedge and
equity mutual funds
MASTER’S THESIS WITHIN BUSINESS ADMINISTRATION
THESIS WITHIN: Finance
NUMBER OF CREDITS: 30 ECTS
PROGRAMME OF STUDY: Civilekonomprogrammet AUTHOR: Fors, Oskar & Andrén, Erik
i
Acknowledgements
We would like to show our gratitude and appreciation to Michael Olsson and Pingjing Boo for guiding us thorough the thesis process. They have provided us with valuable inputs and guidance which has made our writing a lot easier.
Furthermore, we would like to thank other lecturers and fellow students for taking the time and answering questions that arose during this semester. It has been highly appreciated.
Erik Andrén Oskar Fors
ii
Master’s Thesis within Business Administration, Finance
Title: Actively Managed Investments
A comparison of US hedge and equity mutual funds
Authors: Fors, Oskar and Andrén, Erik
Tutor: Olsson, Michael and Bo, Pingjing
Date: 2017-05-22
Key terms: Equity mutual funds, Hedge funds, Sortino ratio, Sharpe ratio, Fama-French three-factor model, Risk-adjusted performance
Abstract
Over the past years, the total assets under management among hedge funds and equity mutual funds have increased significantly. The question from an investor point of view is which investment vehicle can provide the greatest return adjusted for risk. The purpose of this study involves an analysis on the historical net asset values to determine and evaluate what one can except from actively managed hedge and equity mutual funds. It supports the determination of the most profitable asset, adjusted for risk, as part of a diversified portfolio. The performance is measured net of fees and costs with the inclusion of potential performance fees individual hedge funds may apply. Hedge funds practice different investment approaches depending on what strategy is applied and hence, return levels can vary dramatically. The study is designed to answer questions by comparing net returns and risk-adjusted returns for respective investments and the different hedge fund strategies. With a deductive research approach, the analysis is conducted by applying existing models and theories as the Fama-French three-factor model through time-series regressions measuring excess returns (alpha), risk-adjusted performance measures as Sharpe ratio, M-squared and the Sortino ratio. The results show that hedge funds outperform equity mutual funds in all examined aspects and produce positive monthly net alphas, on average. Equity mutual funds are unable to provide investors with positive excess returns and subsequently fail the purpose of an actively managed fund by providing returns lower than the return of the market. The results are increasingly strengthened with both time-series regressions and performance measures showing homogenous results and reaching the equal conclusions. From the conclusions that hedge funds provide the most profitable investment compared to equity mutual funds, the hedge fund strategy CTA/managed futures strategies perform best in both net and risk-adjusted terms.
iii
Table of Contents
1.
Introduction ... 1
1.1 Background ... 1 1.2 Problem Discussion ... 2 1.3 Purpose ... 32
Theoretical Framework ... 4
2.1 Mutual Funds ... 4 2.2 Hedge Funds ... 42.3 Efficient Market Hypothesis ... 5
2.4 Previous Research ... 5
2.5 Expected Rate of Return ... 8
2.5.1 Capital Asset Pricing Model ... 8
2.5.2 Fama-French Three-Factor Model ... 9
2.6 Risk-Adjusted Return ... 10
2.6.1 Sharpe Ratio ... 10
2.6.2 Modiglianis’ Risk-Adjusted Performance (M-Squared) ... 11
2.6.3 Sortino Ratio ... 12
2.7 Hedge Fund Strategies ... 12
2.7.1 Long/Short ... 12
2.7.2 Event-Driven ... 13
2.7.3 Commodity Trading Advisors/Managed Futures ... 13
2.8 Survivorship Bias ... 14
3
Data ... 15
4
Methodology & Applied Method ... 17
4.1 Methodology ... 17
4.1.1 Theory Development ... 17
4.1.2 Reliability and Validity of the Research ... 19
4.2 Method ... 20
4.2.1 Risk-Adjusted Return ... 20
4.2.2 Quantifying Alpha Through Multi-Factor Models ... 22
4.2.3 Limitations of Chosen Methods and Theories ... 25
5
Empirical Results ... 27
5.1 Fund Performance by Category ... 27
5.2 Risk-Adjusted Return ... 29
5.2.1 Sharpe Ratio ... 29
5.2.2 M-Squared ... 30
5.2.3 Sortino Ratio ... 31
5.3 Multi-Factor Model Regression ... 32
6
Analysis ... 34
6.1 Fund Performance by Category ... 34
6.2 Risk-Adjusted Return ... 34
6.3 Alpha by Fund Category ... 36
7
Conclusion ... 40
8
Discussion ... 42
iv
Tables
Table 3 Descriptive Statistics ... 16
Table 5.2a Sharpe Ratio between fund classifications ... 29
Table 5.2b M-Squared between fund classifications ... 30
Table 5.2c Sortino Ratio between fund classifications ... 31
Table 5.3a Regression output between fund classification ... 33
Table 5.3b Annualized alphas ... 33
Figures
Figure 4.2a Fama-French Portfolio Construction ... 23Figure 5.1 Returns by Fund Category ... 28
Appendix
Appendix 1. Regression Intercepts & Coefficients ... 481
1. Introduction
The following chapter introduces the reader to the background and purpose of this study. The chapter also presents subsections such as exclusions in the study, a statement on what problems to address and key definitions.
The past decade’s low interest rates have not been beneficial for investors. Instead of keeping the money in the bank, investors look for alternative investments such as real estate or the stock market. The increased demand for investments in financial markets can be illustrated by proportion of investments made, on average, by American households (Statista, 2016). Hedge and equity mutual funds are two options that have experienced significant increases in assets invested (BarclayHedge, 2016; Statista, 2016). Quantifying the size of the growth, Preqin (2017) states the hedge fund industry’s net capital inflow from December 2015 to November 2016 amounted to $71,5 billion making it a $3,22 trillion industry in the world’s biggest financial market (Martin, 2016). The substantial increase in the financial markets emphasizes the importance of finding a suitable investment that delivers performance in accordance with expectations of each investor.
1.1 Background
The number of alternatives investors have when investing monetary funds are many. Some, like hedge funds, can be categorized as sophisticated in the sense of its complexity. The common hedge funds use progressive strategies and are not limited in their positions by common buy and hold strategies which enables hedge funds to use flexibility in their investments, occasionally highly leveraged. Subsequently, hedge funds often fall victim for speculation since the risk factor is counterweighed by the potential benefit. The purpose of these strategies is to make hedge funds profitable in any market climate, bullish or bearish, and are in general less affected by market movements than mutual funds (Gregoriou, Rouah, & Sedzro, 2003). The most common strategies applied by hedge funds are strategies involving trading on particular events, taking long and short positions, speculating using futures and trying to capture arbitrage opportunities.
The fundamentals of an equity mutual fund place greater emphasis on buy and hold strategies. Equity mutual funds are investments targeting a broader group of investors. Due to low minimum deposit requirements, equity mutual funds are attractive investments for all
2
kinds of individuals. These funds generally allocate its funds in more common assets e.g. securities such as stocks, bonds and other financial instruments. One unit of a fund, possibly containing different stocks and bonds, can be purchased at its net asset value. This value is a price calculated based on the combination of securities included in the fund, net of fees, costs and liabilities (U.S. Securities and Exchange Comission, 2017). Additionally, hedge funds sometimes charge fees associated with how they perform, which is adjusted for in the net asset value. These fees are typically covered by high water marks and hurdle rates to protect investors from being charged by these performance fees when funds do not perform and will typically be charged at a periodical basis, most commonly quarterly or semi-annually (Lhabitant, 2010). Equity mutual funds can be passively or actively managed depending on its objectives. Passively managed funds are often index funds aiming to follow a market index and thus never exceed index returns while actively managed funds have a portfolio management that allocates funds a certain way with the objective to perform better than market index. Therefore, the goal of active management of portfolios is to generate excess returns, denoted alpha (Morningstar, 2017). This study solely focuses on the latter and will involve the performance of actively managed investment vehicles, hedge and equity mutual funds.
This study aims to, out of an investor’s perspective, measure and analyse what one can expect from investing in hedge and equity mutual funds in terms of risk adjusted return, market sensitiveness and the overall associated risks, in the US market, net of all costs and fees.
1.2 Problem Discussion
With limited amount of information existing regarding American hedge fund performance, this study will provide further information about an industry known for narrow information disclosure (Gross, 2015). Putting hedge fund performance relative to the counterpart, equity mutual funds, provides information to investors that look towards investing in the US market. The relative performance is an essential part of the study that will involve measuring attached risks to respective investments. The historical data to be observed does not predict the future, but solely gives a measure on how different investments have performed in the past and gives insight on what one can expect from respective investments.
Due to differences in the strategies applied by hedge funds, the performance of each strategy and attached risks are relevant to address. Many previous studies in hedge funds address
3
differences among hedge fund strategies and focus on the relative performance in these sub-categories to emphasize differences in performance. To properly evaluate hedge funds, it is important to take these differences in strategies into account when assessing the attached risks and performance.
1.3 Purpose
The performance of the two types of investments differs significantly from one another. By comparing large funds, of both equity mutual and hedge funds, the accuracy in the evaluation is increased. The study aims to do this from an investors perspective, meaning data is adjusted for fees and costs to provide numerical net results valued by individual investors. Due to the more complex and different structures of hedge funds, the different performance fees will be included in this study when measuring performance. This study contributes to further information regarding savings alternatives in the biggest financial market in the world. A noteworthy part of the US market, hedge funds, is considered relatively non-transparent in terms of information and performance for individuals outside the funds’ existing clientele. The attached risk and returns for US hedge funds are compared to the relative profitability of equity mutual funds. Out of 8,100 mutual funds available in the US, 4,776 are equity mutual funds aiming investment with ownership in various companies i.e. stocks (Investment Company Institute, 2017). The questions to be addressed are the following:
Does hedge funds yield greater net returns than actively managed equity mutual funds?
Does hedge funds yield greater risk-adjusted returns than actively managed equity mutual funds?
Does any of the most commonly used hedge fund strategies yield higher (or lower) net and risk-adjusted returns?
4
2 Theoretical Framework
The following chapter will further introduce the reader to the different terms, theories, models and measures that have been chosen for this study. Original models followed by its development have been incorporated to give the reader a comprehensive view on how models have been improved and thus more accurate.
2.1 Mutual Funds
A mutual fund is an investment that collects money from many investors and allocates the assets into different securities. The allocation of funds is executed by the fund management within the lines of regulation and investor demands. Mutual funds can be a less risky way of investing than to allocate assets into a single security, since mutual funds contain multiple securities that diversifies the fund’s assets. Therefore, when investing in mutual funds, less volatility in the investment is to be expected. When investing in mutual funds, the fund management typically charges fees and expenses that is important for investors to consider when investing (Morningstar, 2017). Equity mutual funds allocates its assets primarily in equities.
2.2 Hedge Funds
When investing in hedge funds, more complex and dynamic strategies are expected. Unlike equity mutual funds, hedge funds provide the dynamic aspect of being able to take short positions. Taking short positions in the financial market means borrowing assets, sell them, and then buy them back at a lower price before returning them, if the short is successful. The unique part about hedge funds is not only the fact that they take short positions, they also integrate strategies using leverage and financial contracts in the position taking. Unlike equity mutual funds, hedge funds occasionally use another way of charging their investors
for allocating assets into their fund. Hedge funds charge a percentage of the returns
generated, which gives managers an incentive to act in favour of their investors. Also notable is that hedge funds apply different strategies to their different funds that emphasis the way they operate in their position taking (BarclayHedge, 2017).
While equity mutual funds are under the supervision and regulation of the US Securities and Exchange Commission, hedge funds are less regulated which enables hedge funds to be more dynamic in their strategies (BarclayHedge, 2017).
5
2.3 Efficient Market Hypothesis
When investing in the stock market, investors look for opportunities such as undervalued stocks or trends in the market and certain sectors. Fama (1965) developed a theory referred to as the Efficient Market Hypothesis stating that the values of all securities in the market already incorporates all information available. The assumption is that the market is efficient and that all securities possess a fair value, and it is therefore impossible to outperform the market on the basis that securities are undervalued (Morningstar, 2017).
The Efficient market hypothesis states that a market can be efficient in different levels, weak, semi-strong and strong. When the market is in weak form of the hypothesis, prices incorporate all available information to the market. An assumption is that historical prices and volumes has no connection to the future direction of stock prices and therefore rejects the application of technical analysis as a tool for generating excess return. Semi-strong form of the efficient market hypothesis suggests that when new knowledge is released to the market, prices adjust to its new fair value quickly. The price of each security already incorporates public and recent information suggesting that fundamental analysis cannot provide excess return. The strong form of the efficient market hypothesis states that each security’s value reflects all public and private information. This implies that the market already reflects all information there is making insider trading irrelevant. It is not possible to generate excess returns in the market on a regular basis (Morningstar, 2017).
2.4 Previous Research
In a setting with emerging research on hedge funds, Ackermann, McEnally and Ravenscraft (1999) extended the literature within the subject in four different ways. A larger sample compared the previous research in the subject was compiled from monthly returns rather than annual. A new data- conditioning bias analyses was used which included bankrupt and liquidated funds. Ackermann et al. (1999) tried to link the performance of hedge funds with the performance fees frequently used throughout the industry. Lastly, they set out to provide empirical evidence that hedge funds were significantly risker than its mutual fund counterpart and examining the key reasons for this conclusion. From the results of statistical testing, it was found that due to performance fees, hedge fund managers tend to invest more heavily in their own funds while mutual fund manager do not have any self-interest incentives considering the absence of performance fees for investors. And with less regulations for hedge funds, managers possess more flexibility towards different investment strategies
6
including factors such as derivatives and leverage. This combination of flexibility in strategies and heavy self-investing gave a great performance advantage for hedge funds compared to the mutual funds that acts, due to the lack of big investments and flexibility, far more conservative. The study determined that the incentive fees are the largest factor affecting risk adjusted return. Results show that the upturn in Sharpe ratio, going from zero performance fee to the median equalling 20 per cent, amounts to 66 per cent. The evidence of the study determined that incentive fees do not generate tendencies of taking on increased amounts of risk (Ackermann et al., 1999).
A similar finding was claimed by (Liang, 1999) in his evaluation of hedge fund performance in relation to mutual funds. By examining the period of 1992-1996, hedge funds performed better than mutual funds on average. Much of this dominance is connected to the applied strategies used by hedge funds, which allow a greater flexibility in their allocation of assets. Hedge funds performed better over the period, not only in terms of return, but provided higher Sharpe ratio and better manager skills. Liang also found that hedge funds provide lower exposure to the market in general i.e. lower betas. Notable was that the higher returns for hedge funds also meant higher standard deviation (Liang, 1999). An additional study conducted by Lo (2002) determined and addressed the importance of understanding the outcome of risk-adjusted performance. The study contained findings that showed when measuring the Sharpe ratio, estimations on performance is less accurate when examining securities with increasing volatility, such as hedge funds. The study showed that when measuring hedge funds, Sharpe ratios were, in different cases, overestimated or underestimated by as much as 65 per cent. The Sharpe ratio is widely used in evaluating performance with respect to standard deviation being defined as risk, yet studies have been conducted addressing the issue of interpreting its meaning and measure. McLeod and van Vuuren (2004) stress this difficulty with determining whether a Sharpe ratio that is expressed in ratio terms is satisfactory or not. The study emphasizes the difficulty in evaluating if the ratio provides sufficient information regarding risk-adjusted performance.
When investing in hedge funds it is important to be aware of which strategy is applied by each fund. Brown and Goetzmann (2003) found that different risks are attached depending of which fund strategy is applied. Another finding discovered was that the returns of each year for funds were dependent on which strategy used by each hedge fund. They concluded that investors should engage in analysing the different strategies before investing in a hedge
7
fund to match each investor’s risk and return profile (Brown & Goetzmann, 2003). A similar and more recent study made by Fung and Hsieh (2011), the performance of hedge funds applying long/short strategies was evaluated. Their study involves the relative performance to mutual funds and provides a large sample to add accuracy to their findings. They observe the funds over a period from 1994-2008 and find that less than 20 per cent of the hedge funds did provide excess return from its benchmark on an annual basis. They found that the performance of the long/short strategy applied by hedge funds exceeded mutual funds. Most alphas identified in the sample of hedge and mutual funds were found among hedge funds and it could therefore be concluded that hedge funds provide better returns over time. Part of the study also incorporated the differences in risks attached to hedge and mutual funds. The study could determine that there did not exist any significant difference in risk between mutual and hedge funds applying long/short strategies (Fung & Hsieh, 2011).
The differences in performance between hedge and mutual funds were also examined by Eling and Faust (2010). Their approach was looking at hedge and mutual funds in emerging markets and measure the relative performance to provide information about what to expect from each type of fund. They incorporate funds in countries with vast growth that focus on industrial development. Hedge funds provided significantly higher returns than mutual funds, which did not always generate positive alphas in relation to traditional benchmarks. The study also includes explanations for these differences in performance by involving the fundamentals of hedge funds which involve more flexible and dynamic strategies that does not follow that same regulations as mutual funds (Eling & Faust, 2010).
Bali, Brown and Demirtas (2013) directs research towards the relative performance of hedge funds to US equities and bonds. The findings in the research conclude that some strategies applied by hedge funds perform better than US equities and bonds. The research does not contain commonly used measures of performance and risk such as mean variance, Sharpe ratio and alpha. An important finding was that hedge funds did not outperform equities and bonds in the short term, outperformance was only identified over a longer investment horizon.
David F. McCarthy (2015) analysed the performance and risks attached to mutual funds in relation to hedge funds. The research focused specifically on mutual funds applying multialternative strategies referring to its alternative investment approach such as taking long
8
and short positions, trading futures or swaps, among others (Morningstar, 2017). The findings showed that the performance of these mutual funds was worse than the performance of hedge funds over the period of 36 and 72 months all ending 2013. The mutual funds that performed well were the ones applying a diversified strategy but overall, the research showed that hedge funds outperform mutual funds. The research built its content and conclusions on measuring the exposure of funds to different benchmarks reflecting stocks, bonds and currencies. The risk and reward is measured by quantifying the funds’ Sharpe, beta to the S&P500, alpha and yearly returns.
2.5 Expected Rate of Return
When evaluating performance and the excess return generated by an investment, the investment is often compared with the risk-free rate. The risk-free rate is usually used as a factor when calculating cost-of-equity capital and is often represented by US governmental bonds. The risk-free rate helps an investor to obtain the risk premium with an investment, which is the return of an asset for a specific period minus the risk-free rate. The representation of the risk premium is the return obtained for taking the extra risk (Shannon, Grabowski, & Brealey, 2014).
2.5.1 Capital Asset Pricing Model
The capital asset pricing model dates to the 1960s when Sharpe (1964) and Lintner (1965) independently developed the commonly used model. It has its foundation in the financial portfolio theory developed by Harry Markowitz (1952) that assumes investors are risk averse and decision making is based on two variables, maximizing expected return (according to historical mean) and simultaneously minimizing riskiness (expressed as standard deviation). Maximizing return and minimizing risk is exercised by allocating funds over different assets in different industries with low covariance to construct a diversified portfolio. Assumptions made in the capital asset pricing model is that transaction costs and taxes are non-present, all individual investors share views on probabilistic likelihood of return distributions and any investor can borrow or lend at a given risk-free interest rate (Jensen, Black, & Scholes, 1972). The capital asset pricing model is based on evaluating variability in stock returns using only one risk factor, non-diversifiable systematic risk, with the argument that other risk factors can be eliminated with diversification (Perold, 2004). The risk factor argued to affect returns,
9
beta, is measured by estimating a securities sensitiveness to a specified market index. The equation for estimating beta to index is:
𝛽𝑖=𝐶𝑜𝑣(𝑅𝑉𝑎𝑟(𝑅𝑖, 𝑅𝑚) 𝑚) .
The expected return can be explained by the capital asset pricing model, as:
𝐸(𝑅𝑖) = 𝑅𝑓+ 𝛽𝑖(𝐸(𝑅𝑚) − 𝑅𝑓) + 𝜀,
where the risk-free interest rate, defined as 𝑅𝑓, is added with the sensitiveness of an asset
relative to the market (𝛽𝑖) multiplied with the risk premium. 𝑅𝑚 signifies the rate of return
for a specific market index while 𝑅𝑖 constitutes as the return for asset or portfolio 𝑖.
2.5.2 Fama-French Three-Factor Model
The Fama-French three-factor model (1992a) is an extension from the capital asset pricing model. While the capital asset pricing model aims to explain returns using only one factor signified by an asset’s sensitiveness to the market as a whole, denoted beta, Fama and French explained stock returns using two additional variables. The two additional explanatory variables that Fama and French introduced were elements related to firm size, often identified as factor small minus big (SMB) and book-to-market ratios, often denoted as factor high minus low (HML). Fama and French (1992a) succeeded to give the model more explanatory power of stock returns and determined 90 per cent of stock variability could be explained by the three-factor model. The linear regression can be defined as:
𝐸(𝑅𝑖) = 𝑅𝑓+ 𝛽(𝑅𝑚− 𝑅𝑓) + 𝑠𝑖𝑆𝑀𝐵 + ℎ𝑖𝐻𝑀𝐿 + 𝜀.
Since the publication of ‘Common risk factors in the returns on stocks and bonds’ in 1992, two major additions to the three-factor model has been made. Carhart (1997) investigates persistence in fund performance and adds a fourth factor simulating risk associated with
momentum i.e. the phenomena that a fund performing well at time 𝑡 is likely to keep
performing well in time 𝑡 + 1. Carhart (1997) constructs the model by simply adding a
one-year anomaly momentum factor. The idea is to capture and mimic risk of momentum proposed by Jegadeesh and Titman (1993) that identified abnormal returns in contrarian portfolios i.e. selling well performing securities and buying the poor performing counterpart.
10
Persistence in security returns was researched in 1993 when Henricks, Patel and Zeckhauser could derive persistence to the ‘hot-hand fallacy’ stating previous success gives increased probability of success in the future (Sinkey & Logan, 2013). This was strengthened with Goetzmann and Ibottson (1994) and Wermers (1997) reaching the same conclusion. All identified and connected stock persistence to the ‘hot-hand fallacy’ in short-term horizons of one to three years. When examining persistence in funds over longer periods of time, Grinblat and Titman (1992) concludes that there are indications of persistence in fund performance over a ten-year period. These indications are, in contradiction to other researchers, not attributed to the hot-hand fallacy but determines historical data provides useful information and generates for successful stock-picking.
Fama and French (2015) extended the three-factor model themselves with two additional risk factors. The factors added were RMW, to simulate risk associated with firms’ profitability and CMA, to simulate risk associated with firms’ investment growth. Fama and French (2015) determines that a five-factor model performs better than its three-factor predecessor. However, the five-factor model have issues in seizing and explaining low average returns on stocks for companies with low profitability yet heavy investment (Fama & French, 2015).
2.6 Risk-Adjusted Return
When assessing the performance of an asset it is important to account for the attached risk. When comparing different investments, the investment that yields the greatest return might not be the most suitable when the risk aspect is included. The return in relation to the risks attached to an investment, also referred to as the risk-adjusted return, helps an investor to compare investments with each other thus enables assessment of expected return for every level of risk taken. The risk-adjusted return shows the investment that contains the highest return for every level of risk and can be applied to compare both high-yield and low-yield investments (The Economic Times, 2017).
2.6.1 Sharpe Ratio
The Sharpe ratio, developed by William Sharpe (1966), helps measure the risk-adjusted return of assets in the financial markets. The ratio is obtained by taking the difference between an asset’s return and the risk-free rate divided by the standard deviation of the asset.
11 𝑆ℎ𝑎𝑟𝑝𝑒 𝑟𝑎𝑡𝑖𝑜 =𝐸(𝑅𝑖)−𝑅𝑓
𝑆𝑡𝑑 𝑑𝑒𝑣𝑖 (1)
Standard deviation is defined as the risk attached to a certain investment. It is obtained by taking the square root of the variance measure defined as the squared deviations from the mean. Greater standard deviation reflects higher levels of risk (Bodie, Kane, & Marcus, 2014). The number derived indicates the return for every level of risk and is widely used to compare relative performance between assets. A higher Sharpe ratio indicates a better risk-reward of the investment, in other words, what an investor obtains for undertaking a certain amount of risk (Morningstar, 2017).
The Sharpe ratio was originally part of evaluating fund performance when its founder, William F. Sharpe (1966), presented his paper on mutual fund performance. The study directs emphasis on the two most important performance predictors, the expected rate of return and an asset’s standard deviation, or volatility.
2.6.2 Modiglianis’ Risk-Adjusted Performance (M-Squared)
When measuring relative performance of assets, it is helpful to look at the risk-adjusted performance to evaluate the potential risks and returns attached to each asset. Franco and Leah Modigliani (1997) came up with a measure to quantify the risk-adjusted performance that has grown into one of the most frequently used measures. The M-squared measure helps the risk-adjusted assessment by offering a measure easier to interpret, while the Sharpe ratio is sometimes hard to understand.
𝑀 − 𝑠𝑞𝑢𝑎𝑟𝑒𝑑 = 𝑆𝑡𝑑 𝑑𝑒𝑣𝑚
𝑆𝑡𝑑 𝑑𝑒𝑣𝑖 (𝐸(𝑅𝑖) − 𝑅𝑓) + 𝑅𝑓 (2)
M-squaredprovides a number in per cent, while the Sharpe ratio provides a measure in terms
of a ratio, which is therefore easier to interpret. M-squaredenables an investor to distinguish
investments due to its attributes of providing an investor the asset with the greatest return on a risk-adjusted basis (Scholz & Wilkens, 2005). Another implication argued is that the Sharpe ratio sometimes is not too helpful when the return of an asset is below the return of the risk-free rate and the ratio is negative (McLeod & van Vuuren, 2004).
12
The fundamentals of the M-squared is that the outcome represents the corresponding return
an asset would have obtained if the asset would possess the same amount of risk as the benchmark used in the model. The comparison of different assets using this measure enables the quantification of applying a similar amount of risk to different assets to see the obtained return. The outcome enables an investor to measure relativeness among assets to see which one yields the greatest return for every risk-level (Simons, 1998).
2.6.3 Sortino Ratio
The Sharpe ratio, along with M-squared, both use standard deviation as the measure of total risk.
𝑆𝑜𝑟𝑡𝑖𝑛𝑜 𝑟𝑎𝑡𝑖𝑜 = 𝐸(𝑅𝑖)−𝑅𝑓
𝐷𝑜𝑤𝑛𝑠𝑖𝑑𝑒 𝑆𝑡𝑑 𝑑𝑒𝑣𝑖 (3)
The Sortino Ratio excludes some of the deviation, or risk, in an asset and only directs focus on the deviation when the return is below the risk-free rate for a given period. The implication of this measure is that it will help an investor to better evaluate risk for a specific asset because some of the volatility is considered good when an asset is outperforming the risk-free rate. The Sortino ratio is calculated by taking the return for an asset, over a period, minus the risk-free rate and then divides this by the deviation that is caused by the asset when it is performing below the risk-free rate, also referred to as downside deviation. By incorporating a downside deviation measure in the risk assessment, the evaluation of an asset becomes more reliable (Morningstar, 2017; Washer & Johnson, 2013).
2.7 Hedge Fund Strategies
Hedge funds as an investment vehicle apply different investment strategies depending on geographical focus and the investment style. The strategies are unique in the sense that all individual hedge funds apply these strategies differently. They are meticulously adjusted and tweaked to suit certain trading objectives. The outlines and general ideas of these strategies are however the same and the major concepts and ideas apply throughout (Connor & Lasarte, 2016).
2.7.1 Long/Short
The Equity Market neutral strategy dates to 1949 when the world’s first hedge fund was established (A.W. Jones, 2017). Within the broad term long/short strategies, there are various structures and individual strategies a fund can undertake. However, the main principle is the
13
same throughout. As the name indicates, these strategies are based on the action of undertaking long or short positions in individual assets. The intention of a fund to position itself this way is to minimize the downside risk and counterbalance any correlation that might exist between market return and return of an individual portfolio i.e. taking large long positions in assets believed to generate positive returns and taking larger short positions in assets believed to generate negative returns. An alternative strategy within the segment is the equity long/short that works identically as the equity market neutral strategy without the stipulation of being market neutral i.e. working towards reducing market risk in each sector or industry (Connor & Lasarte, 2016).
2.7.2 Event-Driven
This segment involves strategies for hedge funds that seek to generate return from short-term events that are expected to make an impact such as corporate restructuring, stock buybacks, changes in earnings, mergers and acquisitions. The two core subsections in these segments are distressed investing and merger arbitrage. The distressed investing focuses on companies’ experiencing difficulties. This strategy does not limit to one certain type of security but can involve any type of asset. Due to cases of mispricing in distressed securities, this technique can produce excess returns in cases where stocks, bonds or any other assets are believed to be mispriced. Due to high risk factors associated with this kind of strategy, funds use different types of hedging to reduce risk. The merger arbitrage strategy focuses on assets of companies involved in mergers or takeovers. When a company announces acquiring another company, the stock price of that company generally falls and when news arises of a target firm bid, the stock of that company generally rises. Naturally, in most of the cases, the merger arbitrage strategy involves taking a long position in the target firm and short-selling that of the acquiring firm (Connor & Lasarte, 2016).
2.7.3 Commodity Trading Advisors/Managed Futures
As the name indicates, practitioners of this strategy specialise in commodities and financial markets for futures. Like the event driven strategies, the Commodity Trading Advisors place emphasis on short-term movements. What differentiates the two is that managed futures strategies trades on patterns by following different sets of rules to capture movements in asset prices. This style of trading requires technical aid, which consequently leads to computer driven software to be a necessity for this style of trading. Such technical trading
14
strategies objective is, to forecast market movement and its timing which is essential for profitable performance (Connor & Lasarte, 2016).
2.8 Survivorship Bias
When measuring the performance of funds, it is sometimes showing a wrong picture of the actual performance. The reason for this wrong estimation is due to a problem in the reporting of performance referred to as survivorship bias (Nasdaq, 2017). Survivorship bias tend to provide investors with an over-estimation of fund performance and can lead to faulty investment decisions. The term focus on the fact that estimates tend to only include the surviving funds for the period examined and do not include funds that has merged or been liquidated for different reasons, such as bad performance. Therefore, funds with high risk attached to their strategy tend to be excluded if they suffer failure, but on the other hand will be included if they remain successful (Malkiel, 1995). In the previous study on the impact of survivorship bias by Malkiel (1995) he found significant differences in the performance of the sample excluding the survivorship bias. When funds that have been shut down are included, the estimations regarding equity mutual fund returns tend to illustrate worse returns than the benchmark index, a conclusion that are not consistent with previous findings in the fund industry.
15
3 Data
The following chapter presents information considering summary statistics of the data and information on the used variables. The sampling of funds is also presented and explained along with the used database and its limitations.
The data used in this study was gathered from the database Thomson Reuters Eikon. The database provides the data needed for this study in terms of historical net asset values for both hedge and equity mutual funds. An essential part in choosing the Eikon database is connected to survivorship bias, Thomson Reuters Eikon provides data on currently active and liquidated securities for all fund classifications. This has eliminated the issue of foreseeing funds not active to our sample and thus eliminating the possibility of survivorship bias in the sample of funds observed and evaluated. Monthly net asset values for hedge and equity mutual funds have been downloaded starting March 2007 until end of February 2017. Dividends reinvested are included along with fees and cost of investing. Market risk premium, SMB and HML factors are calculated monthly and have been obtained from Kenneth French’s Dartmouth web database (French, 2017).
The original sample for mutual and hedge funds was large and had to be, according to what is being examined and measured in this study, demarcated with various conditions to better fit the purpose. With the US focus, the sample of this study was defined by excluding funds with domiciles outside of the US and funds with their geographical investments outside the US. The sample of equity mutual funds consists of open end funds with no restrictions on availability to specific investors. Lastly, restrictions have been set to include equity mutual funds with total net assets greater than $2 billion and hedge funds with total net assets between $20 million and $1 billion during the given period. This has been done to define a sample to reflect a major part of the industry and reach a greater part of capital accessible to investment in hedge and equity mutual funds. The data collected includes the historical net asset values for all funds with available returns in the database.
From the derived sample, this amounts to 32,606 monthly observations divided between equity mutual funds (20,230) and hedge funds (12,376). In terms of monthly observations according to hedge fund strategy, Long/short provides 6,902 observations, CTA/Managed futures 3,332 observations and Event-driven 2,142 observations.
16
In table 3, the characteristics of the data included in this study is presented. Monthly returns calculated using different funds’ net asset value were presented monthly along with factors used to simulate risk when using the Fama-French three-factor model. The equity mutual funds are presented in an aggregated manner while hedge funds are both presented in terms of applied investment strategy and aggregated. In observing the average of continuous monthly returns, it can be determined that hedge funds in total provides more profitable returns than equity mutual funds and hedge funds applying CTA/Managed futures strategies presents the best overall performance equal to an expected return of 0.06 per cent each month. Standard deviations across the sample are relatively close but the lowest variability in returns is observed in hedge funds while the highest deviations from the mean belongs to the equity mutual funds. Worth mentioning is also the fact that both fund categories present
lower variability in returns than the risk proxy 𝑅𝑚− 𝑅𝑓, a measure calculated to illustrate the
performance of the US stock exchanges. The deviations from the means is further illustrated by the best and worst performing months denoted min. and max. Equity mutual funds performed 13.4 per cent worse compared to hedge funds at the worst point during the period and performed 4 per cent better than hedge funds at the given best point in time. This explains the case of a standard deviation equal to a monthly 4.8 per cent for equity mutual funds.
Table 3 Descriptive Statistics
Classification Sample Observations Mean Std dev Min. Max. Kurtosis Skewness
Equity Mutual Funds 170 20,230 0.003 0.048 -0.195 0.107 1.771 -0.795 Hedge Funds 104 12,376 0.005 0.022 -0.061 0.067 0.521 -0.223 Long/Short 58 6,902 0.005 0.030 -0.113 0.082 2.118 -0.751 CTA/Managed futures 28 3,332 0.006 0.035 -0.068 0.107 -0.227 0.206 Event driven 18 2,142 0.004 0.025 -0.108 0.076 4.040 -0.934 𝑅𝑚− 𝑅𝑓 - 119 0.002 0.057 -0.172 0.102 0.472 -0.673 SMB - 119 0.004 0.024 -0.043 0.061 -0.448 0,296 HML - 119 -0.004 0.035 -0.113 0.079 1.350 -0,149
Skewness describes the symmetry of the distribution in the dataset and a non-skewed distribution possess a skewness measure equal to zero. The measure presented in table 3 indicates that the dataset suffers from small amounts of skewness.
17
4 Methodology & Applied Method
The following chapter presents the methods chosen and the different stages for developing the research strategy, how to use the data collected and a discussion regarding problems and weaknesses that can be identified with the chosen methodology.
4.1 Methodology
The purpose of this study is to provide further information to investors regarding the two types of investments. When assembling necessary data and presenting numerical relativeness, the method and methodology is vital to be as accurate and comprehensive as possible to satisfy the purpose of the study. This methodology is characterized by how the quantitative research is done that evaluates the differences in the attached risks and performance of hedge and mutual funds (Saunders, Thornhill, & Lewis, 2016).
4.1.1 Theory Development
When engaging in research, the assumptions and beliefs by the researchers will have impact on the process and the interpretation of the conclusions. The research matrix developed by Saunders et al. (2016) illustrate the different problems when choosing the way, a researcher gather data and what analytical techniques that will be implemented. The first part of the matrix emphasizes the research philosophies of the researchers. There are five main philosophies that will address the characteristics of the researchers’ assumptions and beliefs in the study (Saunders et al., 2016).
The aim of this study is to compare the relative performance and attached risks to US hedge- and mutual funds. The gathered data, testing and analysis will be based on a sample of large hedge- and equity mutual funds and therefore will not provide an exact measure of what to expect from these investments. The conclusions will rather aim to provide an indication of what to expect from investing in hedge and equity mutual funds in the US to being able to evaluate the attached risks and returns so the separate investments. By excluding the fact that one measurement will provide a complete image and instead incorporating several measures will increase the relevance and comprehensiveness of the study (Kelemin & Rumens, 2008). These assumptions and beliefs about the study are therefore categorized under pragmatism. The purpose and the conclusion of the study are connected by procedures and the methodology. How the research satisfies the purpose of the study is based on the theory
18
development. Is the study based on a theory that is tested by already existing theories or is the study’s aim to develop a new theory through gathered data? The theory development previously mentioned is referred to as deductive and inductive, respectively. By combining induction and deduction there is a third way, abduction, which focuses on moving from applying the deductive approach and, at times applying the inductive approach. (Saunders et al., 2016). When measuring the relative performance and risks of hedge- and mutual funds in the US, a deductive approach to theory is used due to its origin from existing theory. It was vital to create an understanding of previous research to be able to measure and examine hedge and equity mutual fund performance through the application of quantitative models using historical data (Bryman, 2012). The study is based on already existing theories that enables the quantification of the attached risks and the relative performance to obtain the expected risks and returns for the evaluation of the hedge and mutual fund market. The application and usage of already existing theories facilitated the evaluation and analysis to test these theories when using up-to-date data on net asset values from the sample of hedge and mutual funds. The obtained results from integrated models were then to be compared with previous studies to evaluate the consistency in results.
When conducted the research of this study, the research design was vital to clarify how the questions are answered in the study. To satisfy the purpose of the study, it was important to clarify whether the research design is quantitative, qualitative or a mixed method. Quantitative research is the process of integrating numbers into a research. Quantitative research is commonly demonstrated graphically, in numbers or in a statistical agenda to observe connections between different variables. Qualitative research is research not expressed by including numbers and aims to expand or establish theory. Qualitative research is often expressed by conducting experiments or surveys to explain values and connections about the people participating in the study. A mixed method design is research that integrates both quantitative and qualitative attributes to either come up with new theory or to test existing (Saunders et al., 2016). When comparing hedge funds to equity mutual funds, the application of already existing theories to spot relationships emphasizes the use of a deductive approach to the study while incorporating quantitative data. The integration of historical returns of the included funds enabled the application of existing theories to assess the performance and risks attached to a specific fund category. The integration of quantification and analysis of gathered data, along with the deductive approach emphasises the quantitative strategy’s usage and application on this study.
19
4.1.2 Reliability and Validity of the Research
When conducting research, it is essential to consider the value of the research. The value of the research emphasizes the range of how reliable and valid a study is. Therefore, the value of the conducted research can be summarized into two segments, the reliability and validity. Reliability emphasises the importance of being able to consider research to be reliable, which can be verified by if the research replicates previous studies and obtains consistency in terms of the same results. If these requirements about the conducted research are being fulfilled, the research is considered reliable (Saunders et al., 2016). The application of reliability in this study is reflected in the consistency in applied methods.
The second segment supporting the value of research is validity. Validity directs the focus on how the research is being conducted, how parameters are quantified by using the suitable measures and if the obtained results and conducted analysis contains any accuracy to previous research. In this study, the validity of the measures used to assess risk and performance will be able to satisfy this part of the value and quality of the research.
In terms of the measures used to assess the risk-adjusted performance we apply the Modigliani’s M-squared measure, which differs slightly from the Sharpe ratio and is a commonly applied measure by investors. To further assess the risk-adjusted performance, the Sortino ratio is integrated to account for the downside risk. This is also a measure previously integrated in journals in the assessment of performance with respect to downside risk. When measuring the performance by hedge and equity mutual funds, the validity and reliability in terms of consistency will also be justified by integrating the Fama-French three factor model. Due to its wide application and integration in previous studies, the conclusion of the study contains an increased credibility for being interpreted as reliable. By also separating the different strategies applied by hedge funds, the replication of previous research ensures reliability and consistency to the research in this study. Therefore, the integration of previously applied procedures in this study verifies the validity, while the replication of previous comparisons in the area and outcome of the quantifications account for the reliability.
20
4.2 Method
4.2.1 Risk-Adjusted Return
Historical data concerning risk and returns are useful in financial analysis and therefore becomes natural areas of emphasis. Return on any given fund can be calculated with the net
asset value and is defined as 𝑅𝑓= ln(𝑁𝐴𝑉𝑡) − ln(𝑁𝐴𝑉𝑡+1). The returns have been calculated
with continuous compounding using natural logarithms to get accurate and precise rates of returns.
To evaluate risk-adjusted performance, the commonly applied Sharpe ratio is integrated. The integration of additional measures gave the performance evaluation increased accuracy and strength. Risk-adjusted performance measures used independently, can be, as illustrated by McLeod and van Vuuren (2004) and Lo (2002), hard to interpret and give inaccurate results. By integrating the Sharpe ratio, along with M-squared and the Sortino ratio, the results of the performance measures gave a broader picture allowing for a righteous and comprehensive performance evaluation. By applying multiple measures, the possibility of applying these to each asset class and strategy and foreseeing differences among the investment vehicles is given to derive relative performance. Integrating the M-squared measure allowed for a more straightforward interpretation of the risk-adjusted performance. The M-squared, expressed in percentage terms, provides the most justifiable return adjusted for risk to be used for any given financial asset, as stressed by Scholz and Wilkens (2005). Additionally, the Sortino ratio was applied to evaluate performance as it only focuses on downside risk i.e. when deviation falls below the rate of risk-free interest. This measure helps to evaluate risk-adjusted performance of the included funds, with only bearing downside risk in mind and acknowledging standard deviation not only as something negative. When applying these measures, the free rate was integrated to quantify the return that is bearing. The measures are calculated on an annual basis to identify fluctuations in the adjusted performance of all funds. In calculating performance measures annually, the risk-free rate was signified by the year US Governmental bond as counterpart to the one-year performance measurements. The risk-adjusted performance was also measured for the entire ten-year period, which accounted for a different risk-free interest rate equivalent to 2.41 per cent, signified by the ten-year US Governmental bond (Bloomberg, 2017).
21
The standard deviation generated monthly from the NAVs was annualized by calculating the standard deviation over each year respectively, multiplied by the square root of 12.
When obtaining annual returns to provide an accurate return for each year for all fund categories, with the respect to changes in value, the accumulated return for each year was used. The accumulated return was obtained by dividing the end value of each year by the beginning value minus one. The return of each year illustrated the actual return for each fund category and better portray the risk-adjusted performance over the period. The risk-adjusted performance was also calculated for the entire period by taking the end value of the ten-year period and divide with the beginning value. The standard deviation for each fund category was also calculated over the entire ten-year period, to measure the performance over the longer time horizon, by multiplying with the monthly number of observations equal to 119. The Sharpe ratio was calculated for all fund categories annually by taking the accumulated return subtracting the risk-free rate and dividing by the standard deviation for each year. The same principle was used for the measures signifying the entire period with the difference in using the accumulated ten-year return, subtracting the ten-year risk free rate, divided by the ten-year standard deviation. The applied formula for the Sharpe ratio is illustrated in equation 1.
The M-squared ratio was calculated on an annual basis with accumulated returns and standard deviation for respective periods. Integrating the S&P 500 enabled the comparison of hedge and equity mutual funds by using an equivalent deviation as a common denominator to measure what return to be expected if hedge and equity mutual funds possessed the deviation of the benchmark index. The M-squared was calculated annually by applying the risk premium multiplied with the ratio of the market standard deviation divided with the
standard deviation of fund category 𝑖, lastly adding the risk-free rate. The applied formula for
the M-squared measure is illustrated in equation 2.
The Sortino ratio integrates the downside deviation to only consider the volatility that is viewed as harmful. The risk-free rate of a one-year US governmental Bond was applied as the minimum acceptable return and the deviation below this level was deemed downside deviation. The accumulated return for each fund category and its standard deviation below the monthly risk-free rate was applied to obtain the risk-adjusted return to harmful volatility.
22
The accumulated return subtracting the risk-free rate for each year was divided with the downside deviation for each year respectively. The measure was also calculated for the entire ten-year period by applying the same principles. The formula applied is demonstrated in equation 3.
4.2.2 Quantifying Alpha Through Multi-Factor Models
To be consistent with previous research, it has been determined that the use of the Fama-French three-factor model fits best in explaining and measuring excess returns. The foremost reason being the ten-year period applied in this study. The indications of persistence in returns found by Grinblat and Titman (1992) are weak and determines that, when evaluating funds over a longer period, the explanatory power of using a momentum factor arguably does not contribute. Additionally, the argument for using the three-factor model strengthens with Grinblat and Titman (1992) attributing the indications of persistence in funds returns not to momentum, but to the information strength of historical data and individually successful stock picking. An implication highly vital when considering hedge funds is the fact that such funds apply more flexible strategies and thus making short-term investments a greater emphasis in the asset allocation. Arguably, in such an environment, a momentum factor is of less relevance (National Association of Pension Funds, 2005).
The variable 𝑅𝑚− 𝑅𝑓 is defined as the excess return of the market derived from a value
weight portfolio consisting of all firms noted on the New York stock exchange (NYSE),
NASDAQ or AMEX subtracting the risk-free interest rate defined by the one month
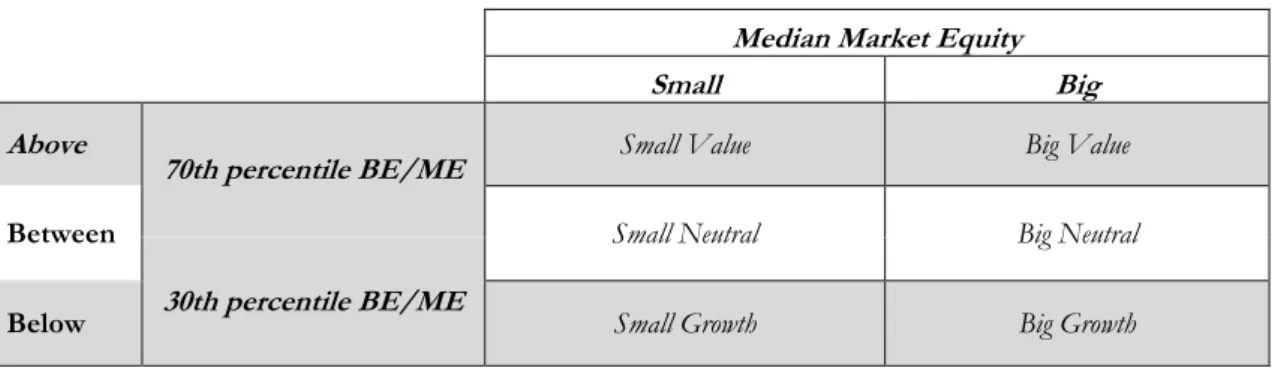
Treasury bill rate. To make estimations on the size variable and book-to-market variable used, a combination of six portfolios based on size and book-to-market ratios were constructed for all stocks noted on the NYSE, NASDAQ or AMEX. Firstly, individual stocks were split into two groups, divided at the median in terms of market equity. The group clustered below the median consists of the returns for all stocks with smaller market equity values and firms above the median high market equity. These two groups are subsequently
split depending on book-to-market ratio separated at the 70th and 30th percentile. Firms above
the 70th percentile are denoted small value or big value, depending on the individual firms’
market equity measure, firms between the two percentiles denoted small neutral or big
neutral and firms below the 30th percentile are denoted small growth or big growth. The six
23
stocks, big value stocks, big neutral stocks and big growth stocks. The portfolio constructing is illustrated in figure 4.2a.
Figure 4.2a Fama-French Portfolio Construction
Median Market Equity
Small Big
Above
70th percentile BE/ME Small Value Big Value
Between Small Neutral Big Neutral
30th percentile BE/ME
Below Small Growth Big Growth
By averaging returns from June at year 𝑡 to June year 𝑡 + 1 of each portfolio, the factor SMB
is defined as:
𝑆𝑀𝐵 =1
3(𝑅𝑠𝑚𝑎𝑙𝑙 𝑣𝑎𝑙𝑢𝑒+ 𝑅𝑠𝑚𝑎𝑙𝑙 𝑛𝑒𝑢𝑡𝑟𝑎𝑙+ 𝑅𝑠𝑚𝑎𝑙𝑙 𝑔𝑟𝑜𝑤𝑡ℎ) −
1
3(𝑅𝑏𝑖𝑔 𝑣𝑎𝑙𝑢𝑒+ 𝑅𝑏𝑖𝑔 𝑛𝑒𝑢𝑡𝑟𝑎𝑙+ 𝑅𝑏𝑖𝑔 𝑔𝑟𝑜𝑤𝑡ℎ)
and factor HML to be defined as:
𝐻𝑀𝐿 = 1
2 (𝑅𝑠𝑚𝑎𝑙𝑙 𝑣𝑎𝑙𝑢𝑒+ 𝑅𝑏𝑖𝑔 𝑣𝑎𝑙𝑢𝑒) − 1
2(𝑅𝑠𝑚𝑎𝑙𝑙 𝑔𝑟𝑜𝑤𝑡ℎ+ 𝑅𝑏𝑖𝑔 𝑔𝑟𝑜𝑤𝑡ℎ).
SMB measures the average return of small versus big stocks with similar market capitalization whereas HML measures returns of firms equal in size yet different in book-to-market ratios. Thus, SMB is meant to act as the risk factor related to firm size while HML is meant to act as the risk factor associated with book-to-market ratios (Fama & French, 1992a). The
coefficients denoted 𝑠𝑖 and ℎ𝑖 were derived when running the multiple linear regressions and
reflects, like beta, sentiveness of the variables SMB and HML to the markets.
To calculate and measure historical excess returns for the different types of funds, multiple time series regressions have been conducted. The regressions measure, adjusted for risk using Fama and French’s three factors, excess returns that one can expect from investing in hedge and equity mutual funds. The excess returns are illustrated as the relative performance of a certain asset or groups of assets to a benchmark index and is denoted in relative terms. Thus, excess returns signify how much better or worse an asset performs compared to market
24
measures adjusted for risk and can be derived as the intercept of the multiple linear regressions. The excess returns i.e. intercept of regressions is denoted alpha (𝛼) throughout this study.
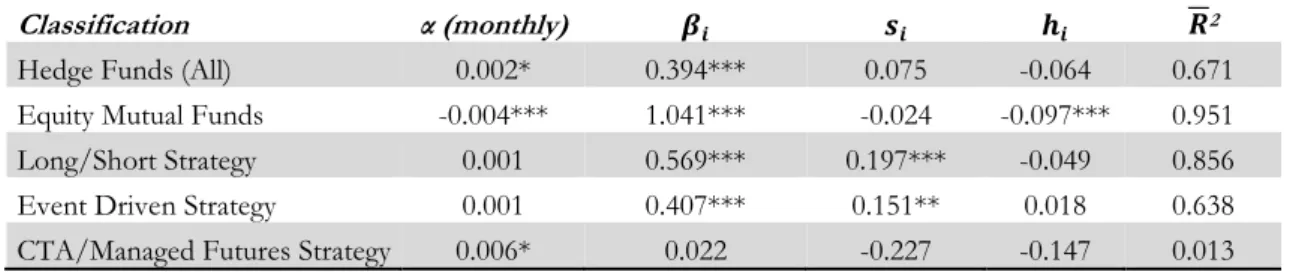
Firstly, a multiple time-series regression was performed over the entire period to provide monthly alphas for respective subsets of the data i.e. hedge funds, hedge fund strategies and equity mutual funds. This was done to obtain expectations of what investors can receive from portfolios consisting of respective fund category. To have all funds part of the dataset contributing equally to the returns used as predictor variables, five equally weighted portfolios have been constructed based on each fund category. The equally weighted portfolios are used to reflect characteristics of different assets categories (MSCI, 2017). One has been created for equity mutual funds, one for hedge funds and one for each type of hedge fund strategy, respectively. This allowed for using the returns of the equally weighted portfolios to be used as dependant variables when running five different multiple linear regressions. The independent variables used throughout are the risk factors in terms of market risk, size and book-to-market ratios. This approach allowed to derive monthly alphas for each type of investment and investment strategy throughout the entire period of ten years. This provided valuable inputs on how the performance of hedge funds differ with what kind of strategies respective funds apply. The model constructed for the regression is illustrated in equation 4.
𝑅𝑖,𝑡− 𝑅𝑓,𝑡= 𝛼𝑖+ 𝛽𝑖(𝑅𝑚,𝑡− 𝑅𝑓,𝑡) + 𝑠𝑖𝑆𝑀𝐵𝑡+ ℎ𝑖𝐻𝑀𝐿𝑡+ 𝜖𝑖,𝑡 (4)
Monthly returns were used in the time-series regressions. The regression was performed five times, one for each equally weighted portfolio i.e. equity mutual funds, all hedge funds and for each respective hedge fund strategy. The model provides alpha of each fund category,
where 𝑟𝑖,𝑡is denoted as the return for any fund category denoted 𝑖 at month 𝑡. 𝑅𝑓𝑡 denotes
the risk-free rate for month 𝑡, which is represented by the one-month US Treasury bill rate.
In the case for this study, monthly alphas will be presented for each fund category and
applicable strategies. The slope coefficients, 𝛽𝑖, 𝑠𝑖 and ℎ𝑖, for each individual risk proxy will
therefore illustrate the effect the risk proxies have on the monthly alphas. This model construction measures alpha over the entire period for each dependent variable as done by Fama and French (2010).
25
An additional approach was to perform individual regressions for each equity mutual fund to be able to create a deeper understanding and to be able to identify patterns on equity
mutual fund performance. This was conducted to be able to make similar analysis on
investment strategies and distribution of returns for equity mutual funds, a procedure already applied to hedge funds i.e. long/short, event driven and CTA/managed futures. To satisfy for running regressions using 170 different fund returns as dependent variables, a syntax code was written to run regressions simultaneously. Constructing the regressions this way allowed to run regressions with respective fund returns as dependent variables while keeping the Fama-French factors used as independent variables constant. This method of constructing regressions collectively for all funds gives exact parameter estimates and the regression equation used is that presented in equation 4. The construction of individual regressions generates individual monthly excess returns for each fund that allows for interpreting and identifying investment patterns and the range of alphas provided by equity mutual funds.
All dependent variables used throughout the regressions are continuous monthly returns calculated using funds’ net asset values and thus the monthly alphas obtained through regressions are net of all fees and costs. To present the obtained monthly alphas from the regressions in a more transparent way, the alphas have been annualized to better interpret the performance of each fund category.
𝐴𝑛𝑛𝑢𝑎𝑙𝑖𝑧𝑒𝑑 𝛼 = (1 + 𝛼𝑚𝑜𝑛𝑡ℎ𝑙𝑦)12− 1 (5)
The annualized numbers, derived from the monthly alphas, is only used for demonstrative purposes (Evestment, 2017). The annualized numbers are not results from the regressions and can therefore not be used to draw any conclusions regarding its statistical significance.
4.2.3 Limitations of Chosen Methods and Theories
When assessing attached risks and performance of investments, investors commonly integrate risk and performance measures to quantify the relativeness to find the best investment. Applying risk-adjusted measures and models to evaluate performance enables investors to obtain an indication of what to expect, based on historical data, which does not guarantee a certainty for the future. The implication of events in the society on the financial
26
markets is another limitation of these measures that is not included in the outcome of the measures and models. Therefore, the importance of being aware of these limitations is vital when applying theory to measure risk and performance for the future in finance (Coleman & Litterman, 2012).
When calculating risk-adjusted performance in this study on hedge and equity mutual funds, the integration of the Sortino Ratio and M-squared enabled the procedure of comparing relativeness of the investment vehicles. Therefore, the investor has the advantage with the risk-adjusted performance measures to being able to rank the investments to obtain the best choice with the applied measure. A negative note on risk-adjusted performance measure is that sometimes these measures might not provide consistency in the obtained result. Comparing and ranking investments based on independent measures might provide investors with inconsistency in information. Therefore, the application of each measure separately in this study might provide inaccuracy in the results, but by integrating the measures together, this limitation of the risk-adjusted performance measure can be reduced. In the assessment of performance of hedge and equity mutual funds, the Fama-French three-factor model is applied. The widely-used model for calculating the excess return on investments provides an indication of what to expect. Even though, the model provides an indication, it is not a certainty in the obtained numbers. In the original report by Fama and French (1992a), they concluded that the model could explain 90 per cent of the variability in assets. The implication is that the obtained result when applying their model is that the result cannot provide certainty in the explanation of the variability in different assets. The outcome by applying the model on hedge and equity mutual funds cannot guarantee full accuracy, which is important to have in mind. Another debated issue with the model emphasizes the lack of evidence in the importance of size. The work assumes that smaller firms are generally have a lower valuation since these are not part of the portfolios of larger banks and other financial institutions. This also questions the correlation between the size of a firm and its returns (Black, 1993).
The results in this study will be based on financial models and theory and aims to provide indications of what to expect from hedge and equity mutual funds when assessing risk and performance.
27
5 Empirical Results
In the following chapter of the thesis, the empirical results of the time-series regression and measurements calculations are presented. The measures are displayed separately in a time-series fashion while regression outputs are firstly illustrated in terms of asset type and asset strategy and lastly, individual alphas are presented.
5.1 Fund Performance by Category
The assessment of performance and attached risks of hedge and equity mutual funds is performed by quantifying the accumulated returns along with the risk-adjusted performance. Over the sample period 2007-2017, the different asset classes provide an indication of what to expect from each type of investment for future purposes. The obtained results emphasize the expectations for future decisions when investing in each type of investment. Findings in previous research conducted by Liang (1999) emphasized the outperformance of hedge funds over mutual funds. The obtained results present consistency with previous research and over the examined period, hedge funds outperformed mutual funds. Over the entire ten-year period, hedge funds managed to deliver superior results overall and indicated less downside risk to downturns in the financial markets.
In figure 5.1, illustrated below, the accumulated return of each asset class is demonstrated. The respective performance of each asset class is put in relation to the S&P 500 benchmark. Over the entire sample period the performance among the different funds revealed an outperformance of the hedge funds over equity mutual funds. An important point is the poor performance of equity mutual funds that can be observed during 2007-2008, a period signified by financial crisis. The downfall in performance by equity mutual funds can also be observed in the S&P 500 index. The same pattern can be seen in the 2011 downfall in the stock market, equity mutual funds and the S&P 500 experienced downturns, while hedge funds tended to be more resilient to such an event. A more robust performance during these periods can be seen in hedge funds, especially in the hedge fund strategy CTA/managed futures, which experienced an increase in value during the same time. Observing the graph, it is evident that equity mutual funds tend to be more volatile over the entire period, despite underperforming hedge funds during the same period.