CESIS Electronic Working Paper Series
Paper No. 454
Access to financial intermediaries and external capital
acquisition
Mikaela Backman
Tina Wallin
April, 2017
The Royal Institute of technology Centre of Excellence for Science and Innovation Studies (CESIS) http://www.cesis.se
1
Access to financial intermediaries and external capital acquisition
Mikaela Backman & Tina Wallin
1Centre for Entrepreneurship and Spatial Economics (CEnSE), Jönköping International Business School, Jönköping, Sweden
E-mail: mikaela.backman@ju.se; tina.wallin@ju.se
Abstract: We examine whether low access to financial intermediaries works as an obstacle
acquiring financial capital for Swedish firms by using information from the Community Innovation Survey indicating whether firms perceive the acquisition of external capital to be difficult. This perception is explained by the distance to the firms’ nearest financial intermediaries and their total local supply. The results indicate that the distance to banks is related to a larger problem of obtaining external financial capital in rural areas.
Keywords: financial capital, bank offices, geographical distance, Community Innovation Survey JEL-codes: D53, G21, G23, L25, O31
1 Corresponding author
2
1
Introduction
In this paper, we analyse whether low access to local financial intermediaries increases the problem of acquiring external financial capital. In the EU, banks are by far the most common provider of loans to firms (European Commission, 2011). 1 The same pattern can be observed in
Sweden, which has a financial system that is bank-oriented and founded on relationships between banks and their customers (Avdeitchikova, 2008; Sjögren & Zackrisson, 2005). Most Swedish firms have bank loans; in particular, many small and medium-sized enterprises are reliant on banks for their external financial funding needs (Berggren, Lindström, & Olofsson, 2001). Venture capital is often highlighted as an alternative source but represents only 1.2 percent of the early firms founded in Sweden between 2002-2009 (Söderblom, 2012).
At the same time that banks are the main provider of financial capital to firms, we observe a drastic change in the organisation of the local financial infrastructure. In Sweden, approximately half of the local bank branches closed during the 1990 to 2010 period due to a centralisation of the banking sector; this is a tendency that is particularly prevalent in rural areas. This development is problematic since studies find that access to financial capital is important for both new firm formation (Backman, 2015) and firm-level innovations (B. H. Hall, Moncada-Paternò-Castello, Montresor, & Vezzani, 2016; O'Sullivan, 2005). In addition, studies find that it is the
local financial infrastructure that is important for many firms (Backman, 2015; Cole, 1998; Cole,
Goldberg, & White, 2004; Ferri & Messori, 2000; Fritsch & Schilder, 2008; Lutz, Bender, Achleitner, & Kaserer, 2013; Pollard, 2003). This finding implies that the geographical distance to financial intermediaries is an important factor for firms in their quest for the external financial capital related to their innovative activities.
Using this development as a starting point, our purpose is to analyse how access to financial capital, proxied by the Euclidian distance to bank branches, venture capital and public debt institutions, is related to firms’ perceived difficulties of obtaining external financial capital for their innovation processes. We contribute to the existing literature by testing how the geographical distance to financial intermediaries influences firms’ ability to acquire external capital. This extends the previous findings that financial obstacles impede firms innovative capabilities (Alessandrini, Presbitero, & Zazzaro, 2010; Blanchard, Huiban, Musolesi, & Sevestre, 2013; Canepa & Stoneman, 2008).
We use the Community Innovation Survey (CIS) wave from 2010, which includes a question regarding obstacles to innovation where the firms are requested to rank how large problems they have experienced when acquiring external financial capital. Our hypothesis is that a larger geographical distance to financial intermediaries will be associated with a larger perceived
3
obstacle for the innovation process. This hypothesis is examined using a logit model, where we include the distance to the nearest bank branch, Almi office2, and venture capital firm in addition
to proxies of the regional supply of financial capital as well as firm and regional level controls. The results show that a longer distance to the nearest bank branch is associated with a larger probability of experiencing external capital problems, especially for firms located in rural areas. For firms in the service sector, it is mainly the regional supply of bank branches that appears important, as a larger number of local bank branches is associated with a lower probability of experiencing external capital problems.
The results in this paper show that the access to financial intermediaries imposes a risk for firms to be less innovative, as they report that accessing external finance is an obstacle for innovation, i.e., firms encounter financial constraints. Financial constraints arise when there is a difference between the rate of return required by the owner investing internal funds and the rate of return required by external actors, assuming no externalities in the investment activity. Thus, a firm is financially constrained if the firm is unable to find external capital at the market price (B. Hall, 2002; Hubbard, 1998). If firms encounter financial constraints, and there are insufficient internal funds to cover the innovation investments, this leads to fewer innovation activities than optimal and thus a market failure. As new and more regulations, such as Basel III and MiFID, target the financial sector, the banks’ reduced ability to provide finance leads to a tightened credit supply for small and medium-sized firms. However, as this credit tightening has occurred, the European Commission’s objective is to develop a comprehensive range of financial policies and instruments to support these firms.
This paper is organised as follows. Section 2 presents an overview of why access to financial intermediaries matters to firms and presents a short background description regarding the Swedish financial sector. Section 3 presents the data, variables and the method. Section 4 presents the results from the empirical estimations, and section 5 concludes this paper.
2
Why is geographical proximity to financial intermediaries important?
The statement by J. Schumpeter (1911) that services provided by financial intermediaries are essential for economic growth has been confirmed in numerous studies (Becchetti & Trovato, 2002; Beck, Levine, & Loayza, 2000; Goldsmith, 1969; King & Levine, 1993). In this paper, we argue not only for financial intermediary’s competitive advantage in handling information but also for their importance at the local level.
An economic actor striving to access financial capital must be able to provide sufficient information about the business idea to the investor, as an information asymmetry exists between
4
the agents. This information is often characterised by being tacit, i.e. the knowledge is difficult to communicate to others or record in a document (Udell, 2008). The information is therefore costly for the financial intermediary to acquire since it requires personal meetings and trust often built up by a long-term relationship (Gereffi, Humphrey, & Sturgeon, 2005; Storper & Venables, 2004). Relationship lending, which builds on the acquisition of soft information, is one means by which financial intermediaries can reduce this information gap. Except for the relevant information about the project, this information gap includes other tacit information about the borrower himself, such as personal characteristics and previous activities. The acquisition of soft information is usually done through interaction with the borrower, through other financial services (Boot, 2000; Elsas & Krahnen, 1998). Soft information is easier to convey over short distances, which implies that regional or local financial institutions matter particularly for firms that are more dependent on this type of information.
Despite improved communication and technology processes, such as internet-banking, which allows for longer distances between lenders and borrowers, it has been found that banks remain dependent upon personal relationships (Boot & Marinč, 2008; Petersen & Rajan, 2002). A close relationship and a closer geographical proximity between the bank and the borrower also facilitate monitoring and screening activities (Boot, 2000). Another reason why a close proximity between the lender and borrower is important is that the financial intermediary in this case has access to knowledge about the local market (Hayek, 1945). Pollard (2003) stresses two possible explanations for why local knowledge is important: (i) the proximity between borrowers and lenders may increase the knowledge about the local firms and their owners, hence reducing the asymmetric information; and (ii) financial intermediaries can benefit from being well acquainted with the local economic conditions, which can be incorporated when deciding whether to grant the proposal.
The spatial reach for banking services that require personal relationships is thus limited, which means that firms are dependent on the local financial infrastructure to access external capital (Berger et al., 1999; Kwast, 1999; Collender and Shaffer, 2003). Several studies also find that financial intermediaries such as banks, business angels, and venture capitalists prefer to invest within a close geographical context (Cole, 1998; Cole et al., 2004; Ferri & Messori, 2000; Fritsch & Schilder, 2008; Lutz et al., 2013)..
Having a close geographical proximity to many financial intermediaries also signals the level of competition. There are ambiguous findings regarding whether competition within the financial sector is beneficial or not for the remainder of the economy. Some advocate that increased market power reduces the equilibrium amount of credit and increases the interest rate for borrowers (Beck, Demirguc-Kunt, & Maksimovic, 2004; Berger, Demsetz, & Strahan, 1999; Degryse &
5
Ongena, 2005; Dinc, 2000; Gilbert, 1984; Sharpe, 1990). Others argue that some level of market power is needed for a bank to establish a fruitful lending relationship (Petersen & Rajan, 1995). Meaning that the interest rates can be smoothed over time to allow new firms to initially get a subsidised rate for which the bank can be compensated later in the relationship (Boot & Marinč, 2008).
2.1 The case of innovation
The importance of financial capital as an input in the innovation process has been verified by several scholars (Lundvall, 1992; Nelson & Winter, 1982; J. Schumpeter, 1939; J. A. Schumpeter, 1934). Despite the critical role of financial capital and the inclusion of it in major contributions within the innovation literature, O'Sullivan (2005) claims that research largely ignores the role of financial intermediaries. Financial capital supports firms in their innovative processes by means of investing in machines, knowledge, and changing routines. The importance of financial capital for innovations stems from the uncertain nature of the innovation process (B. Hall, 2002). Firms spend time and effort developing and idea, either through formal R&D activities or through regular operations. To cover the costs of these risky investments, firms need to be able to appropriate monopoly rents in those cases where the innovation is successful (Aghion & Howitt, 1992; J. A. Schumpeter, 1934). This statement implies that, with non-commercialised innovation, the firm does not know whether it will be successful, and potential profit streams have not been realised. Hence, other financial resources are needed to fund the actual process. If the innovation process was predictable, and investors could make correct estimates about the return on their investments, it would not be difficult to attract investors and receive financial capital for profitable innovations. However, as the innovation process exacerbates elements of uncertainty, which creates information asymmetries, investors have problems identifying the actual risk and thus may choose not to become involved (B. H. Hall et al., 2016).
Canepa and Stoneman (2008) analyse the relationship between financial constraints and innovative activities by using CIS data for British firms. They find that low access to finance is a factors that decrease the innovative probability in firms. Similar studies have been conducted on CIS data in other countries such as Netherlands (Mohnen, Palm, van der Loeff, & Tiwari, 2008), France (Blanchard et al., 2013), and Italy (Alessandrini et al., 2010). They all support the finding that financial obstacles hamper firms’ innovation activities. Lööf and Nabavi (2016) analyse how financing constraints relate to patent applications and new export products for Swedish firms. They conclude that financial constraints have a negative relationship with patent applications in
6
high-tech firms, regardless of the business cycle. Based on the discussion and findings in previous studies, we formularise the following hypothesis:
Hypothesis: Limited access to financial capital, proxied by the geographical distance, creates an innovation hindrance.
2.2 The Swedish financial sector
The Swedish financial system has been characterised by a strong bank orientation3 that is heavily
based on relationships (Avdeitchikova, 2008; Sjögren & Zackrisson, 2005). However, Stenfors (2014) claims that the rapid deregulation of the financial sector in the 1980s and 1990s have placed Sweden in between the typical dichotomy of bank-centred versus market-centred. The tax system was also reformed during this period, and debt is less favoured than previously (Månsson & Landström, 2006). However, a recent report by Företagarna (2015) highlights banks as the most important external source of capital, whereas a report by Söderblom and Samuelsson (2014) highlights public debt and grants as the most important external sources of capital. However, the researchers make the noteworthy statement that many of the innovative start-ups they examine have attempted to obtain bank loans but were rejected.
The number of bank branches has declined drastically over the last two decades. In total, nearly half of the bank branches have disappeared, but the largest difference has been observed in rural municipalities, where approximately half of the bank branches have closed during this period For urban locations, the change in the number of bank branches has been less drastic. The same pattern is also confirmed by weighting the number of bank branches by the population in the respective regions.
Venture capital firms are mainly concentrated in the two largest metropolitan regions in Sweden: Stockholm and Gothenburg; the Swedish Venture Capital Association has approximately 80 percent of its members here (Berggren & Silver, 2010). Several reports about the Swedish market confirms that this type of capital is not frequently used (Företagarna, 2015; Söderblom, 2012; Söderblom & Samuelsson, 2014). This view is reinforced by the Global Entrepreneurship Monitor (GEM), which notes that only a few super-star firms manage to acquire venture capital. Of the 100 000 firms examined, only 37 had actually received venture capital (GEM, 2003). Another actor in the financial sector is the informal venture capitalists or business angels. These angels are wealthy individuals who decide to invest in firms with which they have no family connections. These individuals tend be active investors, as with venture capital firms, but they usually invest lower sums, exit later, invest their own money rather than someone else’s, and invest locally (Harrison & Mason, 1992; Riding, 2008). Avdeitchikova (2008) estimates that the
7
amount of capital provided in Sweden by business angels is approximately the same as the capital provided by the venture capital firms. Identifying and locating business angels is a problem, as they often are very private (Riding, 2008).
In addition to the private actors in the Swedish financial market, there is the state-owned organisation, Almi, which is the largest supplier of public debt (Söderblom, 2012). Almi is responsible for the government's incubator program and has approximately 40 locations all over Sweden. Almi provides loans, venture capital, and advisory functions to both start-ups and established firms (Almi, 2016).
3
Data, variables and method
Several data bases are combined to provide information about the innovation obstacles of the firms, access to financial intermediaries, firm information and information about the regions where the firms are located. Most of the data used in this paper are collected by Statistics Sweden and have restricted public access.
To identify innovative and non-innovative firms, we use the 2010 wave of CIS. The CIS is based on a harmonized survey that is compiled by Eurostat and is conducted in Sweden by Statistics Sweden on a two-year frequency. Hence, by using the CIS from 2010, the firms report innovative activities from 2008 to 2010. An advantage of this survey is the broad view on the concept of being innovative. The product and/or process is not required to be new to the market to be classified as being an innovation; it is sufficient that it is new to the firm. A disadvantage with using this data is that the survey is only sent to firms with at least ten employees. There is also a limitation as to which sectors are included in the survey.4 The firms are stratified based on size
and sector, where all firms with at least 250 employees are included, and those with 10-249 employees are included based on a random draw.
In contrast to previous waves, the 2010 wave of CIS included a question regarding hindrances for innovation. Consequently, we are restricted to use only one wave of the CIS survey to measure the obstacles for innovation. This wave includes a total of 4552 firms. However, as the localisation of the firms is important for our hypotheses, it becomes problematic to include multi-establishment firms, i.e., firms that have more than one multi-establishment (approximately a third of the firms). These firms are excluded unless we can observe that the firm consists of one large establishment where a vast majority of all employees are located and where the additional establishments have only 1-2 employees each, presumably sales offices. In this way, approximately 130 firms were kept in the data set together with the approximately 3200
single-8
establishment firms. We also limit the data set to contain only private firms by excluding firms owned by the state, counties, and municipalities.5 To access detailed information about the firms,
we use employee-employer matched data from Statistics Sweden. The data for the financial intermediaries are collected from Statistics Sweden for banks and for venture capital firms and from Almi for the public debt institutions.
3.1 Variables
3.1.1 Dependent variable
To test the hypothesis regarding whether the access to financial intermediaries relates to creating a hindrance for innovation in firms, we use a question from the CIS about obstacles for the innovation process. One of the obstacles included was “lack of financial capital from sources external to the firm” (Statistics Sweden, 2012, p. 114). The question asks the firms to indicate on a scale from 0 to 3 how large the problem of attracting external financial capital was during the 2008-2010 period, where 0 indicates no problem at all, and 3 indicates a large problem.
3.1.2 Access to financial intermediaries
As the dependent variable covers the 2008-2010 period, we use independent variables from 2007 to measure the situation before the period examined by the survey. The banks are identified by the NACE rev. 2 codes, which contains “other monetary intermediation” firms. The Euclidean distance is calculated between the coordinates of each bank branch present in the data and the coordinates of each firm in the CIS data. The minimum distance in kilometres is then used as the variable measures distance to the nearest bank branch.
We also include a measure of the regional supply of the banks by including number of bank
branches. If there are several institutions in a region, being declined financial capital from one
may not be as devastating since there are others nearby one could approach without the search cost increasing heavily. This variable also works as a proxy for regional size, as larger regions have more bank branches.6
The address for the Almi offices was identified based on information on its webpage and previous yearly reports.7 The coordinates were manually obtained and used to find the Euclidean
distance to them from the firms in the CIS data. The minimum distance in kilometres is used as the variable measures distance to the nearest Almi office.
Venture capital firms were identified by industry classification, which contains “activities of investment companies and venture capital companies”. The Euclidean distance between the venture capital firm and the firms in the CIS data is used to find the minimum distance in kilometres to the nearest venture capital firm. 8
9
3.1.3 Control variables
What banks and other financial intermediaries are attempting to establish, either with soft information or hard information from financial statements, is whether the firm is likely to be able to repay its loan. Any financial (hard) information available should facilitate the decision and is relevant to include in our model (Berger & Udell, 2006; Uchida, 2011). Hence, the first firm level variables we include represent two types of financial information: (i) Operating margin and (ii) total capital per employee. The former can be considered a flow and is equivalent to the EBIT (earnings before interest and taxes) divided by the turnover, which makes the measure less dependent on size. Hence, a firm with a negative value of the operating margin is running a loss, and a firm with a positive value could use the surplus to support innovative activities. It is important to note that, by definition, the EBIT is the earnings before the firm has been able to add potential interest incomes. The latter can be considered a stock and consists of tangible capital in terms of machinery as well as intangible capital such as patents and trademarks. This variable indicates whether the firm has any possible collateral to use for a loan (Berger & Udell, 2006; Mina, Lahr, & Hughes, 2013; Uchida, 2011). To normalise this variable for the size of the firm, we divide the value by the number of employees. Both the operating margin and the total capital are measured in millions of SEK.
Larger firms have the capability of producing more things, as they tend to have more resources, and they can also take advantage of economies of scale and scope (Cohen & Klepper, 1996; Scherer, 1965). This finding could be useful information for a financial intermediary that is attempting to determine whether a project proposal by the firm is likely to succeed; it could also affect the type of investor that is interested in investing. Consequently, we include the number of employees as a proxy for the firm’s size.
Another useful variable is Age, which can be considered a proxy for the stock of experience existing in a firm. The firm may have tested and attempted many things over the years and know what works and what does not. The firm also has experience and knowledge about its industry as well as the region in which it operates (Balasubramanian & Lee, 2008; Majocchi, Bacchiocchi, & Mayrhofer, 2005). In addition, a higher age means that a longer history of financial statements is available for the financial intermediary (Gereffi et al., 2005; Storper & Venables, 2004). Unfortunately, the variable age in our data set truncates all firms that were established before 1986 to 1986. Therefore, we transform the truncated continuous variable to a categorical variable: below 5 years old, 5-9 years old, 10-14 years old, and at least 15 years old.
We also control for the ownership structure of the firm. As public firms are previously excluded in the CIS sampling process, there are two possible categories remaining: private Swedish firms and firms that are part of corporate groups. The ownership structure could be an indicator of
10
innovation success, as several studies have found that multinational firms are more innovative than others, possibly because of the intra-organisational knowledge spillovers (Cook, Pandit, Lööf, & Johansson, 2013; Dachs, Ebersberger, & Lööf, 2008; Johansson & Lööf, 2008). From a financial perspective, being owned by another firm could indicate the possibilities of being supported by other parts of the organisation if financial capital is needed. Hence, we include a dummy variable to indicate whether a firm is part of a corporate group.
Exporting firms are often more productive than others; therefore, they manage to sell goods in foreign markets, despite the sunk cost involved (Alessandria & Choi, 2007; Baldwin & Krugman, 1989; Bernard & Jensen, 2004; Bernard & Wagner, 2001; Das, Roberts, & Tybout, 2007). Hence, we include a dummy for exporting status as an indicator of firm productivity and foreign contacts, both of which could be relevant when determining the success of being granted a loan. Lastly, on the firm level, we include Internal human capital to explain the crucial knowledge input used in innovation processes (Thornhill, 2006).
In addition to the firm variables, we include region-specific variables. Regarding region in this case, we refer to municipalities; there are 290 in Sweden. Because financial intermediaries do not have unlimited resources, more firms competing for them should decrease the likelihood for each firm, all else being equal, to receive a loan or an investment. Hence, we include the measure local
establishments per bank; this is measured as the number of establishments in the municipality
divided by the number of bank branches in that municipality. We also control for the wealth of regions by including the variable wage sum per inhabitant.
In addition to including characteristics as independent variables, we split the dataset by type of region and type of industry. The regions we use are i) metropolitan municipalities, ii) urban
municipalities, and iii) rural municipalities. These regions build upon the categorisation used by
Westlund (2011), with the exception that we combine the two rural categories into one due to a low number of observations in the sparsely populated rural areas. As the probability of receiving loans and investments may differ between industries due to their possibility to have collateral, we run separate regressions for manufacturing and services. These two groups contain the majority of the firms, making it unfeasible to use the remaining observations in an “other group”, as the number of observations is low and the firm heterogeneity large.
11
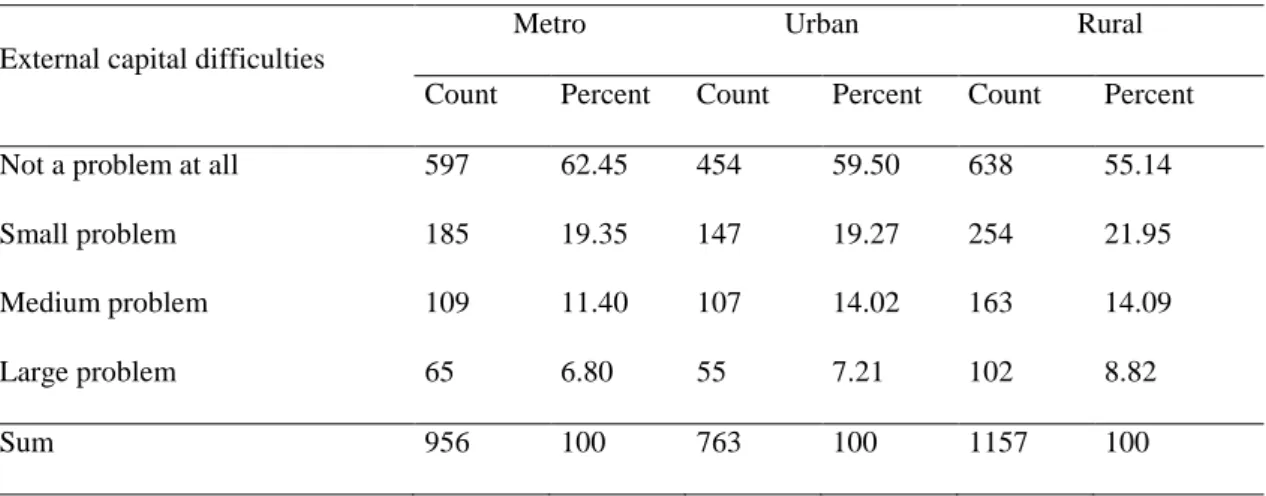
As the dependent variable is constructed on an ordinal scale, the distribution between the alternatives is also interesting; Table 1 displays that distribution. In all types of regions, the median is zero, as at least 50 percent of the firms have reported that they have no problems with acquiring external financial capital. However, changing perspective, this means that approximately 37 percent of the firms in metropolitan areas reported that they do have problems acquiring external financial capital. This figure is slightly higher, 40.5 percent, in urban regions and higher, at nearly 45 percent, in rural areas. The majority of the firms that reported having problems categorise those problems as small or medium, although one in five firms reporting problems in rural areas categorise them as large.
Table 1. Distribution of the dependent variable along the ordinal scale.
External capital difficulties
Metro Urban Rural
Count Percent Count Percent Count Percent Not a problem at all 597 62.45 454 59.50 638 55.14
Small problem 185 19.35 147 19.27 254 21.95
Medium problem 109 11.40 107 14.02 163 14.09
Large problem 65 6.80 55 7.21 102 8.82
Sum 956 100 763 100 1157 100
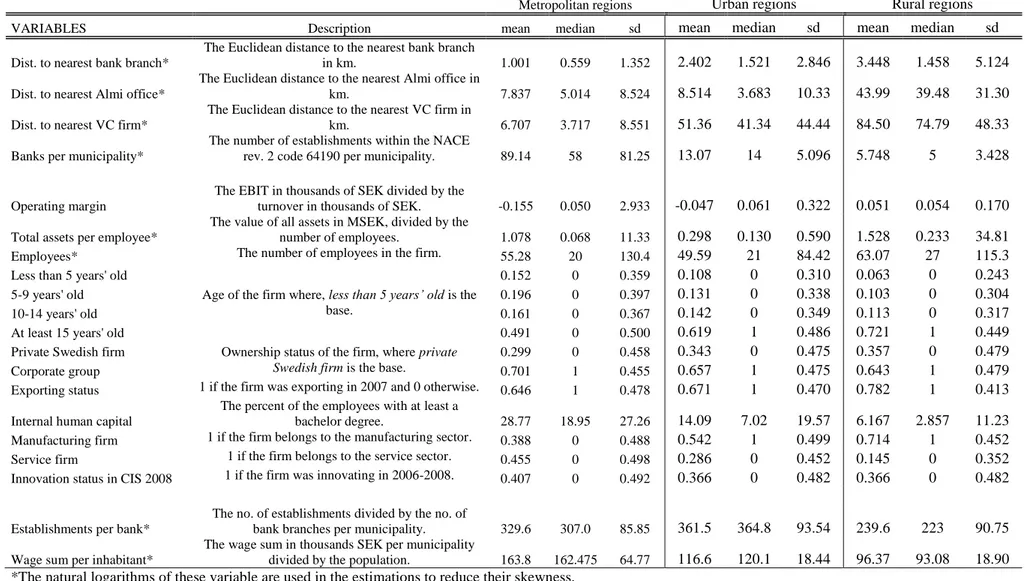
To concur with the split of the dataset by type of region, and to indicate that there are large differences motivating that division, the descriptive statistics for our independent variables are also presented, according to the region type, in Table 2.
In general, firms appear to have the closest distance to bank branches, a longer distance to an Almi office, and the longest distance to a venture capital firm. The exception is the firms in metropolitan areas that are located slightly closer to venture capital firms than to Almi offices. The average distance to the nearest bank branch is similar in all three regions, especially in terms of the median firm’s distance, which is approximately 0.5 km in metropolitan areas and 1.5 km in the remaining categories. Conversely, the distance to the nearest venture capital firm varies much between the different types of regions with the average distance being approximately 7 km, 51 km, and 85 km in the metropolitan, urban, and rural regions, respectively. This finding confirms that banks are evenly distributed and that venture capitalists tend to concentrate in the larger cities. The number of bank branches per municipality is also different in the metropolitan areas
12
Table 2. Descriptive statistics displayed separately for firms located in metropolitan areas, urban areas and rural areas.
Metropolitan regions Urban regions Rural regions
VARIABLES Description mean median sd mean median sd mean median sd
Dist. to nearest bank branch*
The Euclidean distance to the nearest bank branch
in km. 1.001 0.559 1.352 2.402 1.521 2.846 3.448 1.458 5.124
Dist. to nearest Almi office*
The Euclidean distance to the nearest Almi office in
km. 7.837 5.014 8.524 8.514 3.683 10.33 43.99 39.48 31.30
Dist. to nearest VC firm*
The Euclidean distance to the nearest VC firm in
km. 6.707 3.717 8.551 51.36 41.34 44.44 84.50 74.79 48.33
Banks per municipality*
The number of establishments within the NACE
rev. 2 code 64190 per municipality. 89.14 58 81.25 13.07 14 5.096 5.748 5 3.428
Operating margin
The EBIT in thousands of SEK divided by the
turnover in thousands of SEK. -0.155 0.050 2.933 -0.047 0.061 0.322 0.051 0.054 0.170
Total assets per employee*
The value of all assets in MSEK, divided by the
number of employees. 1.078 0.068 11.33 0.298 0.130 0.590 1.528 0.233 34.81
Employees* The number of employees in the firm. 55.28 20 130.4 49.59 21 84.42 63.07 27 115.3
Less than 5 years' old
Age of the firm where, less than 5 years’ old is the base.
0.152 0 0.359 0.108 0 0.310 0.063 0 0.243
5-9 years' old 0.196 0 0.397 0.131 0 0.338 0.103 0 0.304
10-14 years' old 0.161 0 0.367 0.142 0 0.349 0.113 0 0.317
At least 15 years' old 0.491 0 0.500 0.619 1 0.486 0.721 1 0.449
Private Swedish firm Ownership status of the firm, where private Swedish firm is the base.
0.299 0 0.458 0.343 0 0.475 0.357 0 0.479
Corporate group 0.701 1 0.455 0.657 1 0.475 0.643 1 0.479
Exporting status 1 if the firm was exporting in 2007 and 0 otherwise. 0.646 1 0.478 0.671 1 0.470 0.782 1 0.413
Internal human capital
The percent of the employees with at least a
bachelor degree. 28.77 18.95 27.26 14.09 7.02 19.57 6.167 2.857 11.23
Manufacturing firm 1 if the firm belongs to the manufacturing sector. 0.388 0 0.488 0.542 1 0.499 0.714 1 0.452
Service firm 1 if the firm belongs to the service sector. 0.455 0 0.498 0.286 0 0.452 0.145 0 0.352
Innovation status in CIS 2008 1 if the firm was innovating in 2006-2008. 0.407 0 0.492 0.366 0 0.482 0.366 0 0.482
Establishments per bank*
The no. of establishments divided by the no. of
bank branches per municipality. 329.6 307.0 85.85 361.5 364.8 93.54 239.6 223 90.75
Wage sum per inhabitant*
The wage sum in thousands SEK per municipality
divided by the population. 163.8 162.475 64.77 116.6 120.1 18.44 96.37 93.08 18.90
13
compared to the others, with an average of 89 offices compared to 6-13 offices. However, this finding is largely driven by Stockholm, which has the maximum value of 197 offices.
3.3 Method
The dependent variable consists of answers to a survey question whose categories have a natural order for a total of four categories. This type of ordinal information can be used in the estimations via an ordered logit model (Cameron & Trivedi, 2010).
However, one assumption for this model is the proportionality between the thresholds. By performing a Brant test after estimating the regressions, we concluded that the proportionality assumption could not be confirmed (Brant, 1990). In addition, a low percentage of responses in certain categories made the tests unstable. To solve both problems, we transformed the dependent variable into a binary variable, where 0 indicates no problem, and 1 indicates a problem without specifying the degree. The disadvantage of this transformation is the loss of certain information in the data. We observe y taking on the value 0 or 1, as displayed in equation (1).
(1)
With this binary version of the variable, we estimate a logistic regression model instead, where the probability of y being equal to one is displayed in equation (2).
(2) This statement means that F is the cumulative distribution function of the error term, which is logistically distributed for a logit model and normally distributed for a probit model (Cameron & Trivedi, 2010; Greene, 2008). The regression parameters are estimated by maximising the log likelihood function associated with the probability function. Hence, a positive regression parameter means that the variable in question increases the probability of the outcome, y, being one.
In our case, the estimated model is presented in equation (3), where the outcome variable
external capital problems is estimated as a function of a vector of firm-specific variables ( , including the distance to the various financial institutions and region-specific variables ( .
(3)
One problem with survey data, such as the CIS, is that the firms have different probabilities of being selected for participation in their respective strata. If uncorrected, this difference could bias
14
the estimates. To alleviate that problem, we incorporate sample weights in all regressions; these were also provided by Statistics Sweden.
Another problem is endogeneity; as the data set is of a cross-sectional nature, reverse causality is particularly pertinent. To solve that problem, we used independent variables from 2007, which is the year before the 2008-2010 period that was covered by the survey and four years before 2011 when the firms responded to the survey. We also include a wide range of firm characteristics to reduce the problem of unobserved heterogeneity in the data set, as we are unable to extend it to a panel.
4
Empirical Results
The results are presented in Table 3, where all coefficients are displayed as odds ratios; this means that coefficients below 1 indicate a negative relationship with the outcome variable, and values above 1 indicate a positive relationship. The estimations are split according to the three regional categories (Metro, Urban and Rural) and the two industries (Manufacturing and Service).
4.1 Access to financial intermediaries
In metropolitan and urban regions, the distance to the nearest bank does not appear to be important for the perceived difficulties of obtaining financial capital. Thus, we cannot confirm our hypothesis for these regions. This finding also contradicts the result found in previous studies, e.g., Berger et al. (1999), Collender and Shaffer (2003), and Lutz et al. (2013). Conversely, the coefficients for the rural areas indicate that a longer distance to the nearest bank is indeed related to a higher probability to report external capital problems, thus partly confirming our hypothesis by suggesting that relationship lending may be of higher importance in rural areas.
The only significant coefficient for distance to the nearest Almi office is found in metropolitan areas. The value of the coefficient suggests that a closer distance between firms and state-financed capital is related to a higher probability of reporting external financial problems. However, if one remembers that Almi offices tend to be located centrally in the central business district, this finding may not be a specific Almi effect but rather a result of distance to the city centre. As rents are higher in the city centre than in the periphery, firms may find it easier to have sound finances if they are not located in the centre; thus, they have a better financial record to show investors.
15
Table 3. Regression results for external capital problems displayed as odds ratios.
Metropolitan regions Urban regions Rural regions
VARIABLES Manuf. Services Manuf. Services Manuf. Services
Dist. to nearest bank branch 1.842*** 0.783 0.884 1.085 1.141** 1.711***
(0.331) (0.127) (0.108) (0.205) (0.0641) (0.174) Dist. to nearest Almi office 0.745** 0.842** 1.072 1.044 0.945 1.044
(0.097) (0.067) (0.082) (0.100) (0.045) (0.102) Dist. to nearest VC firm 1.277 0.693*** 1.134* 1.326*** 1.044 0.639***
(0.214) (0.082) (0.075) (0.122) (0.068) (0.088) Banks per municipality 1.155** 0.718*** 0.814 1.272 0.951 0.629**
(0.084) (0.043) (0.152) (0.397) (0.089) (0.143)
Operating margin 1.005 1.000 0.460 0.548* 0.365*** 0.306
(0.046) (0.0003) (0.364) (0.241) (0.116) (0.285)
Total assets per employee 0.748 1.385** 1.601 0.540 0.787 1.107
(0.172) (0.219) (0.452) (0.263) (0.132) (0.226) Employees 1.041 1.009 1.265*** 0.849 1.185*** 1.008 (0.080) (0.078) (0.104) (0.124) (0.062) (0.133) 5-9 years old 1.758* 1.155 1.225 1.443 0.688 0.534* (0.543) (0.168) (0.444) (0.381) (0.167) (0.202) 10-14 years old 1.560 0.831 1.389 2.084*** 0.694 0.973 (0.483) (0.147) (0.421) (0.591) (0.161) (0.334)
At least 15 years old 1.924** 0.704** 1.173 0.741 0.469*** 0.476**
(0.525) (0.108) (0.303) (0.198) (0.098) (0.157)
Corporate group 0.742* 1.267** 0.637*** 3.495*** 1.230** 0.896
(0.115) (0.148) (0.097) (0.680) (0.113) (0.197)
Exporting status 1.174 1.733*** 2.715*** 5.615*** 1.994*** 0.964
(0.191) (0.218) (0.439) (1.448) (0.212) (0.213)
Internal human capital 1.286*** 1.148*** 1.017 1.378*** 0.923** 1.006
(0.069) (0.051) (0.058) (0.090) (0.036) (0.074)
Establishments per bank 1.549 1.012 1.092 0.699 1.620*** 1.402
(0.432) (0.293) (0.287) (0.305) (0.177) (0.391)
Wage sum per inhabitant 0.535*** 0.623*** 6.004*** 51.67*** 1.201 0.401*
(0.106) (0.103) (2.937) (59.84) (0.257) (0.207)
Constant 0.166 21.55 2.32e-05*** 1.76e-09*** 0.017*** 42.33
(0.316) (42.13) (5.08e-05) (9.92e-09) (0.021) (117.8)
Observations 351 327 401 189 808 150
Pseudo R2 0.044 0.075 0.076 0.232 0.036 0.091
LR chi2 66.79*** 164.71*** 119.76*** 276.52*** 137.03*** 86.88***
Akaike Information Criterion 1500.314 2070.166 1486.938 949.251 3667.691 901.120
Mean VIF 2.28 1.80 1.71 1.70 1.59 1.54
se in parentheses, *** p<0.01, ** p<0.05, * p<0.1
16
Varied results are also observed for the distance to the nearest venture capital firm. In urban regions, the odds ratios suggest that a shorter distance to venture capital is beneficial, such as the odds ratios observed for distance to the nearest bank in rural areas. For service firms located in metropolitan and rural areas, the probability of experiencing external capital problems is higher for firms located closer to the venture capital firms. In the metropolitan areas, this finding could partly be explained by the same logic as the negative relation between the distance to nearest Almi office and the external capital problems. In the rural areas, we are suggesting that this finding could be a consequence of the very uneven distribution of the venture capital firms. In 2007, there were five venture capital firms located in 197 rural areas. Alternatively, in other terms, approximately 8 percent of the venture capital was located in 68 percent of Sweden’s regions. Hence, there may be other financial institutions that matter in these regions that the firms may benefit from more, such as banks. Therefore, a long distance to the venture capital firm may be beneficial.
The last financial variable is the number of banks in the region. For service firms in general, a higher number of banks in the region or a larger regional supply of financial capital, is associated with a lower probability of the firms reporting external capital problems. The results for manufacturing firms in metropolitan areas suggests the opposite, which could be explained by land prices. The central municipalities have a larger number of banks than the more peripheral ones in metropolitan areas; in addition, as a manufacturing firm, one would not want to be located in the most central areas due to the land prices and the physical size of the firm.
4.2
Control variables
Regarding the financial information of the firms, the odds ratio for the operating margin indicates a negative relationship with the probability of experiencing external capital problems when significantly different from one, confirming previous studies (Berger & Udell, 2006; Mina et al., 2013; Uchida, 2011). Conversely, the total assets per employee is, with one exception, not related to the external capital problems. The exception is service firms in metropolitan areas, where the odds ratio indicates a positive relation; the more assets, the higher the probability of experiencing external capital problems. This finding is possibly a result of tangible capital, as opposed to intangible capital, being useful as collateral. Hence, having intangible assets implies that resources are available yet restricted and cannot be used as collateral.
The remaining firm characteristics show a mixed picture. There appears to be an urban-rural divide where firm age in urban and metropolitan areas appears to be positively associated with external capital problems and negatively so in rural areas. The results for the rural firms are in accordance with previous studies, such as Mina et al. (2013) and Balasubramanian and Lee
17
(2008), who suggest that experience and financial track records increase with age. The findings for metropolitan and urban firms could, to an extent, be driven by lock-in effects, but that does not appear plausible for whole sectors.
Being part of a corporate group is positively related to external capital problems for some samples and negative for others, indicating that no general conclusion can be derived. Exporting status is consistently positively related to external capital problems, suggesting that investors do not regard involvement as a positive sign of productivity. A possible reason for this is offered by Mina et al. (2013), who suggest that being involved in international markets could lead to decreased transparency of the firm’s operations and increased agency problems and thus discourage investments. The last firm-specific variable is internal human capital, which, in most cases, is positively related to external capital problems. This variable suggests that more highly educated employees increase the probability of experiencing problems, which is in accordance with Mina et al. (2013).
The odds ratio for the first region-specific variable suggests that manufacturing firms located in areas where the ratio of establishments per bank branch is high have larger problems of acquiring external capital, possibly due to larger competition for the region’s financial supply. The odds ratio for the second, the regional wealth, indicates that firms located in wealthier rural and metropolitan regions are less likely to experience external capital problems. This finding could be due to a larger regional supply; however, this does not hold in urban regions, where the opposite is observed.
4.3 Sensitivity analysis
One factor that is not considered in our model is previous innovative behaviour, which could be relevant as the firms in the CIS survey have reported whether they have financial constraints hindering their innovation processes. In addition, many studies have concluded that firms that have innovated processes learn from those processes and use their accumulated knowledge to generate future innovations (Geroski, Van Reenen, & Walters, 1997; Malerba, Orsenigo, & Peretto, 1997; Roper & Hewitt-Dundas, 2008). The problem in the CIS data is that all questions are asked during the same period, but we want to know their past behaviour. To remedy that problem, we add information from the previous CIS survey covering the 2006-2008 period. The disadvantage with adding this information, and the reason we opted for not using this as our main model, is that we lose 30-51 percent of the sample. The largest losses are in the urban and rural service sectors, where over half of the observations disappear. Nevertheless, we add the information as a robustness check; the results are presented in Table 4.
18
In most cases, the results regarding the access to financial capital are the same in this model, particularly for the bank-related variables. The largest difference is observed for the age variables, where age is now consistently negatively related to external capital problems. The odds ratio for the previous innovation status consistently shows a positive relationship with external capital problems. This finding contradicts the reasoning that previous success is more likely to induce future success and reduce the perceived risk of investors.
Another potential disadvantage with our main model is that the firms may experience changes in the distance to financial intermediaries during the period the CIS survey covers, as the respondents state how they experienced the whole period from 2008-2010. In those cases where the bank relocates, it is impossible to separate the effect from the distance in 2007 and the changes occurring in the subsequent years. To remedy that problem, we also estimate our model on samples where we have excluded firms that have their nearest bank branch relocating during the 2008-2010 period.
Unfortunately, this exclusion was not possible to do for venture capital firms, as the whole industry was rapidly relocating during this period. Approximately 82 percent of the firms in the data set experienced a change in distance to its nearest venture capital firm. Hence, excluding those firms would result in a loss of most of the sample; instead, we excluded the distance to the nearest venture capital firm from those estimations. These results are also presented in Table 4 and confirm the previous results regarding the access to financial capital, particularly regarding the access to banks. All odds ratios that are significantly different from one indicate that a longer distance to the nearest bank branch is positively associated with the probability of experiencing external capital problems.
19
Table 4. Regression results for the main variables from alternative specifications displayed as odds ratios. 9
Metropolitan regions Urban regions Rural regions
ALTERNATIVE SPECIFICATION VARIABLES Manuf. Services Manuf. Services Manuf. Services
Controlling for previous innovation status in CIS 2008
Dist. to nearest bank branch 2.992*** 0.948 0.607*** 2.317*** 1.271*** 1.664*** (0.677) (0.213) (0.0952) (0.754) (0.0905) (0.266) Dist. to nearest Almi office 0.911 1.184 1.502*** 0.743* 0.874** 1.065
(0.153) (0.138) (0.147) (0.131) (0.0532) (0.185) Dist. to nearest VC firm 1.303 0.449*** 1.091 1.256 1.178** 0.427***
(0.273) (0.0738) (0.0927) (0.248) (0.0948) (0.105)
Banks per municipality 1.151 0.727*** 0.898 0.757 1.103 0.578
(0.110) (0.0603) (0.222) (0.458) (0.126) (0.197)
Observations 242 206 273 91 563 74
Excluding firms whose nearest bank relocated during 2008-2010
Dist. to nearest bank branch 2.663*** 0.788 1.142 1.447* 1.206*** 1.612*** (0.570) (0.143) (0.174) (0.298) (0.0749) (0.178) Dist. to nearest Almi office 0.719*** 0.767*** 1.033 0.855 0.993 0.918
(0.0661) (0.0493) (0.0989) (0.0945) (0.0523) (0.0803) Banks per municipality 1.230** 0.681*** 0.569*** 0.367*** 0.852 0.495***
(0.110) (0.0422) (0.0970) (0.106) (0.0864) (0.121)
20
5
Conclusions
The purpose of this paper is to examine whether the distance to financial intermediaries relates to firms’ perception that attracting external capital is an obstacle to perform innovations. This question is particularly important, as firms may need external capital to finance their innovative activities (Canepa & Stoneman, 2008; B. H. Hall et al., 2016).
We fulfil this purpose by utilising a question regarding external capital difficulties from the 2010 wave of the Community Innovation Survey, covering the 2008-2010 period for Swedish firms. This question was combined with independent variables from 2007, where our main variables of interest were the Euclidean distance to the nearest bank, as well as the change of this distance between 2003 and 2007, the nearest distance to an Almi office, and the nearest distance to a venture capital firm. In addition, we added two regional financial variables, the number of banks in the municipality and the number of establishments per bank in the same municipality, to provide information about the total supply in the region in addition to the distance to one of the available branches.
Our hypothesis that increased distance to financial intermediaries is associated with larger external capital difficulties is generally rejected for venture capital firms and Almi offices. Conversely, the hypothesis is confirmed for banks, particularly in rural areas, where firms appear to be more dependent upon geographical proximity to transfer relevant information. As is shown, the results for firms in the rural areas confirms the hypothesis, and the results for firms in metropolitan and urban areas are more mixed. This finding suggests that one cannot claim that geographical proximity is necessary in general; however, that does not mean that it is unimportant for certain groups or regions.
In summary, it appears that our hypothesis that increased distance to financial intermediaries is associated with larger external capital difficulties is rejected for some types of financial institutions. In general, the hypothesis is confirmed for banks, particularly in rural areas, where firms appear to be more dependent upon a geographical proximity to transfer relevant information. This confirmation partly supports previous studies such as Lutz et al. (2013), Degryse and Ongena (2005), and Fritsch and Schilder (2008). In certain cases, it is not necessarily the distance to the one closest bank that is relevant but the total supply of banks in the municipality, which is in accordance with Degryse and Ongena (2005) and (Beck et al., 2004).
It is important to note is that this study is of a cross-sectional nature; it is therefore difficult to make any causal claims about the effects of the relocation of banks that have been prominent in Sweden during the last two decades. If more waves of the CIS with the question regarding
21
hindrances for innovation activities, as the one used here as a dependent variable, were available, a longitudinal study could be conducted to follow these firms over time. Another interesting means to examine the issue would be to utilise actual firm level investment information, similar to what was done by Mina et al. (2013).
22
References
Aghion, P., & Howitt, P. (1992). 'A Model of Growth through Creative Destruction'.
Econometrica (1986-1998), 60(2), 323.
Alessandria, G., & Choi, H. (2007). 'Do Sunk Costs of Exporting Matter for Net Export Dynamics?'. The Quarterly Journal of Economics, 122(1), 289-336.
Alessandrini, P., Presbitero, A. F., & Zazzaro, A. (2010). 'Bank Size or Distance: What Hampers Innovation Adoption by Smes?'. Journal of Economic Geography, 10(6), 845-881. doi:10.1093/jeg/lbp055
Almi (Producer). (2016, 2016-03-15). Om Almi. [Webpage] Retrieved from
http://www.almi.se/Om-Almi/
Avdeitchikova, S. (2008). 'On the Structure of the Informal Venture Capital Market in Sweden: Developing Investment Roles'. Venture Capital, 10(1), 55-85. doi:10.1080/13691060701605504
Backman, M. (2015). 'Banks and New Firm Formation'. Journal of Small Business and
Enterprise Development, 22(4).
Balasubramanian, N., & Lee, J. (2008). 'Firm Age and Innovation'. Industrial and Corporate
Change, 17(5), 1019-1047. doi:10.1093/icc/dtn028
Baldwin, R., & Krugman, P. (1989). 'Persistent Trade Effects of Large Exchange Rate Shocks'.
The Quarterly Journal of Economics, 104(4), 635-654. doi:10.2307/2937860
Bankföreningen, S. (2010). Banker I Sverige: Faktablad Om Svensk Bankmarknad [in Swedish]. Stockholm: Svenska Bankföreningen.
Becchetti, L., & Trovato, G. (2002). 'The Determinants of Growth for Small and Medium Sized Firms. The Role of the Availability of External Finance'. Small Business Economics,
19(4), 291-306. doi:10.1023/a:1019678429111
Beck, T., Demirguc-Kunt, A., & Maksimovic, V. (2004). 'Bank Competition and Access to Finance: International Evidence'. Journal of Money, Credit, and Banking 36(3), 627-648. Beck, T., Levine, R., & Loayza, N. (2000). 'Finance and the Sources of Growth'. Journal of
Financial Economics, 58(1–2), 261-300. doi: http://dx.doi.org/10.1016/S0304-405X(00)00072-6
Berger, A. N., Demsetz, R. S., & Strahan, P. E. (1999). 'The Consolidation of the Financial Services Industry: Causes, Consequences, and Implications for the Future'. Journal of
Banking & Finance, 23(2–4), 135-194. doi: http://dx.doi.org/10.1016/S0378-4266(98)00125-3
Berger, A. N., & Udell, G. F. (2006). 'A More Complete Conceptual Framework for Sme Finance'. Journal of Banking & Finance, 30(11), 2945-2966. doi:http://dx.doi.org/10.1016/j.jbankfin.2006.05.008
Berggren, B., Lindström, G., & Olofsson, C. (2001). Tillväxt Och Finansiering I Mindre Företag [in Swedish]. In P. Davidsson, F. Delmar, & J. Wiklund (Eds.), Tillväxtföretagen I
Sverige (pp. 250-271). Stockholm: SNS Förlag.
Berggren, B., & Silver, L. (2010). 'Financing Entrepreneurship in Different Regions: The Failure to Decentralise Financing to Regional Centres in Sweden'. Journal of Small Business and
Enterprise Development, 17(2), 230-246. doi:10.1108/14626001011041238
Bernard, A. B., & Jensen, J. B. (2004). 'Why Some Firms Export'. The Review of Economics and
Statistics, 86(2), 561-569.
Bernard, A. B., & Wagner, J. (2001). 'Export Entry and Exit by German Firms'.
Weltwirtschaftliches Archiv, 137(1), 105-123. doi:10.1007/bf02707602
Blanchard, P., Huiban, J.-P., Musolesi, A., & Sevestre, P. (2013). 'Where There Is a Will, There Is a Way? Assessing the Impact of Obstacles to Innovation'. Industrial and Corporate
Change, 22(3), 679-710. doi:10.1093/icc/dts027
Boot, A. W. A. (2000). 'Relationship Banking: What Do We Know?'. Journal of Financial
Intermediation, 9(1), 7-25. doi:http://dx.doi.org/10.1006/jfin.2000.0282
Boot, A. W. A., & Marinč, M. (2008). 'The Evolving Landscape of Banking'. Industrial and
23
Brant, R. (1990). 'Assessing Proportionality in the Proportional Odds Model for Ordinal Logistic Regression'. Biometrics, 46(4), 1171-1178. doi:10.2307/2532457
Cameron, A. C., & Trivedi, P. K. (2010). Microeconometrics Using Stata. College Station: Stata Press.
Canepa, A., & Stoneman, P. (2008). 'Financial Constraints to Innovation in the Uk: Evidence from Cis2 and Cis3'. Oxford Economic Papers, 60(4), 711-730. doi:10.1093/oep/gpm044 Cohen, W. M., & Klepper, S. (1996). 'Firm Size and the Nature of Innovation within Industries: The Case of Process and Product R&D'. The Review of Economics and Statistics, 78(2), 232-243. doi:10.2307/2109925
Cole, R. A. (1998). 'The Importance of Relationships to the Availability of Credit'. Journal of
Banking & Finance, 22(6–8), 959-977. doi: http://dx.doi.org/10.1016/S0378-4266(98)00007-7
Cole, R. A., Goldberg, L. G., & White, L. J. (2004). 'Cookie Cutter Vs. Character: The Micro Structure of Small Business Lending by Large and Small Banks'. Journal of Financial
and Quantitative Analysis, 39(02), 227-251. doi:doi:10.1017/S0022109000003057
Cook, G. A. S., Pandit, N. R., Lööf, H., & Johansson, B. (2013). 'Clustering, Mnes, and Innovation: Who Benefits and How?'. International Journal of the Economics of
Business, 20(2), 203-227.
Dachs, B., Ebersberger, B., & Lööf, H. (2008). 'The Innovative Performance of Foreign-Owned Enterprises in Small Open Economies'. The Journal of Technology Transfer, 33(4), 393-406. doi:10.1007/s10961-007-9058-7
Das, S., Roberts, M. J., & Tybout, J. R. (2007). 'Market Entry Costs, Producer Heterogeneity, and Export Dynamics'. Econometrica, 75(3), 837-873. doi:10.1111/j.1468-0262.2007.00769.x
Degryse, H., & Ongena, S. (2005). 'Distance, Lending Relationships, and Competition'. The
Journal of Finance, 60(1), 231-266. doi:10.1111/j.1540-6261.2005.00729.x
Dinc, I. S. (2000). 'Bank Reputation, Bank Commitment, and the Effects of Competition in Credit Markets'. Review of Financial Studies, 13(3), 781-812. doi:10.1093/rfs/13.3.781
Elsas, R., & Krahnen, J. P. (1998). 'Is Relationship Lending Special? Evidence from Credit-File Data in Germany'. Journal of Banking & Finance, 22(10–11), 1283-1316. doi:http://dx.doi.org/10.1016/S0378-4266(98)00063-6
European Commission, E. (2011). Smes' Access to Finance, Survey 2011. Retrieved from
Ferri, G., & Messori, M. (2000). 'Bank–Firm Relationships and Allocative Efficiency in Northeastern and Central Italy and in the South'. Journal of Banking & Finance, 24(6), 1067-1095. doi:http://dx.doi.org/10.1016/S0378-4266(99)00118-1
Fritsch, M., & Schilder, D. (2008). 'Does Venture Capital Investment Really Require Spatial Proximity? An Empirical Investigation'. Environment and Planning A, 40(9), 2114-2131. Företagarna. (2015). Småföretagen Vill Växa - Men Saknar Finansiering. Retrieved from
Stockholm:
GEM. (2003). Global Entrepreneurship Monitor Retrieved from Wellesly, MA:
Gereffi, G., Humphrey, J., & Sturgeon, T. (2005). 'The Governance of Global Value Chains'.
Review of International Political Economy, 12(1), 78-104. doi:10.1080/09692290500049805
Geroski, P. A., Van Reenen, J., & Walters, C. F. (1997). 'How Persistently Do Firms Innovate?'.
Research Policy, 26(1), 33-48.
Gilbert, R. A. (1984). 'Bank Market Structure and Competition: A Survey'. Journal of Money,
Credit and Banking, 16(4), 617-645.
Goldsmith, R. (1969). Financial Structure and Development: New Haven, CT: Yale University Press.
Greene, W. H. (2008). Econometric Analysis. Upper Saddle River: Pearson Prentice Hall
Hall, B. (2002). 'The Financing of Research and Development'. Oxford Review of Economic
Policy, 18(1), 35-51. doi:10.1093/oxrep/18.1.35
Hall, B. H., Moncada-Paternò-Castello, P., Montresor, S., & Vezzani, A. (2016). 'Financing Constraints, R&D Investments and Innovative Performances: New Empirical Evidence at
24
the Firm Level for Europe'. Economics of Innovation and New Technology, 25(3), 183-196. doi:10.1080/10438599.2015.1076194
Harrison, R. T., & Mason, C. M. (1992). 'International Perspectives on the Supply of Informal Venture Capital'. Journal of Business Venturing, 7(6), 459-475. doi:http://dx.doi.org/10.1016/0883-9026(92)90020-R
Hayek, F. A. (1945). 'The Use of Knowledge in Society'. American Economic Review, 35(4), 519-530. doi:10.2307/1809376
Hubbard, R. G. (1998). 'Capital-Market Imperfections and Investment'. Journal of Economic
Literature, 36(1), 193-225.
Johansson, B., & Lööf, H. (2008). 'Innovation Activities Explained by Firm Attributes and Location'. Economics of Innovation and New Technology, 17(6), 533-552.
King, R. G., & Levine, R. (1993). 'Finance and Growth: Schumpeter Might Be Right'. The
Quarterly Journal of Economics, 108(3), 717-737. doi:10.2307/2118406
Lundvall, B.-Å. (Ed.) (1992). 'National Systems of Innovation - Towards a Theory of Innovation
and Interactive Learning'. London: Pinter.
Lutz, E., Bender, M., Achleitner, A.-K., & Kaserer, C. (2013). 'Importance of Spatial Proximity between Venture Capital Investors and Investees in Germany'. Journal of Business
Research, 66(11), 2346-2354. doi:http://dx.doi.org/10.1016/j.jbusres.2012.04.016
Lööf, H., & Nabavi, P. (2016). 'Innovation and Credit Constraints: Evidence from Swedish Exporting Firms'. Economics of Innovation and New Technology, 25(3), 269-282. doi:10.1080/10438599.2015.1076196
Majocchi, A., Bacchiocchi, E., & Mayrhofer, U. (2005). 'Firm Size, Business Experience and Export Intensity in Smes: A Longitudinal Approach to Complex Relationships'.
International Business Review, 14(6), 719-738. doi:http://dx.doi.org/10.1016/j.ibusrev.2005.07.004
Malerba, F., Orsenigo, L., & Peretto, P. (1997). 'Persistence of Innovative Activities, Sectoral Patterns of Innovation and International Technological Specialization'. International
Journal of Industrial Organization, 15(6), 801-826. doi:http://dx.doi.org/10.1016/S0167-7187(97)00012-X
Mina, A., Lahr, H., & Hughes, A. (2013). 'The Demand and Supply of External Finance for Innovative Firms'. Industrial and Corporate Change, 22(4), 869-901. doi:10.1093/icc/dtt020
Mohnen, P., Palm, F. C., van der Loeff, S. S., & Tiwari, A. (2008). 'Financial Constraints and Other Obstacles: Are They a Threat to Innovation Activity?'. De Economist, 156(2), 201-214. doi:10.1007/s10645-008-9089-y
Månsson, N., & Landström, H. (2006). 'Business Angels in a Changing Economy: The Case of Sweden'. Venture Capital, 8(4), 281-301. doi:10.1080/13691060600836275
Nelson, R. R., & Winter, S. G. (1982). An Evolutionary Theory of Economic Change. Cambridge, Massachusetts: The Belknap Press of Harvard University Press.
O'Sullivan, M. (2005). Finance and Innovation. In J. Fagerberg, D. C. Mowery, & R. R. Nelson (Eds.), The Oxford Handbook of Innovation (pp. 240-265). Oxford: Oxford University Press.
Petersen, M. A., & Rajan, R. G. (1995). 'The Effect of Credit Market Competition on Lending Relationships'. Quarterly Journal of Economics, 110(2), 407-443. doi:10.2307/2118445 Petersen, M. A., & Rajan, R. G. (2002). 'Does Distance Still Matter? The Information Revolution
in Small Business Lending'. The Journal of Finance, 57(6), 2533-2570. doi:10.1111/1540-6261.00505
Pollard, J. S. (2003). 'Small Firm Finance and Economic Geography'. Journal of Economic
Geography, 3(4), 429-452. doi:10.1093/jeg/lbg015
Riding, A. L. (2008). 'Business Angels and Love Money Investors: Segments of the Informal Market for Risk Capital'. Venture Capital, 10(4), 355-369. doi:10.1080/13691060802351222
Roper, S., & Hewitt-Dundas, N. (2008). 'Innovation Persistence: Survey and Case-Study
Evidence'. Research Policy, 37(1), 149-162.
25
Scherer, F. M. (1965). 'Size of Firm, Oligopoly, and Research: A Comment'. Canadian Journal
of Economics and Political Science, 31(02), 256-266. doi:doi:10.1017/S0315489000002115
Schumpeter, J. (1911). The Theory of Economic Development (Vol. 16). New Jersey: Transaction Publishers.
Schumpeter, J. (1939). Business Cycles (Vol. 1). New York: McGraw Hill.
Schumpeter, J. A. (1934). The Theory of Economic Development: An Inquiry into Profits,
Capital, Credit, Interest, and the Business Cycle. Cambridge, MA: Harvard University
Press.
Sharpe, S. A. (1990). 'Asymmetric Information, Bank Lending and Implicit Contracts: A Stylized Model of Customer Relationships'. The Journal of Finance, 45(4), 1069-1087.
Sjögren, H., & Zackrisson, M. (2005). 'The Search for Competent Capital: Financing of High Technology Small Firms in Sweden and USA'. Venture Capital, 7(1), 75-97. doi:10.1080/1369106042000335629
Statistics Sweden. (2012). Innovation Activity in Swedish Enterprises 2008–2010. Retrieved from Stenfors, A. (2014). The Swedish Financial System. In L. U. B. School (Ed.), Studies in financial
systems (Vol. 13). Leeds: FESSUD
Storper, M., & Venables, A. J. (2004). 'Buzz: Face-to-Face Contact and the Urban Economy'.
Journal of Economic Geography, 4(4), 351-370. doi:10.1093/jnlecg/lbh027
Söderblom, A. (2012). The Current State of the Venture Capital Industry. Retrieved from Örebro: Söderblom, A., & Samuelsson, M. (2014). Sources of Capital for Innovative Startup Firms (9).
Retrieved from Örebro:
Thornhill, S. (2006). 'Knowledge, Innovation and Firm Performance in High- and Low-Technology Regimes'. Journal of Business Venturing, 21(5), 687-703.
Uchida, H. (2011). 'What Do Banks Evaluate When They Screen Borrowers? Soft Information, Hard Information and Collateral'. Journal of Financial Services Research, 40(1), 29-48. doi:10.1007/s10693-010-0100-9
Udell, G. F. (2008). 'What's in a Relationship? The Case of Commercial Lending'. Business
Horizons, 51(2), 93-103. doi:http://dx.doi.org/10.1016/j.bushor.2007.10.005
Westlund, H. (2011). 'Multidimensional Entrepreneurship: Theoretical Considerations and Swedish Empirics'. Regional Science Policy & Practice, 3(3), 199-218. doi:10.1111/j.1757-7802.2011.01037.x
1 In total, 87 percent of the firms that were granted a loan during 2009-2011obtained it from a bank. Only
four percent obtained their loan from a private individual, such as a family member or friend, while eight percent obtained their loan from another source, such as micro-finance institutions or government-related sources.
2 Almi is a state-governed institution that provide loans, venture capital, and advisory functions to both
start-ups and established firms (Almi, 2016).
3 The four Swedish-owned commercial bank corporations—Swedbank, SEB, Nordea, and
Handelsbanken—hold together about 70 % of the market, depending slightly upon type of service (Bankföreningen, 2010).
4 Hotels and restaurants, as well as agriculture and forestry, construction, and the public sector are