Rapport 27 - 2011
Fat Quality 2007
Trends in fatty acid composition
over the last decade
Innehåll
Svensk sammanfattning ... 2
Summary ... 3
Background ... 4
Material and methods ... 6
Food Sampling ... 6
Sample handling and lipid analysis ... 6
Quality assurance of analytical methods ... 7
Calculations and control of nutrient values ... 7
Results ... 9
Contacts with the food industry ... 9
Fatty acids ... 9
Comparison with data from other studies ... 9
Discussion ... 10
Annex ... 12
Sammanfattning
Livsmedelsverket strävar efter att halterna av transfettsyror sänks i produkter på den svenska marknaden i dialog med livsmedelsindustrin. Olika fettsyror har olika hälsoeffekter och stabilitet. Det är därför viktigt att följa den totala fettkvalitén i livsmedel. Under 2007 genomfördes ett analysprojekt specialinriktat mot sammansättningen av fettsyror, med fokus på transfettsyror. Syftet med projektet var att undersöka fettsyrasammansättningen dels i produkter där höga halter av transfetter påvisats, dels i produkter ur produktkategorier där tranfettsyror har påvisats. Ytterligare ett syfte var att jämföra fettsyrasamman-sättningen i produkterna 2007 med tidigare analysresultat, för att undersöka hur byte av fettråvara påverkar den totala fettsyrasammansättningen.
Urvalet av livsmedel baserades på resultat från tidigare studier av transfetter i livsmedel utförda av Livsmedelsverket. Prov inköptes i livsmedelsaffärer i Uppsala under februari till mars 2007. Sammanlagt analyserades 53 prover av kakor, kex, godis och popcorn. Fettsyrasammansättningen jämfördes med resultat från Livsmedelsverkets landsomfattande projekt, där transfettsyror i kakor, kex och chips analyserades 2008, med ett projekt om fettkvalitet i konditoribitar 2004 och med svensk data från den stora europeiska studien TRANSFAIR 1998. Anledningen till att det gick att jämföra med resultat från 2008 var att problem med analysen av totalfett gjorde att publicering av denna rapport fördröjdes. Jämförelsen visar att förekomsten av transfetter i svenska livsmedel har minskat under de senaste tio åren och i dag är marginell. Dock påvisades mer än två procent transfettsyror (av totala fettsyror) i sex av de analyserade produkterna. Livsmedelsverket har varit i kontakt med de berörda producenterna och alla har efter dialog med Livsmedelsverket bytt ut ingredienser innehållande trans-fettsyror. I produkter där man tidigare har hittat transfetter har dessa ersatts med i huvudsak mättade fettsyror (framför allt palmsyra, 16:0), men i en del produkter även med fleromättade fettsyror (framför allt linolensyra, 18:2n6).
I industrin har man infört andra metoder för att framställa fetter med önskvärda kvalitéer och råvaror har bytts ut mot olja rik på mättade fettsyror. Fraktionering av oljor och omestring av fetter har också bidragit till nya transfettfria produkter som kan användas i livsmedelsindustrin.
Summary
The National Food Agency carried out a survey in 2007 to determine the fatty acid composition in a range of cookies, biscuits, sweets and pop corn. The aim of the project was to determine the levels of fatty acids in these products and to follow the trends in fatty acid profile of selected products from 1998-2008.
Fiftythree samples were analysed. The fatty acid profile of the products from 2007 was compared to the fatty acid profile of the same or similar products analysed 1998, 2004 and 2008. In general the levels of trans-fatty acids have decreased since 1998 and the proportion of saturated fatty acids, and in some products polyunsaturated fatty acids, have increased. The most frequent saturated and polyunsaturated fatty acids are palmitic acid (16:0) and linoleic acid (18:2n6), respectively. Total fat content did not change over the years. Even if trans-fatty acids have decreased levels higher than two percent (of total fatty acids) were detected in six of the fiftythree analysed products. In those products the
ingredients containing trans-fatty acids have been exchanged for products rich in mainly saturated fatty acids after communication with the producer.
Background
The presence of high levels of trans-fatty acids (TFA) in foods has during the last decade been debated due to their negative health effects. TFA used to be present in high amounts in e.g. margarines, chips, popcorn, fried and bakery products. The levels of TFA in products on the Swedish market have decreased since 1995, when high levels of TFA were found in margarines. Already during 1995 all margarines for consumers on the Swedish market were made TFA free. In 2005 the debate had an upswing and efforts from the food industry to reduce TFA in foods were undertaken. Instead of using partially hydrogenated or hydrogenated vegetable oils the industry uses other types of vegetable fat, (e.g. palm oil) with a high level of saturated fatty acids (SFA) as ingredient in the products. Changes in fat and oils for food production, will affect the fatty acid (FA) profile of the products and finally consumers health.
The current Nordic Nutrition Recommendations, NNR 2004 (1) and similarly the Swedish version, SNR 2005 (2) give recommendations on total fat and FA intake. In NNR emphasis is put on fat quality, and intake of saturated and TFA should be limited to about 10 percent of the daily energy intake (E %). Moreover, intake of TFA from partially hydrogenated fat should be reduced as much as possible. Recommendations on total fat intake and on specific FA are also given by the Food and Agriculture Organization of the United Nations (FAO) and World Health Organisation (WHO)(3). FAO/WHO recommends a daily fat intake for adults between 20 and 35 E %, a minimum fat intake of 15 E % is set to ensure adequate intake of essential FA, lipid soluble vitamins and energy. The intake of SFA is recommended to be 10 E %, polyunsaturated fatty acids (PUFA) to be 11 E % or less and TFA to be maximum 1 E %.
In this National Food Agency (NFA) project, with data from 2007, special emphasis on fat quality was addressed. The aim of the analytical project “Fat quality 2007” (Diarienr 1224/2007 saknr. 410) was to determine levels of FA in selected products on the Swedish market and to compare these levels with previous data on FA levels in the same or comparable products. A second aim was to react to public opinion and concern over levels of TFA in products on the Swedish market. An error in the first total fat content analysis has delayed this project and the first report “Fat Quality 2007 –Fatty acid composition version 1” had to be withdrawn. With the publication of the correct data we also had the opportunity to compare the results with data published in the report “Riksprojekt 2008, Transfettsyror i kakor/kex och chips –märkning och halter” (4) where biscuits, cookies and potato chips were investigated.
The project group in 2007 consisted of Irene Mattisson, Sören Wretling, Marianne Arnemo, Hanna Sara Strandler. Sören Wretling and Maria Haglund were
Arnemo designed sampling of products and carried out the data entry, calculations of fatty acids content in grams and the control of data quality. In 2011, Veronica Öhrvik was responsible for the software and the managing of food composition data, Sofia Trattner wrote the report.
Material and methods
Food Sampling
A total of fifty-three samples (Annex 1) were collected from stores in Uppsala in the period February - March 2007 or sent directly to NFA by the manufacture. The sampling was done to get the newest possible formula regarding fat
ingredient of the food. Except for Pop corn where both the old and new formula was included in the 2007 samples to get comparison data.
Three previous analytical studies; Transfair ”(5), Cakes and pastries 2004” (6) and ”Sauces and Aloe Vera 2006” (7) were used as a base when the products for this study 2007 were selected. Cakes, cookies, chips were prioritised. Samples of similar products but with various producers were analysed as separate samples. This differs to the Transfair study where the samples were analysed as composite samples. We decided to analyse each sample separately and calculate “Transfair food” according to the pooling proportions used. Only a selection of the Transfair food was analysed. Priorities were given to brands still existing on the market; some foods samples in Transfair were bought in local bakeries and these products were not sampled again. Some brands did no longer exist on the market, in these cases we bought “top sales” of the same type of product. Eleven branded products and 10 “top sales” products were sampled for the comparison with Transfair. Out of these 21 samples 13 were also analysed in ”Cakes and pastries 2004”. In the project ”Sauces and Aloe Vera 2006” results indicated that products intended for gluten intolerant and also vegan products were high in TFA. Twelve gluten free, 4 vegan and two laktovegetarian foods were sampled for further investigation of gluten free, vegan laktovegetarian products.
Sample handling and lipid analysis
Each collected sample was given a unique identity and the ingredient declarations were photographed for documentation in “Livsmedelssystemet, software”. The foods were treated as laboratory samples as soon as they arrived to the laboratory. About 400-800 g of the food sample was homogenized.
A portion of the homogenized samples were extracted with methanol:chloroform according to Folch et al. (8). The lipid extract was converted into fatty acid methyl esters (FAME) by incubation with 0.01 M sodium hydroxide in methanol at 60-65°C, 30 min followed by collection of the FAME solved in hexane. The FAME were separated with gas-chromatography (GC) (Agilent 6890) equipped with a polar fused capillary column, split injector (split ratio: 50ml/min) and flame
ionisation detector (FID) the temperature program started at 100°C for 1 min, and increasing 15°C/min up to 160°C, thereafter 4/min up to 210°C and held at 210°C for 12 min. The carrier gas was helium (initial pressure 80kPa) and the makeup gas was nitrogen. Individual FA were identified with external standard (68A or St-85 Nu Check, Minnesota, USA) and retention times. Injector and detector temperature were set to 275°C and 250°C respectively. In addition TFA was detected by separating the FAME on a 100 m CP SIL-88 fused silica capillary column with a temperature program starting at 175°C for 60 min, increasing 10°C/min up to 210°C and kept at 210°C for 51 min. The carrier gas was helium (initial pressure 180kPa and split ratio 40 ml / min). Trans-fatty acids were identified with external standard (K 110 Alltech-Applied Science Labs, USA) and retention times.
The NFA uses a FA report enabling the calculations of individual TFA and cis- FA. All FA were given as percent of total FA. The FA analyses were carried out during 2007. The Chemistry Division 2 at the NFA coordinated the fat content analyses, which were sent for external analysis. The first fat content analysis in 2007 appeared to be insufficient, and samples were sent to ALcontrol Labora-tories, (ALcontrol AB, accredited Labboratory) in Linköping in November 2009 for reanalyzes of total fat content on the gravimetrical method NMKL 131, Fat, determination by SBR in meat. In intermediate time, samples were stored at -20°C.
Quality assurance of analytical methods
The laboratory at Chemistry Division 2 has a long history of working with nutritional analyses as well as quality assurance. Many methods have been ISO/IEC 17025:2005 accredited (9) since 1995 by SWEDAC (Swedish board for Accreditation and Conformity Assessment). Routines, instructions and analytical methods are part of a Quality System. Methods not yet accredited are at regular intervals included in internal audits. The quality of the analytical work is ensured continuously through analysis checks. This is done in the form of recovery test, blank samples, control samples and analyzing certified reference materials. Chemistry Division 2 frequently participates in proficiency tests even with non-accredited methods.
Calculations and control of nutrient values
The analytical results were reported to the Nutrition Division and entered into “Livsmedelssystemet”, software for the managing of food composition data. Fatty acids (g) were calculated from analytical results given in weight percent with the algorithm “Conversion factor * total fat (g) * percentage FA/100”. The conversion factor is the estimated content of FA of the total fat content in different types of foods. For mixed foods, the conversion factor for the main fat source was used.
In this project the factor for “Fats and oils, coconut fat excluded” (=0,956) was used for all products. Total fat and FA are expressed in g/100 g food. In addition, TFA are also expressed in g/100 g fat. Results were controlled see table 1.
Table 1. Quality control of nutrient data
Nutrient Type of control Total fat/
fatty acids
1. The ratio of the sum of fatty acids (SFA + MUFA + PUFA) and total fat should be below 1.
Results
Results were evaluated continuously during the monitoring period, enabling reactions to deviations from content declarations or other noteworthy observations.
Contacts with the food industry
Letters were sent to all producers of products with TFA levels above 2 percent, see copy of standard letter in annex 2. The contacts resulted in a serious follow up by the industry and ingredients were changed to eliminate TFA.
Fatty acids
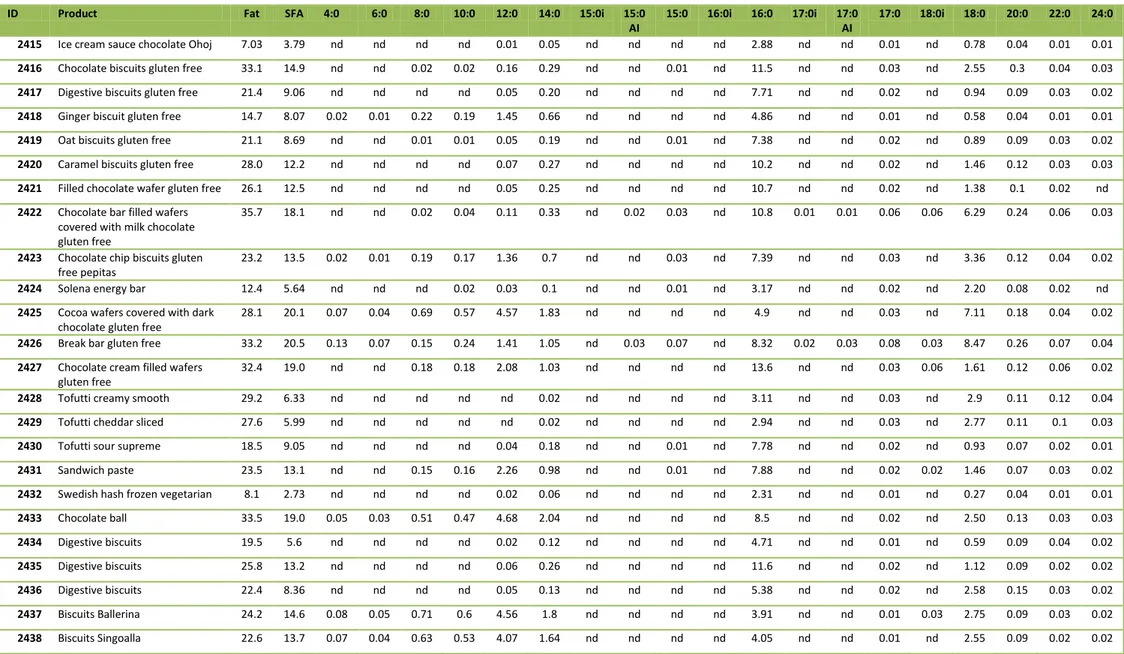
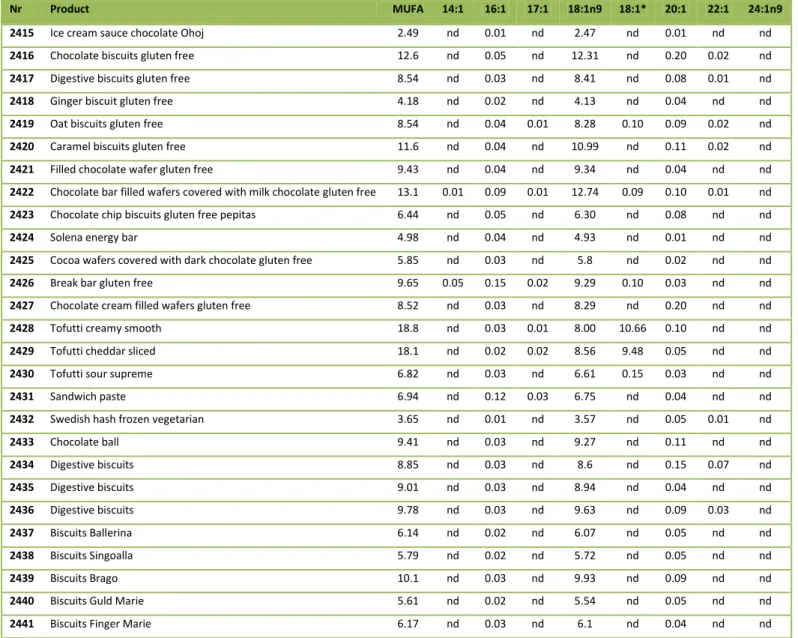
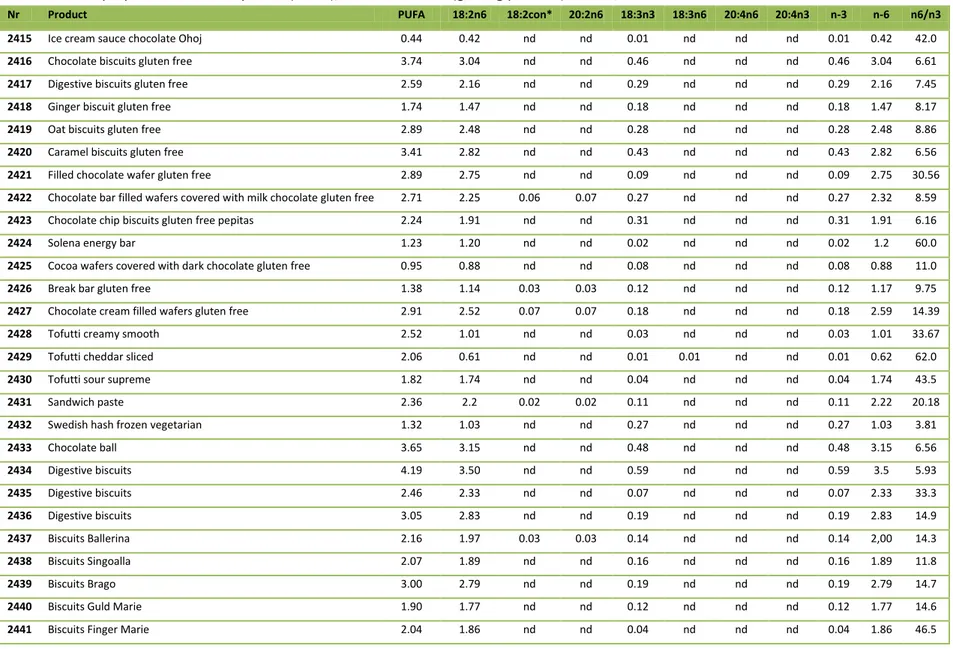
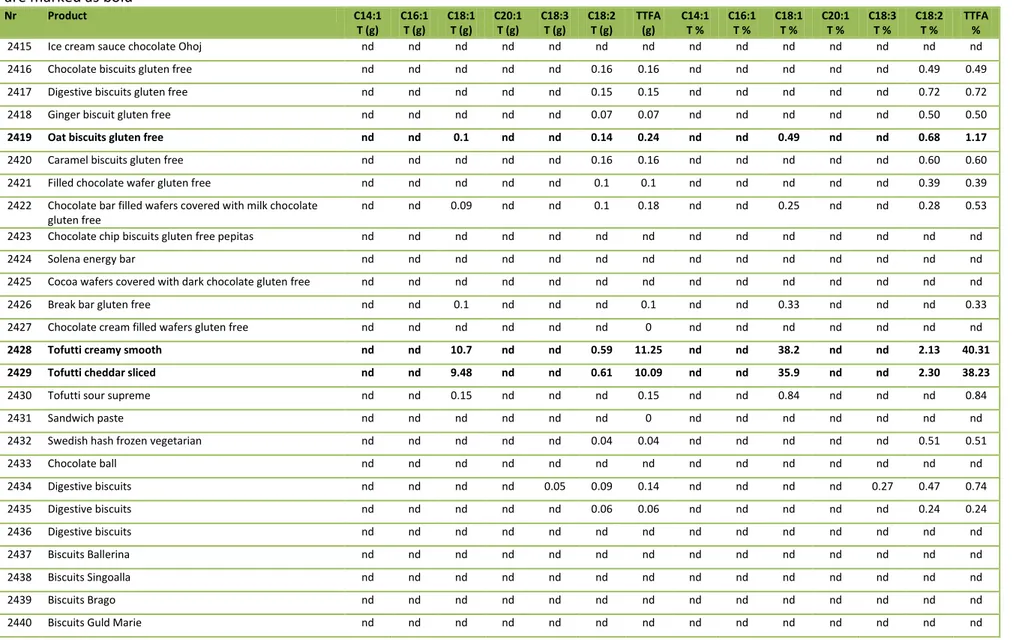
Total fatty acid composition (g /100g food) of the analyzed foods is shown in Annex 3 Table 1, 2, 3 and 4. Table 1 shows total fat content total SFA and individual SFA content, Table 2 total and individual monounsaturated fatty acids (MUFA) content, Table 3 total and individual PUFA content and Table 4 TFA content and TFA percent of total FA. TFA were detected in 58 percent of the analyzed samples, in 6 products (11%) more than 2 percent TFA of total FA and in 8 products (15%) more than 1 percent TFA were reported.
Comparison with data from other studies
The products which were analyzed at least two of the four times of analysis in 1998, 2004, 2007 and 2008 (4-7) are presented in Annex 3, Table 5. Fat content, SFA, MUFA and PUFA, 16:0 and 18:2n6, being the most changed FA are shown.
Discussion
This NFA survey has generated updated information on FA content in products with new formula and new fat ingredients. Most of the analysed products are bakery products and sweets, with a fat content of 15 percent or more, even though some had lower fat content e.g. popcorn. The FA profile of the products was reflecting the FA composition of the main fat source in the respective product. To give a brief overview of the FA distribution in bakery products approximately 40 percent was SFA, 40 percent MUFA and 20 percent PUFA. The Creme filled wafers, Göteborgskex had a SFA content over 95 percent, with more than 70 percent of identified FA being shorter than Myristic acid (14:0), the fat ingredient was hydrogenated vegetable fat. The amount of palmitic acid (16:0) was high in several products indicating the use of palm oil. The most common PUFA was 18:2n6 the second most common PUFA was alfa-linolenic acid (18:3n3), however it was present in much lower amounts than n-6 in all products except the minced meat pie (Annex 3 Tables 1, 2, 3). Oils rich in 18:2n6 are sunflower- and corn oil, oils rich in 18:3n3 are linseed oil and rapeseed oil. Soybean oil contains both 18:2n6 and 183n3, 50 percent and 8 percent respectively.
Specific FA are claimed to have different health effects. The documented SFA according to FAO/WHO (3) with a negative effect on coronary heart disease (CHD) are 12:0, 14:0, 16:0, whereas 18:0 has no effect. NNR 2004 (1), suggest that 14:0 is the most potential SFA for development of CHD, followed by 16:0 and 12:0 and 18:0 is suggested to be neutral. In a recent review, Micha and Mozaffarian 2010 (10) concluded that 12:0 has beneficial effects on CHD compared to carbohydrates and that 14:0, 16:0 and 18:0 has little or no effect in comparison to carbohydrates. For PUFA intakes a minimum intake of 2.5 E % 18:2n6 and 0.5 E % 18:3n3 is recommended by FAO/WHO (3), these FA are essential and cannot be synthesized by humans. Furthermore intake of the n-3 long chain fatty acids (n-3 LCPUFA) are recommended at a level of 250 mg/day combined of eicosapentaenoic acid (EPA, 20:5n3) and docosahexaenoic acid (DHA , 22:6n3) as they have been shown to prevent CHD and possibly prevent other degenerative diseases associated with ageing (3). A maximum intake of TFA of 1 E % /day (= 2.4 g FA/day) is recommended, from this 0.5 E % is estimated to be of ruminant origin and 0.5 E % to be from industrial partially hydrogenated oils. The TFA has been associated with increased risk of CHD and appears to be more potent than SFA in the development of CHD (3). The dose and origin of TFA and its impact on health has been discussed. Human dietary studies indicate that TFA levels higher than 4 E % appears to increase LDL-cholesterol and dietary levels higher than 5 to 6 E % appears to decrease HLD-cholesterol (11). Willett and Mozaffarian state that ruminant TFA consumption in most persons is lower than 1 E %, and therefore not a public health issue (12).
The actions undertaken following the reported hazards with TFA has been
different in different countries. In Denmark, TFA levels are regulated and national legislation introduced allowing a maximum of 2 percent of total lipids in products containing non-dairy fat. In the United States and Canada, obligation to label TFA content was introduced in 2003(13). In Sweden communication with the industry has resulted in reduced TFA levels. To label products containing industrial hydrogenated vegetable oils are mandatory in Sweden and EU (14).
In general, when the FA profiles from 2007 are compared to the results from 1998, 2004 and 2008 the presence of TFA has clearly declined during the 10 year period 1998 - 2008. In comparison to 1998, the levels of TFA were reduced and replaced with SFA or PUFA (Annex 3, Table 4). Even if the industry has made efforts to reduce the levels of TFA, 58 percent of the analyzed products 2007 contained TFA, 6 products (11%) were found with more than 2 percent TFA of total FA and 8 products (15%) contained more than 1 percent TFA. The TFA were mainly originating from partly hydrogenated vegetable oil, in one case milk fat was listed as ingredient and in one product only vegetable oil and fat were declared. The fat content of pop corn varied from 7 to 25 percent, and the TFA proportions from 0 to 44 percent of total FA. No relation between fat content and TFA content was seen. In the products where TFA was reduced, it was replaced both by SFA and PUFA. The TFA levels in gluten free products did not vary between analysis in 2006 (Annex 3, Table 4) and this study. The total fat content did not vary among years, indicating that the removal of TFA has not decreased total fat content of the analysed products. That the total fat content did not decrease could be good from a consumer health perspective. In this kind of products fat are likely to b e replaced with largely refined carbohydrates. Replacements of SFA with largely refined carbohydrates are likely to increase the risk of CHD and favour development of metabolic syndrome (3).
Information about the FA composition in food products is of importance for estimating intakes, to support decision making and risk management, for
consumers’ choice and also for possible food intake recommendations according to SNR, NNR or FAO/WHO recommendations. There are many factors to consider regarding FA in foods: i) The negative effects on health by to high fat, especially SFA, intake, in particular on CHD. ii) In terms of n-3 LCPUFA, the preventing effects on CHD and their roles as precursors for metabolites involved in the immune system and inflammatory response. iii) For PUFA there is also an upper limit in respect to increased risk for lipid peroxidation and storage stability. iiii) Sensory aspects such as the FA chain length a degree of unsaturation and its effects on melting properties. This means that it is important to follow total lipid quality and find a balanced FA profile where all aspects of lipid quality are considered. The type of oils used will always be reflected in the FA profile of products, meaning that data from this kind of projects should be evaluated together with the list of ingredient to confirm that the FA profile given
in databases etc. is likely to still be valid. It is of primary importance that the national nutrient data are representative estimates of the nutritional components in foods.
Different techniques to reduce TFA levels of oils have been developed in the industry since the debate about TFA started. A combination of new raw material rich in SFA, fractioning of oils into fractions of specific FA and re-esterification have been developed, also introduction of high oleic acid sunflower and rapeseed oil is increasing in Sweden at the moment (personal communication with J-O Lindfelt, AarhusKarlshamn). The use of palm oil seems to have increased since TFA had to be eliminated. As a consequence, today´s food industries in Sweden rely on a sustainable supply of palm oil. The supply of palm oil and the environ-mental consequences of palm oil use is an issue that has to be investigated separately. Today, the products with high levels of TFA found on the Swedish market are imported, including EU countries. Levels up to 37 percent were reported in imported products in the study ”Tansfettsyror i kakor/kex och chips – märkning och halter” (4).
The dialogue that NFA has had with the industry has resulted in reduced inclusion of TFA in food products. For each product in this study with TFA above 2 percent of total FA, contact was taken to the producer, and in each case the TFA
containing ingredient has been replaced. In Sweden today the calculated average daily intake of TFA is 0.6 E % (based on analytical data combined with food balance data sheet from the Swedish board of agriculture), mostly deriving from dairy products and beef. This level is below levels considered as having negative effects on health (15). Possibly groups having an extreme intake of specific products high TFA intake could be a problem. In this survey TFA was found in small amounts in the gluten free products. Nevertheless as this consumer group have a narrowed product segment to choose within, the total intake of TFA in consumers of gluten free products may be higher than in average.
Annex
Annex 1. Food samples, Swedish and English name and fat source Annex 2. Standard letter for communication with the industry Annex 3. Fat content and fatty acids
References
1. Becker W, Lyhne, N., Pedersen, AN., Aro, A., Fogelholm, M., Þórsdottír, I., Alexander, J., Anderssen, S.A., Meltzer, H.M., Pedersen, J.I. Nordic Nutrition Recommendations – Integrating nutrition and physical activity. Nordic Council of Ministers, Copenhagen 2004.
2. SNR. Svenska näringsrekommendationer, Rekommendationer om näring och fysisk aktivitet: Livsmedelsverket 2005.
3. FAO. Fats and fatty acids in human nutrition Report and expert consultation: Food and Agriculture Organization of the United Nations 2010.
4. Wallin L, Wretling, A., Mattisson, I. . In Swedish ”Tansfettsyror i kakor/kex och chips –märkning och halter”, NFA Report 18 / 2009.
5. Becker W. Fatty acid composition of foods on the Swedish market –the TRANSFAIR study i in Sweden, NFA Report 14 / 1998.
6. Torelm I. Mer Socker – mindre transfett I kaffebröd. Vår föda. 2004;4. 7. Mattisson I, Gard, C., Staffas, A., Åstrand, C. . In swedish ”Färdiga såser, glutenfria produkter och Aloe Vera”, NFA Report 13 / 2009.
8. Folch J, Lees, M., Solane-Stanley, G.H. A simple method for the isolation and purification of total lipids from animal tissues. J Biol Chem 1957;226:497–509. 9. ISO/IEC. 17025:2005 General requirements for the competence of testing and calibration laboratories.
10. Micha R, Mozaffarian, D. Saturated fat and cardiometabolic risk factors, coronary heart disease, stroke, and diabetes: a fresh look at the evidence. Lipids 2010;10:893-905.
11. Hunter EJ. Dietary levels of trans-fatty acids: basis for health concerns and industry efforts to limit use. Nutrition Research. 2005;25(499-513).
12. Willett W, Mozaffarian, D. Ruminant or industrial sources of trans fatty acids: public health issue or food label skirmish? Am J Clin Nutr. 2008;87:515–6. 13. Krettek A, Thorpenberg, S., Bondjers, G. Trans Fatty Acids and Health: A Review of Health Hazards and Existing Legislation. Policy Department Economic and Scientific Policy 19. 2008.
14. LIVSFS. 2004:27, bilaga 2.
15. Becker W, Haglund, M., Wretling, S. Fett och fettsyror i den svenska kosten - Analyser av matkorgar inköpta 2005, NFA Report 17 / 2008.
Annex 1
Table 1. Swedish and English product name, brand name and fat source (if declared)
ID English product name / description Swedish product name Brand name fat source 2415 Ice cream sauce chocolate Ohoj Glassås choklad Ohoj Ohoj Veg. fat
2416 Chocolate biscuits gluten free Chokladkakor glutenfritt Semper Veg. fat and oil
2417 Digestive biscuits gluten free Digestivekex glutenfritt Semper Veg. margarin
2418 Ginger biscuit gluten free Pepparkakor glutenfritt Semper Veg. margarin
2419 Oat biscuits gluten free Havrekex glutenfria Semper Veg.fat and veg. oil
2420 Caramel biscuits gluten free Kolakakor glutenfria Semper Partially hydrogenated veg. fat and veg. oil
2421 Filled chocolate wafer gluten free Chokladrån glutenfri Dr Schär Veg. fat cacao fat
2422 Chocolate bar filled wafers covered with milk chocolate gluten free
Kexchoklad snack Dr Schär Cacao fat milk fat veg. fat
2423 Chocolate chip biscuits gluten free pepitas Pepitas kakor med chokladbitar Dr Schär Non hydrogenated palm coconut, rapeseed oil and fat, cacao fat
2424 Solena energy bar Solena energy bar Dr Schär Butter, veg. fat
2425 Cocoa wafers covered with dark chocolate gluten free
Quadritos kexchoklad Dr Schär Cacao fat, hydrogenated veg. oil
2426 Break bar gluten free Break bar glutenfri Glutano Cacao fat, Partially hydrogenated fat and oil (sunflower, cotton, palm)
2427 Chocolate cream filled wafers gluten free Glutano Chokladrån glutenfri Glutano Non hydrogenated palm and rapeseed fat, soyabean meal fat
2428 Tofutti creamy smooth Tofutti creamy Kung Markatta Partially hydrogenated soyabean oil
2429 Tofutti cheddar sliced Tofutti cheddar skivat sojapålägg Kung Markatta Partially hydrogenated soyabean oil
2430 Tofutti sour supreme Tofutti sour supreme Kung Markatta Cold pressed soyabean, palm and oliv oil
2431 Sandwich paste Sandwichkräm Nutana Veg. oil, hydrogenated veg oil
2432 Swedish hash frozen vegetarian Vegetarisk pyttipanna Goda Gröna Veg. oil, rapeseed oil
2433 Chocolate ball Chokladboll Delicato Partially hydrogenated veg. fat
2434 Digestive biscuits Digestivekex LU Veg. fat, veg. oil (7%rapeseed)
2435 Digestive biscuits Digestivekex McVities Sunflower and palm oil
2436 Digestive biscuits Digestivekex Göteborgskex Partially hydrogenated veg. fat
2437 Biscuits Ballerina Ballerina Göteborgskex Hydrogenated veg. fat, veg. oil
2438 Biscuits Singoalla Singoalla Göteborgskex Hydrogenated veg. fat, veg. oil
Annex 1
2442 Oat Bits (Hob-nobs) Oat Bits (Hob-nobs) LU Veg.oil (rapeseed) and veg. fat
2443 Creme filled wafers vanilla Cremefyllda rån vaniljsmak Göteborgskex Hydrogenated veg. fat
2444 Creme filled wafers chocolate Cremefyllda rån chokladsmak Göteborgskex Hydrogenated veg. fat
2445 Almond bun Mandelkubb Skogaholm Partially hydrogenated veg. fat
2446 Almond bun Mandelkubb Hägges Veg. fat and oil (palm coconut rapeseed)
2447 Chocolate Swiss roll with butter cream Drömrulltårta Signum Veg. fat
2448 Chocolate Swiss roll with butter cream Drömrulle Hägges Veg.fat hydrogenated palm coconut and palm kernel, palm and rapeseed oil.
2449 Chocolate chip cookies Chocolate chip cookies Pågen Cacao butter, veg. fat and oil
2450 Wheat wholemeal rusks krisprolls Krisprolls osötade fullkornsskorpor Pågen Partially hydrogenated veg. oil
2451 Danish pastry bake off Wienerbröd bake off Dafgård Not reported
2452 Danish pastry bake off Wienerbröd bake off Lantmännens Veg. fat and oil
2453 Danish pastry bake off Wienerbröd bake off Nordic Bake off Not reported
2454 Chocolate toffee covered with chocolate (Riesen) Chokladkola mörk m chokladöverdrag Riesen Cacao butter, butter fat, veg. oil
2455 Milk chocolate with almond caramel centre Daim Mjölkchoklad fylld m mandelkrokant Daim
Marabou Veg. fat, cacao butter, butter and butter fat
2456 Cinnamon croissant Kanelgifflar Pågen Partially hydrogenated veg.fat and veg.oil
2457 Finnish cookies Finska pågar Pågen Veg. fat, veg. oil
2458 Small cookies Bondkakor Gilles Palm rapeseed coconut oil
2459 Swedish punch (or arrak) roll Punschrulle Delicato Veg. partially hydrogenated fat
2460 Minced meat pie frozen Köttfärspaj fryst Felix Veg. oil, meat
2461 Minced meat pie frozen Köttfärspaj fryst Frödinge Rapeseed palm shea oil, meat
2462 Micro popcorn Micro popcorn Popco A/S Veg. fat
2463 Micro popcorn American Popcorn Micro popcorn American Popcorn Scandinavian Snacks AB
Hydrogenated palm oil
2464 Chocolate bar filled wafers covered with milk chocolate
Kexchoklad Cloetta Veg. fat
2465 Micro popcorn Micro popcorn OLW Veg. fat
Annex 2
Livsmedelsverket genomför varje år näringsanalyser av livsmedel. Analyserna i projektet ”Fetkvalité2007” som bland annat innehöll produkten ”XXXX”, börjar nu bli färdiga. Resultaten från projektet kommer att publiceras under hösten.
Vi kontaktar er eftersom er produkt ”XXXX”, innehöll höga halter transfettsyror, XX% av totala mängden fettsyror. Som jämförelse kan nämnas att vanlig ost innehåller 3-4 % transfettsyror. ”XXXX” innehöll XX % transfettsyror.
Livsmedelsverket anser det viktigt att intaget av transfettsyror hålls så lågt som möjligt för att skydda konsumenterna. Därför pågår en dialog mellan Livsmedelsverket och industrin för att på frivillig väg hålla halterna transfettsyror så lågt som möjligt. Många svenska
livsmedelsindustrier har kommit långt i produktutvecklingen och de flesta produkter ligger väl under 1 % transfettsyror.
Vi vill informera er om analysresultaten eftersom det är höga halter av transfettsyror. Vi undrar om det pågår något arbete med att få ner mängden transfettsyror i produkterna och vilken tidsplanen är i så fall. Vi vill också veta om det skett några ändringar av produkterna sedan vår provtagning i mars 2007.
Vi ser fram emot era kommentarer, senast 15 september.
Vänliga hälsningar
Annica Sohlström Avdelningschef
Annex 3
Table 1. Fat content, total saturated fatty acids (SFA) and individual SFA (g/100g product)
ID Product Fat SFA 4:0 6:0 8:0 10:0 12:0 14:0 15:0i 15:0 AI
15:0 16:0i 16:0 17:0i 17:0 AI
17:0 18:0i 18:0 20:0 22:0 24:0 2415 Ice cream sauce chocolate Ohoj 7.03 3.79 nd nd nd nd 0.01 0.05 nd nd nd nd 2.88 nd nd 0.01 nd 0.78 0.04 0.01 0.01
2416 Chocolate biscuits gluten free 33.1 14.9 nd nd 0.02 0.02 0.16 0.29 nd nd 0.01 nd 11.5 nd nd 0.03 nd 2.55 0.3 0.04 0.03
2417 Digestive biscuits gluten free 21.4 9.06 nd nd nd nd 0.05 0.20 nd nd nd nd 7.71 nd nd 0.02 nd 0.94 0.09 0.03 0.02
2418 Ginger biscuit gluten free 14.7 8.07 0.02 0.01 0.22 0.19 1.45 0.66 nd nd nd nd 4.86 nd nd 0.01 nd 0.58 0.04 0.01 0.01
2419 Oat biscuits gluten free 21.1 8.69 nd nd 0.01 0.01 0.05 0.19 nd nd 0.01 nd 7.38 nd nd 0.02 nd 0.89 0.09 0.03 0.02
2420 Caramel biscuits gluten free 28.0 12.2 nd nd nd nd 0.07 0.27 nd nd nd nd 10.2 nd nd 0.02 nd 1.46 0.12 0.03 0.03
2421 Filled chocolate wafer gluten free 26.1 12.5 nd nd nd nd 0.05 0.25 nd nd nd nd 10.7 nd nd 0.02 nd 1.38 0.1 0.02 nd
2422 Chocolate bar filled wafers covered with milk chocolate gluten free
35.7 18.1 nd nd 0.02 0.04 0.11 0.33 nd 0.02 0.03 nd 10.8 0.01 0.01 0.06 0.06 6.29 0.24 0.06 0.03
2423 Chocolate chip biscuits gluten free pepitas
23.2 13.5 0.02 0.01 0.19 0.17 1.36 0.7 nd nd 0.03 nd 7.39 nd nd 0.03 nd 3.36 0.12 0.04 0.02
2424 Solena energy bar 12.4 5.64 nd nd nd 0.02 0.03 0.1 nd nd 0.01 nd 3.17 nd nd 0.02 nd 2.20 0.08 0.02 nd
2425 Cocoa wafers covered with dark chocolate gluten free
28.1 20.1 0.07 0.04 0.69 0.57 4.57 1.83 nd nd nd nd 4.9 nd nd 0.03 nd 7.11 0.18 0.04 0.02
2426 Break bar gluten free 33.2 20.5 0.13 0.07 0.15 0.24 1.41 1.05 nd 0.03 0.07 nd 8.32 0.02 0.03 0.08 0.03 8.47 0.26 0.07 0.04
2427 Chocolate cream filled wafers gluten free
32.4 19.0 nd nd 0.18 0.18 2.08 1.03 nd nd nd nd 13.6 nd nd 0.03 0.06 1.61 0.12 0.06 0.02
2428 Tofutti creamy smooth 29.2 6.33 nd nd nd nd nd 0.02 nd nd nd nd 3.11 nd nd 0.03 nd 2.9 0.11 0.12 0.04
2429 Tofutti cheddar sliced 27.6 5.99 nd nd nd nd nd 0.02 nd nd nd nd 2.94 nd nd 0.03 nd 2.77 0.11 0.1 0.03
2430 Tofutti sour supreme 18.5 9.05 nd nd nd nd 0.04 0.18 nd nd 0.01 nd 7.78 nd nd 0.02 nd 0.93 0.07 0.02 0.01
2431 Sandwich paste 23.5 13.1 nd nd 0.15 0.16 2.26 0.98 nd nd 0.01 nd 7.88 nd nd 0.02 0.02 1.46 0.07 0.03 0.02
2432 Swedish hash frozen vegetarian 8.1 2.73 nd nd nd nd 0.02 0.06 nd nd nd nd 2.31 nd nd 0.01 nd 0.27 0.04 0.01 0.01
2433 Chocolate ball 33.5 19.0 0.05 0.03 0.51 0.47 4.68 2.04 nd nd nd nd 8.5 nd nd 0.02 nd 2.50 0.13 0.03 0.03
2434 Digestive biscuits 19.5 5.6 nd nd nd nd 0.02 0.12 nd nd nd nd 4.71 nd nd 0.01 nd 0.59 0.09 0.04 0.02
Annex 3
ID Product Fat SFA 4:0 6:0 8:0 10:0 12:0 14:0 15:0i 15:0 AI
15:0 16:0I 16:0 17:0i 17:0 AI
17:0 18:0i 18:0 20:0 22:0 24:0 2439 Biscuits Brago 22.4 8.28 nd nd nd nd 0.05 0.13 nd nd nd nd 5.31 nd nd 0.02 nd 2.57 0.14 0.03 0.02
2440 Biscuits Guld Marie 13.0 4.76 nd nd nd nd 0.03 0.08 nd nd nd nd 3.04 nd nd 0.01 nd 1.5 0.08 0.02 0.01
2441 Biscuits Finger Marie 16.9 7.73 nd nd nd nd 0.02 0.16 nd nd nd nd 6.77 nd nd 0.02 nd 0.67 0.06 0.01 0.01
2442 Oat Bits (Hob-nobs) 15.6 4.02 nd nd nd nd 0.01 0.07 nd nd nd nd 3.31 nd nd 0.01 nd 0.50 0.05 0.05 0.02
2443 Creme filled wafers vanilla 30.0 28.4 0.23 0.13 2 1.72 13.3 5.06 nd nd nd nd 2.63 nd nd 0 nd 3.29 0.04 nd nd
2444 Creme filled wafers chocolate 31.4 28.7 0.23 0.13 2.04 1.7 13.1 5.09 nd nd nd nd 2.86 nd nd 0 0.06 3.46 0.05 nd nd
2445 Almond bun 19.9 8.8 0.03 0.02 0.27 0.21 1.71 0.75 nd nd nd nd 4.77 nd nd 0.01 nd 0.91 0.07 0.03 0.02
2446 Almond bun 13.5 7.79 0.06 0.04 0.5 0.39 2.90 1.08 nd nd nd nd 2.30 nd nd 0.01 0.03 0.43 0.03 0.02 nd
2447 Chocolate Swiss roll with butter cream
18.0 7.64 0.03 0.02 0.27 0.22 1.52 0.69 nd 0.01 0.02 nd 4.00 nd nd 0.02 0.04 0.71 0.05 0.03 0.02
2448 Chocolate Swiss roll with butter cream
19.0 10.6 0.06 0.03 0.48 0.39 2.62 1.12 nd nd nd nd 4.97 nd nd 0.01 0.02 0.79 0.05 0.03 0.01
2449 Chocolate chip cookies 31.0 18.0 0.05 0.03 0.33 0.28 2.16 0.98 nd nd 0.01 nd 9.12 nd nd 0.04 nd 4.74 0.17 0.05 0.03
2450 Wheat wholemeal rusks krisprolls 8.91 1.44 nd nd nd nd 0.01 0.01 nd nd nd nd 0.66 nd nd 0.01 nd 0.53 0.07 0.13 0.01
2451 Danish pastry bake off 26.9 11.5 nd nd 0.07 0.06 0.55 0.41 nd nd 0.01 nd 8.84 nd nd 0.02 nd 1.35 0.11 0.04 0.02
2452 Danish pastry bake off 29.2 13.2 nd nd 0.03 0.03 0.30 0.33 nd nd 0.01 nd 10.5 nd nd 0.03 0.04 1.66 0.12 0.04 0.03
2453 Danish pastry bake off 31.0 13.6 nd nd 0.02 0.02 0.19 0.31 nd nd 0.01 nd 10.8 nd nd 0.03 nd 1.79 0.17 0.29 0.04
2454 Chocolate toffee covered with chocolate (Riesen)
17.7 10.5 0.03 0.02 0.01 0.03 0.05 0.17 nd nd 0.02 nd 4.70 nd nd 0.04 0.03 5.18 0.15 0.03 0.02
2455 Milk chocolate with almond caramel centre (Daim)
34.1 19.4 0.14 0.07 0.19 0.25 1.02 0.99 nd 0.02 0.06 nd 9.16 0.02 0.02 0.07 nd 7.05 0.22 0.05 0.03
2456 Cinnamon croissant 17.5 4.26 nd nd nd nd 0.02 0.07 nd nd nd nd 3.21 nd nd 0.01 nd 0.67 0.10 0.16 0.02
2457 Finnish cookies 30.9 16.4 0.04 0.02 0.28 0.27 3.48 1.39 nd nd nd nd 9.69 nd nd 0.02 nd 1.09 0.09 0.03 0.02
2458 Small cookies 24.1 10.7 nd nd 0.04 0.03 0.40 0.32 nd nd 0.01 nd 8.44 nd nd 0.02 nd 1.06 0.12 0.22 0.03
2459 Swedish punch (or arrak) roll 20.3 9.73 0.02 0.01 0.2 0.21 2.70 1.19 nd nd nd nd 3.91 nd nd 0.01 nd 1.40 0.06 0.02 0.01
2460 Minced meat pie frozen 14.3 5.21 0.03 0.02 0.02 0.03 0.07 0.24 0.01 0.01 0.03 0.01 3.67 0.01 0.02 0.04 nd 0.93 0.06 0.03 0.01
2461 Minced meat pie frozen 12.7 4.78 0.09 0.05 0.04 0.1 0.13 0.44 0.01 0.02 0.04 0.01 2.86 0.02 0.02 0.03 nd 0.84 0.04 0.02 0.01
Annex 3
ID Product Fat SFA 4:0 6:0 8:0 10:0 12:0 14:0 15:0i 15:0 AI
15:0 16:0i 16:0 17:0I 17:0 AI
17:0 18:0i 18:0 20:0 22:0 24:0 2464 Chocolate bar filled wafers
covered with milk chocolate
28.8 19.1 0.04 0.02 0.25 0.27 3.48 1.43 nd nd 0.02 nd 7.94 nd nd 0.04 0.02 5.25 0.17 0.04 0.02
2465 Micro popcorn 20.5 10.5 nd nd nd nd 0.06 0.22 nd nd nd nd 9.20 nd nd 0.02 nd 0.93 0.08 0.02 nd
2466 Micro popcorn (made in USA) 14.0 3.11 nd nd nd nd nd nd nd nd nd nd 0.87 nd nd 0 nd 2.06 0.05 0.09 0.03
2467 Micro popcorn (made in France) 17.3 8.34 nd nd nd nd 0.04 0.17 nd nd nd nd 7.29 nd nd 0.02 nd 0.75 0.06 0.01 nd nd = not detected
Annex 3
Table 2. Total monounsaturated fatty acids (MUFA) and individual MUFA (g/100g product)
Nr Product MUFA 14:1 16:1 17:1 18:1n9 18:1* 20:1 22:1 24:1n9 2415 Ice cream sauce chocolate Ohoj 2.49 nd 0.01 nd 2.47 nd 0.01 nd nd
2416 Chocolate biscuits gluten free 12.6 nd 0.05 nd 12.31 nd 0.20 0.02 nd
2417 Digestive biscuits gluten free 8.54 nd 0.03 nd 8.41 nd 0.08 0.01 nd
2418 Ginger biscuit gluten free 4.18 nd 0.02 nd 4.13 nd 0.04 nd nd
2419 Oat biscuits gluten free 8.54 nd 0.04 0.01 8.28 0.10 0.09 0.02 nd
2420 Caramel biscuits gluten free 11.6 nd 0.04 nd 10.99 nd 0.11 0.02 nd
2421 Filled chocolate wafer gluten free 9.43 nd 0.04 nd 9.34 nd 0.04 nd nd
2422 Chocolate bar filled wafers covered with milk chocolate gluten free 13.1 0.01 0.09 0.01 12.74 0.09 0.10 0.01 nd
2423 Chocolate chip biscuits gluten free pepitas 6.44 nd 0.05 nd 6.30 nd 0.08 nd nd
2424 Solena energy bar 4.98 nd 0.04 nd 4.93 nd 0.01 nd nd
2425 Cocoa wafers covered with dark chocolate gluten free 5.85 nd 0.03 nd 5.8 nd 0.02 nd nd
2426 Break bar gluten free 9.65 0.05 0.15 0.02 9.29 0.10 0.03 nd nd
2427 Chocolate cream filled wafers gluten free 8.52 nd 0.03 nd 8.29 nd 0.20 nd nd
2428 Tofutti creamy smooth 18.8 nd 0.03 0.01 8.00 10.66 0.10 nd nd
2429 Tofutti cheddar sliced 18.1 nd 0.02 0.02 8.56 9.48 0.05 nd nd
2430 Tofutti sour supreme 6.82 nd 0.03 nd 6.61 0.15 0.03 nd nd
2431 Sandwich paste 6.94 nd 0.12 0.03 6.75 nd 0.04 nd nd
2432 Swedish hash frozen vegetarian 3.65 nd 0.01 nd 3.57 nd 0.05 0.01 nd
2433 Chocolate ball 9.41 nd 0.03 nd 9.27 nd 0.11 nd nd 2434 Digestive biscuits 8.85 nd 0.03 nd 8.6 nd 0.15 0.07 nd 2435 Digestive biscuits 9.01 nd 0.03 nd 8.94 nd 0.04 nd nd 2436 Digestive biscuits 9.78 nd 0.03 nd 9.63 nd 0.09 0.03 nd 2437 Biscuits Ballerina 6.14 nd 0.02 nd 6.07 nd 0.05 nd nd 2438 Biscuits Singoalla 5.79 nd 0.02 nd 5.72 nd 0.05 nd nd 2439 Biscuits Brago 10.1 nd 0.03 nd 9.93 nd 0.09 nd nd
Annex 3
Nr Product MUFA 14:1 16:1 17:1 18:1n9 18:1* 20:1 22:1 24:1n9 2442 Oat Bits (Hob-nobs) 5.22 nd 0.02 nd 5.11 nd 0.07 0.02 nd
2443 Creme filled wafers vanilla 0.13 nd 0 nd 0.13 nd nd nd nd
2444 Creme filled wafers chocolate 0.53 nd 0.04 nd 0.48 nd nd nd nd
2445 Almond bun 6.86 nd 0.03 nd 6.67 0.06 0.10 nd nd
2446 Almond bun 3.09 0.01 0.02 nd 2.98 nd 0.06 0.02 nd
2447 Chocolate Swiss roll with butter cream 5.86 nd 0.06 nd 5.57 0.11 0.09 0.01 0.02
2448 Chocolate Swiss roll with butter cream 4.92 nd 0.03 nd 4.82 nd 0.06 0.01 nd
2449 Chocolate chip cookies 9.23 nd 0.05 nd 9.1 nd 0.06 0.02 nd
2450 Wheat wholemeal rusks krisprolls 5.27 nd 0.02 0.01 4.19 0.92 0.10 0.02 0.01
2451 Danish pastry bake off 11.0 nd 0.06 nd 10.25 0.55 0.12 0.03 nd
2452 Danish pastry bake off 10.8 0,00 0.07 0.01 10.57 nd 0.12 nd nd
2453 Danish pastry bake off Nordic Bake off 11.9 nd 0.07 nd 11.28 0.42 0.1 0.01 nd
2454 Chocolate toffee covered with chocolate (Riesen) 5.44 0.01 0.05 nd 5.36 nd 0.01 nd nd
2455 Milk chocolate with almond caramel centre (Daim) 10.8 0.06 0.16 0.02 10.51 nd 0.04 nd nd
2456 Cinnamon croissant 8.82 nd 0.05 0.01 8.51 0.08 0.14 0.02 0.02
2457 Finnish cookies 9.57 nd 0.04 nd 9.41 nd 0.09 0.04 nd
2458 Small cookies 9.11 nd 0.05 0.01 8.92 nd 0.10 0.03 nd
2459 Swedish punch (or arrak) roll 6.82 nd 0.05 nd 6.67 0.04 0.05 nd nd
2460 Minced meat pie frozen 5.92 0.03 0.11 0.03 5.52 0.12 0.09 0.01 0.01
2461 Minced meat pie frozen 5.00 0.04 0.12 0.02 4.59 0.08 0.08 0.01 0.02
2462 Micro popcorn Popco A/S 9.27 nd 0.04 nd 9.18 nd 0.05 nd nd
2463 Micro popcorn American Popcorn 2.26 nd 0.01 nd 2.19 0.04 0.02 nd nd
2464 Chocolate bar filled wafers covered with milk chocolate 7.13 nd 0.05 nd 7.05 nd 0.03 nd nd
2465 Micro popcorn 6.65 nd 0.03 nd 6.58 nd 0.03 nd nd
Annex 3
Table 3. Total polyunsaturated fatty acids (PUFA), individual PUFA (g/100g product) and n6/n3 ratio
Nr Product PUFA 18:2n6 18:2con* 20:2n6 18:3n3 18:3n6 20:4n6 20:4n3 n-3 n-6 n6/n3 2415 Ice cream sauce chocolate Ohoj 0.44 0.42 nd nd 0.01 nd nd nd 0.01 0.42 42.0
2416 Chocolate biscuits gluten free 3.74 3.04 nd nd 0.46 nd nd nd 0.46 3.04 6.61
2417 Digestive biscuits gluten free 2.59 2.16 nd nd 0.29 nd nd nd 0.29 2.16 7.45
2418 Ginger biscuit gluten free 1.74 1.47 nd nd 0.18 nd nd nd 0.18 1.47 8.17
2419 Oat biscuits gluten free 2.89 2.48 nd nd 0.28 nd nd nd 0.28 2.48 8.86
2420 Caramel biscuits gluten free 3.41 2.82 nd nd 0.43 nd nd nd 0.43 2.82 6.56
2421 Filled chocolate wafer gluten free 2.89 2.75 nd nd 0.09 nd nd nd 0.09 2.75 30.56
2422 Chocolate bar filled wafers covered with milk chocolate gluten free 2.71 2.25 0.06 0.07 0.27 nd nd nd 0.27 2.32 8.59
2423 Chocolate chip biscuits gluten free pepitas 2.24 1.91 nd nd 0.31 nd nd nd 0.31 1.91 6.16
2424 Solena energy bar 1.23 1.20 nd nd 0.02 nd nd nd 0.02 1.2 60.0
2425 Cocoa wafers covered with dark chocolate gluten free 0.95 0.88 nd nd 0.08 nd nd nd 0.08 0.88 11.0
2426 Break bar gluten free 1.38 1.14 0.03 0.03 0.12 nd nd nd 0.12 1.17 9.75
2427 Chocolate cream filled wafers gluten free 2.91 2.52 0.07 0.07 0.18 nd nd nd 0.18 2.59 14.39
2428 Tofutti creamy smooth 2.52 1.01 nd nd 0.03 nd nd nd 0.03 1.01 33.67
2429 Tofutti cheddar sliced 2.06 0.61 nd nd 0.01 0.01 nd nd 0.01 0.62 62.0
2430 Tofutti sour supreme 1.82 1.74 nd nd 0.04 nd nd nd 0.04 1.74 43.5
2431 Sandwich paste 2.36 2.2 0.02 0.02 0.11 nd nd nd 0.11 2.22 20.18
2432 Swedish hash frozen vegetarian 1.32 1.03 nd nd 0.27 nd nd nd 0.27 1.03 3.81
2433 Chocolate ball 3.65 3.15 nd nd 0.48 nd nd nd 0.48 3.15 6.56 2434 Digestive biscuits 4.19 3.50 nd nd 0.59 nd nd nd 0.59 3.5 5.93 2435 Digestive biscuits 2.46 2.33 nd nd 0.07 nd nd nd 0.07 2.33 33.3 2436 Digestive biscuits 3.05 2.83 nd nd 0.19 nd nd nd 0.19 2.83 14.9 2437 Biscuits Ballerina 2.16 1.97 0.03 0.03 0.14 nd nd nd 0.14 2,00 14.3 2438 Biscuits Singoalla 2.07 1.89 nd nd 0.16 nd nd nd 0.16 1.89 11.8 2439 Biscuits Brago 3.00 2.79 nd nd 0.19 nd nd nd 0.19 2.79 14.7
Annex 3
Nr Product PUFA 18:2n6 18:2con* 20:2n6 18:3n3 18:3n6 20:4n6 20:4n3 n-3 n-6 n6/n3 2442 Oat Bits (Hob-nobs) 5.43 5.20 nd nd 0.19 nd nd nd 0.19 5.2 27.4
2443 Creme filled wafers vanilla 0.14 0.14 nd nd nd nd nd nd nd 0.14 -
2444 Creme filled wafers chocolate 0.43 0.16 nd 0.08 0,00 nd nd nd nd 0.24 -
2445 Almond bun 3.30 2.47 nd nd 0.76 nd nd nd 0.76 2.47 3.25
2446 Almond bun 1.86 1.37 0.04 0.04 0.37 nd nd nd 0.37 1.41 3.81
2447 Chocolate Swiss roll with butter cream 3.36 2.29 0.04 0.04 0.98 nd 0.01 0.01 0.98 2.34 2.39
2448 Chocolate Swiss roll with butter cream 2.43 1.96 0.03 0.03 0.34 nd nd nd 0.34 1.99 5.85
2449 Chocolate chip cookies 2.41 2.05 nd nd 0.28 nd nd nd 0.28 2.05 7.32
2450 Wheat wholemeal rusks krisprolls 1.80 1.2 nd nd 0.1 nd nd nd 0.1 1.2 12.0
2451 Danish pastry bake off 3.21 2.47 nd nd 0.59 nd nd nd 0.59 2.47 4.19
2452 Danish pastry bake off 3.70 3.03 0.05 0.06 0.54 0,00 0.01 0.01 0.54 3.1 5.74
2453 Danish pastry bake off 4.09 3.58 nd nd 0.3 nd nd nd 0.3 3.58 11.93
2454 Chocolate toffee covered with chocolate (Riesen) 0.81 0.67 0.04 0.04 0.05 nd nd nd 0.05 0.71 14.2
2455 Milk chocolate with almond caramel centre (Daim) 2.40 2.14 nd nd 0.21 nd nd nd 0.21 2.14 10.2
2456 Cinnamon croissant 3.67 2.79 0.00 0.01 0.78 nd nd nd 0.78 2.8 3.59
2457 Finnish cookies 3.52 2.97 nd nd 0.46 nd nd nd 0.46 2.97 6.46
2458 Small cookies 3.23 2.71 nd nd 0.41 nd nd nd 0.41 2.71 6.61
2459 Swedish punch (or arrak) roll 2.83 2.52 nd nd 0.29 nd nd nd 0.29 2.52 8.69
2460 Minced meat pie frozen 2.50 1.75 nd nd 0.68 nd 0.01 0.01 0.68 1.76 2.59
2461 Minced meat pie frozen 2.30 1.57 nd 0.01 0.63 nd 0.02 0.02 0.63 1.6 2.54
2462 Micro popcorn Popco A/S 3.44 3.24 nd nd 0.04 nd nd nd 0.04 3.24 81.0
2463 Micro popcorn American Popcorn 2.58 2.51 nd nd 0.05 nd nd nd 0.05 2.51 50.2
2464 Chocolate bar filled wafers covered with milk chocolate 1.25 1.12 0.03 0.03 0.07 nd nd nd 0.07 1.15 16.4
2465 Micro popcorn 2.43 2.33 nd nd 0.04 nd nd nd 0.04 2.33 58.3
Annex 3
Table 4. Total trans-fatty acids (TTFA) and individual TFA presented in g/100g product and as % of tot FA,products containing more than 1% TTFA of total FA are marked as bold
Nr Product C14:1 T (g) C16:1 T (g) C18:1 T (g) C20:1 T (g) C18:3 T (g) C18:2 T (g) TTFA (g) C14:1 T % C16:1 T % C18:1 T % C20:1 T % C18:3 T % C18:2 T % TTFA %
2415 Ice cream sauce chocolate Ohoj nd nd nd nd nd nd nd nd nd nd nd nd nd nd
2416 Chocolate biscuits gluten free nd nd nd nd nd 0.16 0.16 nd nd nd nd nd 0.49 0.49 2417 Digestive biscuits gluten free nd nd nd nd nd 0.15 0.15 nd nd nd nd nd 0.72 0.72
2418 Ginger biscuit gluten free nd nd nd nd nd 0.07 0.07 nd nd nd nd nd 0.50 0.50
2419 Oat biscuits gluten free nd nd 0.1 nd nd 0.14 0.24 nd nd 0.49 nd nd 0.68 1.17
2420 Caramel biscuits gluten free nd nd nd nd nd 0.16 0.16 nd nd nd nd nd 0.60 0.60
2421 Filled chocolate wafer gluten free nd nd nd nd nd 0.1 0.1 nd nd nd nd nd 0.39 0.39 2422 Chocolate bar filled wafers covered with milk chocolate
gluten free
nd nd 0.09 nd nd 0.1 0.18 nd nd 0.25 nd nd 0.28 0.53 2423 Chocolate chip biscuits gluten free pepitas nd nd nd nd nd nd nd nd nd nd nd nd nd nd
2424 Solena energy bar nd nd nd nd nd nd nd nd nd nd nd nd nd nd
2425 Cocoa wafers covered with dark chocolate gluten free nd nd nd nd nd nd nd nd nd nd nd nd nd nd
2426 Break bar gluten free nd nd 0.1 nd nd nd 0.1 nd nd 0.33 nd nd nd 0.33
2427 Chocolate cream filled wafers gluten free nd nd nd nd nd nd 0 nd nd nd nd nd nd nd
2428 Tofutti creamy smooth nd nd 10.7 nd nd 0.59 11.25 nd nd 38.2 nd nd 2.13 40.31 2429 Tofutti cheddar sliced nd nd 9.48 nd nd 0.61 10.09 nd nd 35.9 nd nd 2.30 38.23
2430 Tofutti sour supreme nd nd 0.15 nd nd nd 0.15 nd nd 0.84 nd nd nd 0.84
2431 Sandwich paste nd nd nd nd nd nd 0 nd nd nd nd nd nd nd
2432 Swedish hash frozen vegetarian nd nd nd nd nd 0.04 0.04 nd nd nd nd nd 0.51 0.51
2433 Chocolate ball nd nd nd nd nd nd nd nd nd nd nd nd nd nd 2434 Digestive biscuits nd nd nd nd 0.05 0.09 0.14 nd nd nd nd 0.27 0.47 0.74 2435 Digestive biscuits nd nd nd nd nd 0.06 0.06 nd nd nd nd nd 0.24 0.24 2436 Digestive biscuits nd nd nd nd nd nd nd nd nd nd nd nd nd nd 2437 Biscuits Ballerina nd nd nd nd nd nd nd nd nd nd nd nd nd nd 2438 Biscuits Singoalla nd nd nd nd nd nd nd nd nd nd nd nd nd nd
Annex 3 Nr Product C14:1 T (g) C16:1 T (g) C18:1 T (g) C20:1 T (g) C18:3 T (g) C18:2 T (g) TTFA (g) C14:1 T % C16:1 T % C18:1 T % C20:1 T % C18:3 T % C18:2 T % TTFA %
2441 Biscuits Finger Marie nd nd nd nd nd 0.14 0.14 nd nd nd nd nd 0.84 0.84
2442 Oat Bits (Hob-nobs) nd nd nd nd nd 0.07 0.07 nd nd nd nd nd 0.45 0.45
2443 Creme filled wafers vanilla nd nd nd nd nd nd 0 nd nd nd nd nd nd nd
2444 Creme filled wafers chocolate nd nd nd nd nd nd 0 nd nd nd nd nd nd nd
2445 Almond bun nd nd 0.06 nd nd nd 0.06 nd nd 0.32 nd nd nd 0.32
2446 Almond bun nd nd 0 nd nd nd 0 nd nd nd nd nd nd nd
2447 Chocolate Swiss roll with butter cream nd nd 0.11 nd nd 0.04 0.15 nd nd 0.64 nd nd 0.26 0.90 2448 Chocolate Swiss roll with butter cream nd nd nd nd nd 0.07 0.07 nd nd nd nd nd 0.37 0.37
2449 Chocolate chip cookies nd nd nd nd nd 0.07 0.07 nd nd nd nd nd 0.24 0.24
2450 Wheat wholemeal rusks krisprolls nd nd 0.92 nd nd 0.28 1.2 nd nd 10.8 nd nd 3.27 14.1 2451 Danish pastry bake off nd nd 0.55 nd nd 0.05 0.6 nd nd 2.15 nd nd 0.19 2.34
2452 Danish pastry bake off nd nd nd nd nd nd 0 nd nd nd nd nd nd nd
2453 Danish pastry bake off nd nd 0.41 nd nd 0.25 0.66 nd nd 1.4 nd nd 0.83 2.23
2454 Chocolate toffee covered with chocolate (Riesen) nd nd nd nd nd nd 0 nd nd nd nd nd nd nd 2455 Milk chocolate with almond caramel centre (Daim) nd nd nd nd nd nd 0 nd nd nd nd nd nd nd
2456 Cinnamon croissant nd nd 0.07 nd 0.06 0.06 0.19 nd nd 0.44 nd 0.36 0.34 1.14
2457 Finnish cookies nd nd nd nd nd nd 0 nd nd nd nd nd nd nd
2458 Small cookies nd nd nd nd nd 0.11 0.11 nd nd nd nd nd 0.48 0.48
2459 Swedish punch (or arrak) roll nd nd 0.04 nd nd nd 0.04 nd nd 0.21 nd nd nd 0.21
2460 Minced meat pie frozen nd nd 0.13 nd nd nd 0.13 nd nd 0.94 nd nd nd 0.94
2461 Minced meat pie frozen nd 0.03 0.08 nd nd nd 0.11 nd 0.24 0.67 nd nd nd 0.91
2462 Micro popcorn Popco A/S nd nd nd nd nd 0.16 0.16 nd nd nd nd nd 0.67 0.67
2463 Micro popcorn American Popcorn nd nd 0.04 nd nd nd 0.04 nd nd 0.58 nd nd nd 0.58 2464 Chocolate bar filled wafers covered with milk chocolate nd nd nd nd nd nd nd nd nd nd nd nd nd nd
Annex 3
Table 5. Total fat content, SFA, MUFA, PUFA, total TFA 16:0 and 18:2n6 (% of total FA) in products analysed at more than one of the points of analysis 1998, 2005, 2007 and 2008
Year Product Fett (g) SFA MUFA* PUFA* TTFA 16:0 18:2n6
2008 Biscuits Ballerina na 58.3 29.8 10.4 0.22 17.6 9.39 2007 24.2 63.1 26.5 9.32 nd 16.9 8.50 2004 20.7 47.5 44.0 7.42 nd 8.43 4.56 2008 Small cookies na 49.1 38.1 12.9 2.56 27.7 11.0 2007 24.1 46.4 39.5 14.0 0.48 36.6 11.8 2008 Biscuits Brago na 39.4 46.2 13.9 0.47 25.6 12.9 2007 22.4 38.7 46.9 14.0 nd 24.8 13.0 2004 18.4 26.3 64.7 8.40 nd 13.1 5.19 2007 Chocolate ball 33.5 59.3 29.4 11.4 nd 26.5 9.83 2004 31.2 49.7 39.4 10.4 nd 24.8 8.67
2007 Chocolate biscuits gluten free 33.1 47.1 39.7 11.8 0.49 36.2 9.60
2006 25.1 47.1 39.7 11.8 0.46 36.2 9.60
2008 Chocolate chip cookies na 55.8 35.5 8.45 0.32 34.8 7.93
2007 31.0 60.7 31.2 8.13 0.24 30.8 6.91 2004 22.9 45.7 43.7 9.93 8.48 24.9 7.73 2008 Digestive biscuits na 51.1 37.9 11.1 0.49 39.2 10.4 2007 22.6 40.9 43.2 15.5 0.32 32.5 13.8 2004 19.8 41.9 44.6 12.0 nd 29.0 11.1 1998 21.0 34.6 37.9 7.93 19.2 26.5 7.71
2007 Digestive biscuits gluten free 21.4 44.3 41.7 12.7 0.72 37.7 10.6
2006 16.1 44.3 41.7 12.7 0.72 37.7 10.6
2007 Chocolate Swiss roll with butter cream 18.5 51.1 30.6 16.4 0.63 25.3 12.0
2004 16.5 45.7 41.6 12.4 6.86 18.9 9.04
1998 20.5 39.1 32.6 9.02 16.8 14.5 8.57
2008 Biscuits Finger Marie na 48.2 38.6 13.0 0.95 42.3 12.3
2007 16.9 47.8 38.2 12.7 0.84 41.9 11.5
2008 Oat Bits (Hob-nobs) na 45.1 39.7 15.2 0.53 39.5 14.7
2007 15.6 27.0 35.0 36.4 0.53 22.2 34.9
Annex 3
Year Product Fett (g) SFA MUFA PUFA TTFA 16:0 18:2n6 2008 Biscuits Guld Marie 48.2 38.2 13.7 0.64 41.5 12.9
2007 13.0 38.3 45.2 15.3 nd 24.5 14.2
2004 12.8 41.2 44.7 13.1 nd 27.2 12.2
1998 10.8 33.2 35.3 8.97 22.2 23.8 8.64
2004 Swedish macaroon teacake (Mazarin) 20.6 41.8 41.6 15.9 0.44 21.2 13.2
1998 24.5 29.0 44.2 15.2 9.41 14.3 13.4 2004 Doughnut filled 13.2 44.3 43.2 12.2 5.19 29.8 10.3 1998 9.1 22.9 48.0 8.29 17.3 13.3 7.34 2008 Ginger biscuit 48.2 33.2 18.6 0.54 28.3 15.1 2006 16.2 57.4 29.7 12.4 0.50 34.6 10.5 1998 15.9 38.1 38.2 9.23 13.9 14.0 8.12
2008 Ginger biscuit gluten free 56.9 29.7 12.1 0.65 33.1 10.0
2007 14.7 57.4 29.7 12.4 0.50 34.6 10.5
2007 Popcorn 16.9 41.5 40.4 18.0 9.03 33.0 17.0
1998 17.3 63.4 22.7 13.0 0.56 20.3 12.8
2007 Swedish punch (or arrak) roll 20.3 50.2 35.1 14.6 0.21 20.1 13.0
2004 20.2 38.0 45.7 16.1 nd 15.7 15.1
2004 Swiss roll, filled with jam 14.9 54.8 34.5 10.5 5.48 18.2 7.67
1998 14.5 36.2 31.1 12.3 18.5 13.7 10.4
2008 Creme filled wafers 74.4 19.9 5.30 2.15 26.5 4.74
2007 30.7 97.2 1.11 0.95 nd 9.35 0.52
2004 29.9 98.4 0.91 0.78 nd 10.2 0.72
1998 27.5 21.1 39.3 1.56 37.4 10.5 1.48
2007 Biscuits Singoalla 22.6 63.5 26.8 9.59 nd 18.8 8.73
2004 18.9 52.2 40.1 7.12 nd 8.30 4.40
2007 Tofutti creamy smooth original 29.2 22.7 67.4 9.02 40.3 11.2 3.62
2006 26.6 25.4 65.5 9.08 43.3 12.4 3.18
2007 Danish pastry bake off 29.0 45.9 40.5 13.2 1.52 36.1 10.8
2004 27.3 47.1 40.3 11.7 4.17 35.9 9.15
1998 27.0 41.2 40.6 9.87 8.87 30.7 8.52 *MUFA and PUFA from 2004 includes TFA, whereas in 2006 and 2007 cis- and trans- MUFA and PUFA are reported separately
Rapporter som utgivits 2010 1. Proficiency Testing - Food Chemistry, Lead and cadmium extracted from ceramics by C Åstrand and Lars Jorhem. 2. Fullkorn, bönor och ägg - analys av näringsämnen av C Gard, I Mattisson, A Staffas och C Åstrand. 3. Proficiency Testing - Food Chemistry, Nutritional Components of Food, Round N 45 by L Merino. 4. Kompetensprovning av laboratorier: Mikrobiologi - Livsmedel, Januari 2010 av C Normark och K Mykkänen.
5. Riksprojekt 2009. Salmonella, Campylobacter och E.coli i färska kryddor och bladgrönsaker från Sydostasien av N Karnehed och M Lindblad.
6. Vad gör de som drabbas av magsjuka och matförgiftningar - resultat från en nationell intervju- undersökning av J Toljander och N Karnehed. 7. The Swedish Monitoring of Pesticide Residues in Food of Plant Origin: 2008, Part 1 − National Report by A Andersson, F Broman, A Hellström and B-G Österdahl. The Swedish Monitoring of Pesticide Residues in Food of Plant Origin: 2008, Part 2 − Report to Commission and EFSA by A Andersson and A Hellström. 8. Proficiency Testing - Food Chemistry, Trace Elements in Food, Round T-20 by C Åstrand and Lars Jorhem. 9. Kompetensprovning av laboratorier: Mikrobiologi - Dricksvatten, 2010:1, mars av C Lantz, T Šlapokas och M Olsson. 10. Rapportering av livsmedelskontrollen 2009 av D Rosling och K Bäcklund Stålenheim. 11. Rapportering av dricksvattenkontrollen 2009 av D Rosling. 12. Kompetensprovning av laboratorier: Mikrobiologi - Livsmedel, April 2010 av C Normark, K Mykkänen och I Boriak. 13. Kontroll av restsubstanser i levande djur och animaliska livsmedel. Resultat 2009 av I Nordlander, B Aspenström-Fagerlund, A Glynn, A Johansson, K Granelli, E Fredberg, I Nilsson, Livsmedelsverket och K Girma, Jordbruksverket. 14. Metaller i fisk i Sverige - sammanställning av analysdata 2001-2005 av B Sundström och L Jorhem. 15. Import av fisk från tredje land - redlighetsprojekt inom gränskontrollen av E Fredberg, P Elvingsson och Y Sjögren. 16. Djurskydd vid slakt - ett kontrollprojekt av C Berg och T Axelsson. 17. Proficiency Testing - Food Chemistry, Nutritional Components of Food, Round N 46 by L Merino. 18. Proficiency Testing - Food Chemistry, Vitamins in Food, Round V-8 by H S Strandler
and A Staffas. 19. Potatis - analys av näringsämnen av V Öhrvik, I Mattisson, S Wretling och C Åstrand. 20. Kompetensprovning av laboratorier: Mikrobiologi - Dricksvatten, 2010:2, september av C Lantz, T Šlapokas och I Boriak. 21. Proficiency Testing - Food Chemistry, Trace Elements in Food, Round T-21 by C Åstrand and Lars Jorhem.
22. Rapport från GMO-projektet 2010. Undersökning av förekomsten av icke godkända GMO i livsmedel av Z Kurowska. 23. Kompetensprovning av laboratorier: Mikrobiologi - Livsmedel, Oktober 2010 av C Normark, K Mykkänen och I Boriak.
Rapporter som utgivits 2011 1. Lunch och lärande - skollunchens betydelse för elevernas prestation och situation i klassrummet av M Lennernäs. 2. Kosttillskott som säljs via Internet - en studie av hur kraven i lagstiftningen uppfylls av A Wedholm Pallas, A Laser Reuterswärd och U Beckman-Sundh. 3. Vetenskapligt underlag till råd om bra mat i äldreomsorgen. Sammanställt av E Lövestram. 4. Livsmedelssvinn i hushåll och skolor - en kunskapssammanställning av R Modin. 5. Riskprofil för material i kontakt med livsmedel av K Svensson, Livsmedelsverket och G Olafsson, Rikisendurskodun (Environmental and Food Agency of Iceland). 6. Kompetensprovning av laboratorier: Mikrobiologi - Livsmedel, Januari 2011 av C Normark, och I Boriak. 7. Proficiency Testing - Food Chemistry, Nutritional Components of Food, Round N 47. 8. Proficiency Testing - Food Chemistry, Trace Elements in Food, Round T-22 by C Åstrand and Lars Jorhem. 9. Riksprojekt 2010. Listeria monocytogenes i kyld ätfärdig mat av C Nilsson och M Lindblad. 10. Kontroll av restsubstanser i levande djur och animaliska livsmedel. Resultat 2010 av I Nordlander, Å Kjellgren, A Glynn, , B Aspenström-Fagerlund, K Granelli, I Nilsson, C Sjölund Livsmedelsverket och K Girma, Jordbruksverket. 11. Kompetensprovning av laboratorier: Mikrobiologi - Livsmedel, April 2011 av C Normark, I Boriak, M Lindqvist och I Tillander. 12. Bär - analys av näringsämnen av V Öhrvik, I Mattisson, A Staffas och H S Strandler. 13. Kompetensprovning av laboratorier: Mikrobiologi - Dricksvatten, 2011:1, mars av T Šlapokas C Lantz och M Lindqvist. 14. Kontrollprogrammet för tvåskaliga blötdjur − Årsrapport 2009-2010 − av av I Nordlander, M Persson, H Hallström, M Simonsson, Livsmedelsverket och B Karlsson, SMHI. 15. Margariner och matfettsblandningar - analys av fettsyror av R Åsgård och S Wretling. 16. Proficiency Testing - Food Chemistry, Nutritional Components of Food, Round N 48. 17. Kontroll av bekämpningsmedelsrester i livsmedel 2009 av A Jansson, X Holmbäck och A Wannberg. 18. Klimatpåverkan och energianvändning från livsmedelsförpackningar av M Wallman och K Nilsson. 19. Klimatpåverkan i kylkedjan - från livsmedelsindustri till konsument av K Nilsson och U Lindberg. 20. Förvara maten rått så håller den längre - vetenskapligt underlag om optimal förvaring av livs- medel av R Modin och M Lindblad. 21. Råd om mat för barn 0-5 år. Vetenskapligt underlag med risk- och nyttovärderingar och kunskaps- översikter. 22. Råd om mat för barn 0-5 år. Hanteringsrapport som beskriver hur risk- och nyttovärderingar, tillsammans med andra faktorer, har lett fram till Livsmedelsverkets råd. 23. Proficiency Testing - Food Chemistry, Trace Elements in Food, Round T-23 by C Åstrand and Lars Jorhem.
24. Proficiency Testing - Food Chemistry, Vitamins in Food, Round V-9 by A Staffas and H S Strandler. 25. Nordiskt kontrollprojekt om nyckelhålsmärkning 2011 av I Lindeberg.
26. Rapport från GMO-projektet 2011. Undersökning av förekomsten av GMO i livsmedel av Z Kurowska.
27. Fat Quality - Trends in fatty acid composition over the last decade by I Mattisson, S Trattner and S Wretling.