Spillovers from Higher
Education on Regional
Innovation Propensity
BACHELOR THESIS
THESIS WITHIN: International Economics NUMBER OF CREDITS: 15 ECTS PROGRAMME OF STUDY: International
Economics and Policy
AUTHORS: Ludwig Bremberg, Pierre Carstensen JÖNKÖPING May 2017
Bachelor Thesis in Economics
Title: Spillovers from Higher Education on Regional Innovation Propensity
Authors: Ludwig Bremberg and Pierre Carstensen
Tutor(s): Johan Klaesson, Orsa Kekezi
Date: 2017-05-22
Key terms: Innovation, Vocational Education, Higher Education, RIS, Knowledge Production Function, Accessibility, Human Capital, Patents
Abstract
The purpose of this study is to investigate the effect of accessibility to higher education on innovation propensity. The study includes two forms of higher education – university/college and vocational. A reason for this is that although the relationship between accessibility to higher education and innovation propensity has been investigated many times over the recent years, there is a lack of research on the implications that the vocational education system has. The dependent variable representing innovation is patent grant counts for every municipality in Sweden between 2002 and 2013. By following the theoretical bases of Regional Innovation Systems, human capital and accessibility, we estimate two negative binomial regressions in a knowledge production function setting. Significant and positive effects are found for all of our explanatory variables, suggesting that access to both universities and vocational education has a positive effect on regional innovation propensity, although in different degrees. As access to education may increase people’s level of economically useful knowledge and human capital, we suggest that policies should be applied to support this access.
Table of Contents
1
Introduction ... 1
1.1 Purpose ... 32
Theoretical Framework ... 4
2.1 Human Capital ... 4 2.2 Accessibility ... 52.3 Regional Innovation Systems ... 7
2.4 Knowledge Production Function ... 9
3
Data, Empirical Models and Method ... 11
3.1 Data resources ... 11 3.2 Accessibility Measures ... 12 3.3 Empirical Models ... 13 3.4 Variables ... 14 3.4.1 Dependent Variable ... 14 3.4.2 Explanatory Variables ... 15
4
Empirical Results and Analysis ... 16
4.1 Empirical Results ... 18
4.2 Empirical Analysis ... 18
5
Conclusion ... 21
6
References... 23
Figures
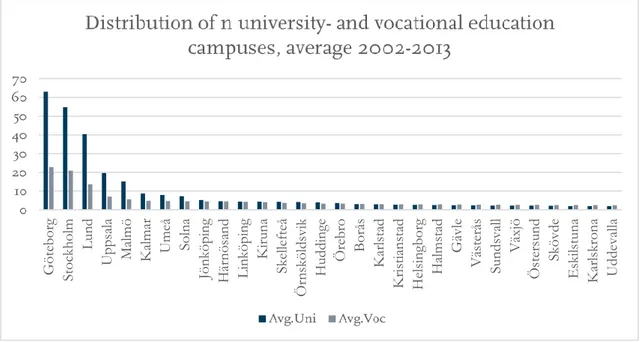
Figure 1 - Distribution of higher education campuses across Sweden... 19
Tables
Table 1 - Categories of time-distance ... 12Table 2 - Summary of variables. ... 14
Table 3 - Descriptive statistics ... 17
Table 4 - Estimation outputs. ... 18
Table 5 - Correlation matrix, Universities ... 27
Table 6 - Correlation matrix, Vocational Education ... 27
1
Introduction
In this study, we investigate the spillover effects that accessibility to higher education (including vocational education) has on innovation. The importance of innovation on economic development has been a subject of large interest through the years. The underlying reasons for how technological improvements and knowledge affect economic growth have been developed in many models with different views – treating them as exogenous (e.g. Solow (1956)) or endogenous (e.g. Romer (1990)) factors of economic growth. No matter the view upon the significance of knowledge and technology for economic development, empirical evidence leads to a common consensus that innovation is a driving force of economic growth (Howells, 2005). Although innovation as a concept is quite broad, it is defined by OECD (2005, pp. 46) as an “implementation of a new of significantly improved
product…new process, new marketing method, or a new organizational method in business practices…” A
measure that partly correspond to that definition is patent grants as a proxy for innovation. Although it is an arbitrary way of measuring innovation, patent grants seem to be the closest link to innovation from current accessible data. We regress workforce-related data, education levels and accessibility to the different types of higher education on patent counts, using data of all 290 municipalities in Sweden across a time-span of 12 years. We have chosen to include both university- and vocational education in our study for several reasons. While there is a large field of research regarding universities effect on innovation, there is a surprisingly stark lack of any research on vocational education. This separates our paper from similar studies within the same field. Hence, by the time of this paper being written, the empirical findings on vocational education are quite unique.
With vocational education and universities being institutions of education, they are both producers of human capital. Human capital produced due to accessibility to higher education, and its effects on innovation, is what underpins this thesis. The production of human capital is closely linked to innovation and economic development (Benhabib & Spiegel, 1994; Acs, Anselin, & Varga, 1997), and as new knowledge is created from the educational system, the levels of human capital are enhanced. We will specifically focus on the production of higher levels of human capital, i.e. higher education.
The amount of people getting higher education has increased over the past 100 years, simultaneously as accessibility between regions has become much better (Shaw & Allison,
1999). Universities, or rather the access to them has been proven in several studies to have a significantly positive effect on innovation (Fritsch M. , 2002; Jaffe, 1989; Andersson, Quigley, & Wilhelmsson, 2009). Universities engage in innovation-enforcing activities by conducting research, educating people and enhancing the overall levels of human capital. By that, they provide society with higher levels of knowledge, who then in turn have a better chance of implementing technological change (Bartel & Lichtenberg, 1987). Universities may also be seen as attractors of innovative firms and educated people. Firms tend to look towards universities and their laboratories, due to its increasingly economic and commercial relevance (Lester, 2005). It is clear that universities are important contributors to regional innovation and economic development. Yet, there is a lack of research on the implication that the vocational education system has on innovation. Toner (2010) describes innovation studies as a paradox, meaning that even though research has emphasized the fact that mature, low-tech industries account for a large share of R&D expenditure, the studies more or less focus solely on the contribution that highly-skilled labor and managerial occupations (as provided by universities and colleges) has on innovation.
The Vocational Education System provides numerous benefits for people who want to educate themselves at any point after finishing their secondary education. By combining in-school theory and practical learning via internships, the vocational education systems main goal is to match the demand for labor across different industries in Sweden. Since the demand varies over time, so does the vocational education system by providing a broad variety of courses and programs that fits the industry best at a given point in time and space (Swedish National Agency for Vocational Education, 2017). Moreover, Sweden has seen an inflation of education (Statistics Sweden, 2017), in the sense that you generally need a higher education now than you needed earlier for a similar job title. The amount of vocational education available has increased as well because of the higher demand of higher skilled labor (Swedish National Agency for Vocational Education, 2017). The introduction of a learning institution of a university or vocational degree might cause neighboring regions to reap some benefit as well due to knowledge spillovers (Thanki, 1999).
We will make an assumption that helps us to justify the inclusion of vocational education. The knowledge transfer from a vocational education institution differs quite a lot from a university. We assume that the vocational education transfers more tacit knowledge to each individual student, because of the time during their education spent on practical work. This,
in our opinion, would lead to a greater level of tacit knowledge than a university schooling, which does not function in the same way, but rather is very academic and more straightforward, than learning a craft. This tacit knowledge that can be obtained at vocational education may prove important for new products to emerge, because of the intuitive sense of the work one is doing.
Further, the importance of education is suggested through the Regional Innovation Systems framework, which is a regionally specified model. It is designed in a way that accounts for heterogeneity of different regions, to make sure that the innovation system in the region is well specified to the needs and wants. Both university- and vocational education play a crucial role in this specification (Cooke & Morgan, 1998), as they are engaged in local and regional collaboration with innovative firms, however, in different ways. While universities can be seen as important innovation hubs that attract firms that seek to be part of economically favorable surroundings, the implementation of a vocational education campus in a region stems from the industrial need of such an education in the region.
As explained by Acs et al. (2002), new economically useful knowledge is a product that stems from networking and collaboration between different actors. This implies that accessibility to universities may not be the only explanatory variable of how higher education creates knowledge that affect regional innovation propensity. By including both university- and vocational education systems in our study, we will reach further into the different regions of the country. By comparing the spread of university- and vocational education facilities it is clear that the distribution of vocational education campuses is wider, meaning that they are more common in less populated municipalities than university campuses. In 2013, the total count of university- and vocational education campuses where 494 and 355 respectively. However, when excluding the fifteen most populated municipalities, there was 228 vocational education campuses compared to 174 university campuses across Sweden.
1.1 Purpose
We investigate the question: Does accessibility to higher education facilities yield a higher level of
innovation? The reason for this is that we believe that the spillover effects generated by the
mere presence and access to higher education should have a positive effect on the average level of innovation within a given municipality (Andersson & Karlsson, 2004; Fritsch M. , 2002). We will analyze the question with negative binomial regression analysis.
2 Theoretical Framework
2.1 Human Capital
Human capital is a concept that was developed in the beginning of the 19-hundreds in order to clearly define and measure knowledge development in societies. Human capital is not a physical thing, but is rather a measure of human ability. For instance, knowledge and schooling are all parts of human capital. The main producer of human capital is the schooling system, as it provides people with education (Becker, 1994). However, the importance of knowledge production to human capital is not only pertained to formal schooling, but can also be created by on-the-job training. When accounting for these possible sources of knowledge production, Dakhli & De Clercq (2004) find a significant relationship between human capital and the production of patents. Their study provides a good support for the belief that human capital plays a major role in the creation of innovation.
There are good arguments for stating that human capital seems to be a local good, and that regions that foster human capital have a higher standards of living if measured in wage-levels. It would also seem as though when the human capital increases, agents have an easier time meeting relevant people and diffusing, spreading, and indirectly letting knowledge grow. This relationship is assumed to hold for technical innovation as well, once again proving the relationship between human capital and innovation propensity (Rauch, 1991).
The theories of human capital are linked to those of Regional Innovation Systems. Because of the importance of higher human capital to enhance innovation propensity, different regions need different amounts of human capital development. Some regions might need to increase their density of learning institutions, to create a cluster, increasing both human capital and innovation propensity. This is different for every region, as they tend to be quite heterogeneous. Thereby, the production and spread of human capital within a nation and a region is of importance for a regional innovation system.
Gennaioli et al. (2011) argue that education and knowledge produced by regional learning institutions are the prime determining factors of regional development. It seems as the returns of education has been undervalued in the past. It has more implication on company productivity than one might have previously thought. The production of human capital seems to mostly increase development on a regional level rather than a national (Florida, Mellander, & Stolarick, 2008). This would seem to suggest that in order to develop an
innovative national system, all regions must produce human capital. Accessibility towards these locations of knowledge production is thus very important not only for regional development, but also nationally. By providing a good educational system, any region may improve their economic development.
2.2 Accessibility
The general proximity of innovation contributors has a significant relationship on the amount of innovation in a region. The proximity and ease of access facilitates the further discussion and development of any given innovation (Boschma, 2005). Accessibility to higher education is a vital part of distributing knowledge, and in effect innovation propensity. Thus, the relationship between innovation and accessibility is explored to get better understanding of what causes innovation.
When discussing accessibility, several factors that affect it between regions must be accounted for; proximity, nearness, ease of transfer, possibility of interaction, and the possibility of contact with suppliers (Weibull, 1980). By dividing proximity into subcategories; geographical and relational proximity, we can discuss in what way they are important when measuring accessibility. Geographical proximity is a key component of accessibility, as geographical nearness stimulates collaborative networking and knowledge spillovers among firms, within a certain proximity (Baptista, 2000). Relational proximity refers to how formal and informal actors of society share common rules. By doing so, firms and educational institutions may trade knowledge and information more easily and with less uncertainty (Capello, 2001). While the previously mentioned studies have focused on the
proximity between different information hubs, Andersson & Karlsson (2004) chooses to focus
on accessibility between the locations. By letting accessibility be a function of time-distance and
opportunities, it is possible to measure different levels of accessibility across regions. The
reason for using time-distance is the fact that even if the geographical distance between two opportunities, e.g. universities may be the same, it may take longer time to travel to one or the other. By using these concepts we develop our methodology in section 3.2.
By having access to different forms of knowledge, a region may improve their chances of increasing their innovative activities. Different forms of knowledge require different amounts
and ways of communication. By dividing knowledge into explicit and tacit knowledge and assigning what importance they have on innovation, we can better understand why access to all forms of knowledge is important at all levels of society. Explicit information is information that is easier to communicate and transfer to other individuals. Its message can be easily coded and de-coded by the transferor and receiver of the knowledge. Tacit knowledge on the other hand is when the knowledge is harder to articulate, because of the nature of the information (Smith, 2001).
While it is clear that both forms of information creates innovation, explicit knowledge is easier to measure and see the direct effect of. However, tacit knowledge lies behind a great deal of decisions people make every day. It is the decisions we do not think about when undertaking, because we just know how to do it and what the effect will be. The greater your knowledge becomes within any given work area, the more tacit knowledge about it you will gain (Smith, 2001). Tacit knowledge is responsible for innovation as well, and since tacit knowledge is harder to transfer, the knowledge becomes more difficult for rivals to replicate. Firms that have good tacit knowledge towards innovation is thus more likely to create new products (Cavusgil, Calantone, & Zhao, 2003). In order to facilitate tacit knowledge, a good working relationship should be present. When this is the case, communication can be more precise and efficient. To establish such relationships, the accessibility between firms must be high in order for it to develop. The same can be said for explicit knowledge, since you need to be able to access a learning institution in order to get a hold of the explicit knowledge (Cavusgil, Calantone, & Zhao, 2003). Because of the assumption made in the introduction about vocational education being a producer of tacit knowledge, the accessibility to these institutions are of prime importance for this paper due to the nature of tacit information. Tacit knowledge cannot easily be learned by the use of traditional learning methods. More often than not, people need to work more practically with a problem in order to attain the tacit knowledge.
It becomes apparent throughout the collected academic framework that a small secluded region will not evolve a good coherent innovation system because of the restrictions present. If, however, accessibility is more prevalent, it will provide with the lacking resources.
2.3 Regional Innovation Systems
Regional Innovation System (RIS) is a framework generally used to aid the generation of sectorial innovation systems, which is of great interest to this study. To understand it fully, we must have a general understanding of the model which it is based upon, namely the National Innovation System (NIS) (Chung, 2002). NIS functions as a system to develop innovation capabilities within nations. This is done by applying focus on the most important parts for innovation, e.g. educational facilities etc. Although this is done somewhat regionally within the NIS, the outcomes are often inconsistent between regions of a nation (Arbo & Benneworth, 2007). Thus, the need for RIS was suggested, which works like NIS but has a more regional specification. For the purpose of our paper, we focus on the “narrow” definition, which suggests that all innovation comes from technological innovation (Chung, 2002).
The Regional Innovation System was first introduced by Cooke & Morgan (1998) when they realized that in order to progress the economy more efficiently they would need to increase specialization, as opposed to NIS which has a “one size fits all” solution. RIS also implements a system of tutoring to specify the approach further. Cooke & Morgan (1998) states that the tutoring must surface from a level of regional understanding in order to make it specific, only then can the institutions be adapted to the different circumstances in the regions. They also argue that the amount of institutions within a region affects innovation activity, by stating that innovating actors can draw benefit from the increasing amount of assets that arise. This is also a part of RIS, and something that could possibly be visible in our analysis of the gathered data.
The RIS framework is also to an extent shaped by the geographical position of the region. The distribution of new economically useful knowledge is dependent on the regions geographical position, and we can observe that knowledge spillovers have a higher presence where R&D, universities and highly skilled labor is more prevalent. Knowledge spillovers tend to create innovation clusters within the region in which they exist (Audretsch & Feldman, 1996). The importance of geographical positioning is not especially connected to the geological area in which it is placed. Rather, the importance of geographical position is the amount of competitiveness and innovation within a human made environment, i.e. cities or municipalities. The density of these tends to increase innovation (Porter & Stern, 2001).
It is also argued that even though local clusters produce a lot of innovation, it is dependent upon “pipelines” of information from different regions to prosper. They need some access to non-local information to complement the current knowledge within the cluster, in order to create innovation. Many knowledge intensive businesses require lines of communication outside of their region to function as efficiently as possible. The R&D sectors of different industries needs to have communication to build upon each other’s ideas and create new innovations. However, they still need access to geographically locked assets as e.g. educational institutions to maximize innovation. That’s why clusters form in certain geographical areas (Asheim & Gertler, 2005).
Moreover, the RIS framework is important for our study due to its increased focus on educational institutions. Universities and research facilities are clearly seen as the main components of the model (Arbo & Benneworth, 2007). It is stated by Cooke & Morgan (1998) that a successful RIS is one that encourages learning in all the economic levels of society. Universities both creates and distributes research in the region. The greatest contribution to knowledge is education itself, but education and research also contribute to the private sector, by interacting with companies and their R&D departments. In fact, between 1993 and 1995, 74% of universities in a German study have contributed to research for the private sector - a ratio that differs only slightly in other western countries (Fritsch & Scwirten, 1999).
Another important factor that is often highlighted in previous studies is the fact that university institutions are assumed to be important in the production of innovation (Cooke & Morgan, 1998). There are two main ways that universities affect a region. Firstly by distributing, producing and diffusing knowledge by educating residents of the area, and also by distributing the information and scientific solutions. Secondly, this could aid with specific and expert knowledge and information. Universities also function as a facilitator to transfer the research into practical application (Koschatzky, 2001).
Vocational education has been found to have a unique position in the creation and contribution to research. The contribution is mostly due to technological diffusion. Because of the more practical nature of vocational education and its resulting work, the innovative outcomes may be more indirect. Vocational education may not necessarily lead to innovation of new products or systems, but rather expose problematic parts, and/or suggesting
improvements. Vocational education also works perfectly within the RIS model, since the implementation of vocational school springs from regional demand. By that, it may further specify the system in the region to make sure innovation creation is as efficient as possible (Toner, 2010).
Although, since the conceptualization of the framework other voices have raised concerns about the simplicity of it. The concerns arise from the fact that the first model suggest that universities simply follow the demand for innovation and produces what is needed. However, since this was seen as slightly naïve, some people have suggested a modification, which they call new regionalism (Lovering, 1999), or simply the second wave RIS. In these second wave RIS, the importance of universities is seen from another angle, namely that universities attract resources, and creates suitable environments for innovation, rather than being the prime producers of it (Bathelt, Malmberg, & Maskell, 2004).
2.4 Knowledge Production Function
The knowledge production framework is crucial in researching knowledge spillover effects on innovative activity. The general idea regarding the knowledge production function deals with in- and outputs of research and development (R&D). Introduced by Griliches in 1979, the knowledge production function measures the return of some inputs such as labor, capital and technical knowledge to output. Since then, the model has been altered and improved to fit new research on knowledge as an economic factor and source of innovation. The knowledge production function is thoroughly yet simply expressed by Fritsch (2002), where the model is adapted to explain the elasticities between R&D input and output across different regions in Europe. The setting below of the knowledge production function is the same as Fritsch (2002) uses in his study.
𝑙𝑛 𝑅&𝐷 𝑜𝑢𝑡𝑝𝑢𝑡 = 𝑙𝑛 𝛼 + 𝛽 𝑙𝑛 𝑅&𝐷 𝑖𝑛𝑝𝑢𝑡 + 𝜖
The study finds several results that are highly interesting for our research. First, significant results can be found in all but one of the 11 regions compared in Fritsch’s study, stating that R&D expenditure and employment has a significant effect on the number of patents produced by the respective region. Also, even though the elasticities tend to be higher in more agglomerated areas, there is evidence for relatively high R&D expenditure-to-patents-produced elasticities in less populated areas (Fritsch M. , 2002).
The importance of spillovers and its effect on regional innovation has also been investigated by Jaffe (1989). By the time of his study, the areas around large technical universities such as Stanford and MIT had already gained the well-deserved reputation of great success in entrepreneurship and innovation, proven by several case studies. He uses the model to measure corporate patents (as a proxy for innovation) as a function of corporate R&D performance and university research across different areas of the United States, and across different industrial sectors. Evidence is found of the importance of university research to regional innovation. He cautiously concludes, after controlling for population and economic activity that the significant results found in his estimations proves that university research has an attractive effect on local R&D, and an augmenting effect on productivity. Jaffe et al. (1993) explains that differences in regional levels of innovation are often explained by how agglomerated the region is. Firms that reside in these areas will either with or without intention utilize localized knowledge spillovers, which are argued to increase returns. Acs et al. (2002) explains how knowledge flows through innovation systems, which is a mix of networks of innovative companies, research organizations and institutional factors. Ponds et al. (2009) and Breschi & Lissoni (2003, 2006) stress the importance of formal and informal networking between individuals and organizations to knowledge spillovers, both on a regional and national scale. Creation of new knowledge stems from collaboration and education, whether it is from formal or informal sources. As collaboration between firms and academic institutions often occur, it must be accounted for when measuring academic knowledge spillovers (Ponds, van Oort, & Frenken, 2009). However, the regional differences in the mix of innovative networks is a strong determinant of the levels of innovation. Acs et al. (2002) finds, by using altered versions of the knowledge production function, that there is a significant positive relationship between local- and regional economic characteristics and patent counts, and that patent counts as a measure of regional innovative activity seems to be a reasonably good fit compared to other ways of measuring it. Ponds et al. (2002) find similar empirical evidence, with addition for the positive effects from collaborative networking over longer distances. These are interesting empirics for this study, since the vocational education system in Sweden heavily resides upon regional demand for industry-specific knowledge. With access to private and public schooling, whether it is at university- or vocational-level, a region may increase its levels of knowledge of economic value, and thus increase its innovative activity.
3 Data, Empirical Models and Method
3.1 Data resources
We have used several different data sources to collect the specific data that was needed to do our analysis. All data collected ranges between years 2002 and 2013.
Data was gathered from Statistics Sweden’s database on the population and the number of university campuses for Sweden’s 290 municipalities. Data on the number of vocational educations in Sweden’s municipalities was gathered from The Swedish National Agency for Higher Vocational Education.
In order to get data on industry-sector related information we collected data from Growth Analysis (Swedish Agency for Growth Policy Analysis). We gathered data about the number
of people working in knowledge intensive business services (KIBS)1 as well as the number
of people working in high-tech manufacturing industries2 from Statistics Sweden. Data about
the amount of people with post-secondary education within any given municipality was
gathered from Statistics Sweden. The data for patent counts in every municipality was
gathered from The Swedish Patent & Registration Office. The measures for local-, regional- and extra-regional accessibility to universities and vocational education was calculated using the functional form(s) provided in the next section.
1 KIBS-industries include: (i) computer and related activities, (ii) research and development, (iii) legal, technical,
and advertising activities (Schricke, Zenker, & Stahlecker, 2012).
2 High-tech manufacturing industries include: (i) pharmaceuticals, (ii) office, accounting, and computing
machinery, (iii) radio, TV, and communications equipment, (iv) Medical, precision, and optical instruments, (v) aircraft and spacecraft (OECD, 2007).
3.2 Accessibility Measures
Klaesson & Johansson (2001) stresses how the time travelled is more important than the distance between the two regions, and if it’s easier to get access to one municipality over another. They divide accessibility into three sub-categories depending on the approximate time distance (see Table 1).
Accessibility Approximate Time Distance Range
Local 5-15 minutes Several unplanned contacts per
day
Intraregional 15-20 min Contacts and travels made on
regular basis (commuting), once per day
Interregional <50 minute Planned contacts, low frequency
There seems to be a threshold of how much one is willing to commute between municipalities, at approximately 45 minutes (Klaesson & Johansson, 2001). After this time distance, people are far more reluctant to commute. The cost-benefit relationship between time-distance and willingness to commute is expressed by Klaesson & Johansson (2001) as below:
ƒ(𝑐𝑖𝑗) = 𝑒𝑥𝑝{− 𝜆 𝑡𝑖𝑗}
Where 𝑡𝑖𝑗 is the time-distance between municipality i and j. λ represents how accessibility
responds to changes in time t. Andersson & Karlsson (2004) utilizes this function in order to distinguish local-, intraregional and interregional accessibilities for any given municipality. Local accessibility: 𝐴𝑖𝑀𝐷 = 𝐷 𝑖𝑒𝑥𝑝{− 𝜆1𝑡𝑖𝑗} Intraregional accessibility: 𝐴𝑖𝑅𝐷 = 𝛴 𝑗∈𝑅−1𝐷𝑗𝑒𝑥𝑝{−𝜆2𝑡𝑖𝑗} Interregional accessibility: 𝐴𝑖𝐸𝐷 = 𝛴 𝑗∈𝑊−𝑅𝐷𝑗𝑒𝑥𝑝{−𝜆3𝑡𝑖𝑗}
The different terms of A represents the different levels of accessibility. W is the set of all municipalities in the current economy, R is a “functional region”, and i, j are nodes for the different municipalities. D represents a measure of opportunities, e.g. educational facilities within a municipality or its surrounding space. These equations will be used when calculating the accessibility measure, with a note that our operators will be called local, regional and
extra-regional accessibility instead.
3.3 Empirical Models
The model used in this study is an altered form of the knowledge production function, where we regress “knowledge inputs” and control variables on “knowledge outputs” i.e. patents. Its functional form(s) are presented below, where Equation 3.1 and 3.2 include accessibility levels to university campuses and vocational education facilities respectively:
𝑃𝑎𝑡𝑒𝑛𝑡𝑠𝑖,𝑡 = 𝛼 + 𝛽1𝑖,𝑡ln(𝐿𝑜𝑐𝐴𝑐𝑐𝑢𝑛𝑖) + 𝛽2𝑖,𝑡ln(𝑅𝑒𝑔𝐴𝑐𝑐𝑢𝑛𝑖) + 𝛽3𝑖,𝑡ln(𝐸𝑥𝐴𝑐𝑐𝑢𝑛𝑖) +
𝛽4𝑖,𝑡𝑑𝑢𝑚𝑙𝑎𝑟𝑔𝑒+ 𝛽5𝑖,𝑡𝐻𝑇𝐸𝐶𝐻 + 𝛽6𝑖,𝑡𝐾𝐼𝐵𝑆 + 𝛽7𝑖,𝑡𝐸𝐷𝑈 + 𝜀𝑖,𝑡
𝑃𝑎𝑡𝑒𝑛𝑡𝑠𝑖,𝑡 = 𝛾 + 𝛿1𝑖,𝑡ln(𝐿𝑜𝑐𝐴𝑐𝑐𝑣𝑜𝑐) + 𝛿2𝑖,𝑡ln(𝑅𝑒𝑔𝐴𝑐𝑐𝑣𝑜𝑐) + 𝛿3𝑖,𝑡ln(𝐸𝑥𝐴𝑐𝑐𝑣𝑜𝑐) +
𝛿4𝑖,𝑡𝑑𝑢𝑚𝑙𝑎𝑟𝑔𝑒+ 𝛿5𝑖,𝑡𝐻𝑇𝐸𝐶𝐻 + 𝛿6𝑖,𝑡𝐾𝐼𝐵𝑆 + 𝛿7𝑖,𝑡𝐸𝐷𝑈 + 𝜐𝑖,𝑡
Time is subscripted as t, while Local-, Regional and Extra-regional accessibility are abbreviated as “LocAcc”, “RegAcc” and “ExAcc”. The proportion of Hightechworkers and KIBSworkers of municipality i’s laborforce has been abbreviated as “HTECH” and “KIBS”, while “EDU” represents municipality i’s proportion of highly educated people per capita. As our dataset is not normally distributed, we cannot use Ordinary Least Squares modelling since normal distribution is one of the basic assumptions of the model. With our dependent variable being over-dispersed count data, (that is, the variance is greater than the mean) the best model to use for our regressions is the negative binomial model (Gujarati & Porter, 2003).
3.4 Variables
In this section we provide information regarding the variables we use in our study.
Type Variable name Variable description
Dependent Patents Number of patents granted per municipality
Independent Local Acc. Uni. Local accessibility to university
education
Regional Acc. Uni. Regional accessibility to university education
Extra-regional Acc. Uni. Extra-regional accessibility to university education
Local Acc. Voc Local accessibility to vocational education
Regional Acc. Voc Regional accessibility to vocational education
Extra-regional Acc. Voc Extra-regional accessibility to vocational education
Hightechworkers Share of laborforce working within High-tech manufacturing KIBSworkers Share of laborforce working within Knowledge intensive business services
EDUpercapita Ratio of post-secondary educated people per capita
dum_large Dummy variable, 1 = population ≥ 100,000 0 = else
3.4.1 Dependent Variable
With our analysis we want to establish what effect accessibility to university and vocational education has on innovation propensity. As our dependent variable we will use patent grants for each municipality between 2002 and 2013 as a proxy of innovation. The reason for using this proxy is that innovation is quite a general term, encompassing all changes in methods, production and products. Since these changes are rarely being recorded simultaneously, it is difficult to achieve full information on innovation via patents. Some firms chose not to protect their inventions by patents, but rather by copyrights or through industrial confidentiality. For some firms or inventors, it may be too costly in monetary or time terms to succeed with a patent application. Although the usefulness of using patents in innovation research is debated, there is a lack of other variables to use that are as accessible and tangible (Watanabe, Tsuji, & Griffy-Brown, 2001; Archibugi & Pianta, 1996).
3.4.2 Explanatory Variables
Local- , Regional- and Extra-regional Accessibility
The purpose of our regressions is to observe how accessibility to higher education affects the number of patents granted within the municipalities. Therefore, we use a measure of accessibility divided into the three different categories (full description in section 2.3). Local accessibility takes into account time-distances of 5-15 minutes. The regional variable accounts for a traveling distance of 15-20 minutes, while extra-regional accounts for a traveling time of less than 50 minutes. Time-distance itself is the average time it takes to travel between some opportunities, which in our model is represented by either university campuses or vocational education facilities. We believe that these set of variables describes accessibility adequately for our regression, although the structure of the data could cause some differences in the coefficients, which will be explored in section 4.
Industry-structure
We choose to include a set of variables to make sure that we control for important factors that could possibly explain patent production, where we control for industry sectors, public educational levels and population. Industry-specific SNI codes we have chosen to gather the correct data are based on specifications from OECD (2007) and Schricke et al. (2012). To control for industry structure across the municipalities, the first variable that we chose to include is called “Hightechworkers”. This variable is the proportion of the number of people working in high-tech manufacturing industries of the total number of workers in a given municipality. The belief is that the greater the proportion of people working within high-tech manufacturing, the more patents a municipality will produce, because of the knowledge intensity of the industry.
A similar reasoning is behind the inclusion of “KIBSworkers”, where KIBS is an abbreviation of Knowledge Intensive Business Services. These are businesses that provide services that need a high amount of knowledge to function. As our theoretical framework suggest, highly educated people seem to bring innovation. However, it is not certain that KIBS industries produce patents in the same manner as high-tech manufacturing industries because of the lack of production in these services. Just like “Hightechworkers”, the variable is divided upon the total labor force to get the correct industry structure of the municipality.
Education
To control for the general education level of a given municipality, or i.e. the general levels of human capital, we have chosen to include “EDUpercapita”. It is a measure of the proportion of the population that has undertaken higher education for more than a year. By including this measure, we may see if the proportion of highly educated people in every municipality has any effect on patent production. The inclusion of this variable is based on the reasoning around knowledge and human capital that suggests that higher human capital produces more innovation (Benhabib & Spiegel, 1994; Acs, Anselin, & Varga, 1997). Thus, the number of people currently possessing knowledge from higher education should be correlated with the patent-output of a municipality.
Population
Lastly, we want to control for the population size of the municipalities regarding patent production. We use a dummy-variable called “dum_large”, which takes on a value of 1 if a municipality has over 100,000 inhabitants or above, and 0 otherwise. The reasoning behind the choice of letting the dummy become active at the 100,000-mark, is that the number of patent grants is highly correlated (at an 80% level) with the size of the population. For municipalities with a population less than 100,000 people, the correlation decreases to 64%. By using this dummy we believe that we can sort out some unwanted collinearity and thus yield a better empirical model.
4
Empirical Results and Analysis
Two separate regressions have been performed, where we have divided the accessibility variables into accessibility to university campuses and vocational education facilities respectively. The reason for this is that some of the accessibility variables are highly correlated across the different types of education facilities. Since our dependent variable, i.e. the number of patents granted in each municipality is count data, we have chosen to use negative binomial regressions. The negative binomial model allows for over-dispersion in the data, meaning that it allows for the variance to be greater than the mean (Hilbe, 2008). Estimation outputs are listed in table 4. Correlation matrices and variance infliction factor estimates is found in Appendix 1.
Listed in table 3 are the descriptive statistics for our variables. It is clear that there is quite large variance in patent counts, as there is a large gap between the mean and the maximum value. This gives us an indication that some municipalities account for a larger share of the total amount of patents granted. In fact, our data shows that the correlation between patents and population resides at 80 %, which leads to the conclusion that more populated municipalities apply for patents at a greater degree. Another interesting variable is the per capita educational levels. The average of 18% should be considered quite high since the denominator includes all members of society between the ages of 16 to 74.
Variable Mean Median Max. Min. Dev. Std. Obs.
Patents 6.55 2 377 0 18.61 3480
Local Accessibility Univ. 0.88 0 60.99 0 4.24 3480
Regional Accessibility Univ. 2.35 0.12 59.44 0 6.8 3480
Extra-regional Accessibility Univ. 0.46 0.25 5.38 0 0.62 3480
Local Accessibility Voc. 0.77 0 22.52 0 1.71 3480
Regional Accessibility Voc. 1.27 0.28 27.97 0 2.78 3480
Extra-regional Accessibility Voc. 0.45 0.37 2.58 0 0.4 3480
KIBSworkers 0.04 0.03 0.29 0 0.03 3480
Hightechworkers 0.01 0 0.19 0 0.02 3480
4.1 Empirical Results
In this part we will discuss the outputs from the two negative binomial regressions. First, we will analyze the main independent variables separately and we will then proceed to the interpretation of the control variables.
Dependent variable: Patents
Specification Regression 1 Regression 2
Local Accessibility Univ. 0.37*** -
(6.96)
Regional Accessibility Univ. 0.29*** -
(11.53)
Extra-regional Accessibility Univ. 0.34*** -
(4.93)
Local Accessibility Voc. - 0.52***
(10.41)
Regional Accessibility Voc. - 0.32***
(8.50)
Extra-regional Accessibility Voc. - 0.32***
(3.43) Dum_Large 0.49*** 0.38*** (4.39) (3.44) Hightechworkers 10.93*** 12.10*** (10.43) (11.21) KIBSworkers 2.57** 2.61** (2.55) (2.68) EDUpercapita 4.91*** 5.38*** (15.80) (17.36) Pseudo R2 0.109 0.108 *p ≤ 0.1; **p ≤ 0.05; ***p ≤ 0.01
Observations for all variables = 3480
The values in parentheses are Z-statistics
4.2 Empirical Analysis
The main independent variables in focus are the accessibility measures. They tell us how the presence and ease of access to higher education affects the amount of innovation (patents). We use three different variables to differentiate and assess which form of access (if any) is the most vital to innovational propensity.
The coefficient estimates are significant and positive in both regressions. As expected, the coefficients for accessibility to universities and vocational education are all positive. The positive signs make sense given our theoretical base that access to higher education, no matter the form, would produce more innovation.
When comparing the regressions we notice some differences between them that are insightful to analyze. Local accessibility to any form of higher education seem to matter the most for municipal patent grants. This follows the consensus that geographical proximity is an important factor of accessibility that enhances knowledge spillovers (Baptista, 2000). While coefficient estimates for regional- and extra-regional accessibility lie close to each other for both regressions, there is a substantial difference in the estimates for the effect local accessibility to higher education has on patent counts. This might lead to an interpretation that access to the vocational education system is more important for innovation than that of university education. However, this may not be the complete explanation. To understand why, we must take a look on the distribution of university- and vocational education campuses across the country.
Figure 1 tells us that there is a steeper decline regarding the average number of university campuses compared to vocational education campuses for our set of data. The total average of university campuses across the country between 2002 and 2013 is 346, while for vocational education campuses it is 301. However, beyond the top 30 entries (i.e. municipalities 31-290)
Gö tebo rg Sto ck ho lm L un d Up ps ala Malm ö K alma r Ume å Sol na Jö nkö pin g Här nö sa nd L in kö pin g K ir un a Sk elle fte å Ör ns kö ld svik Hu dd in ge Ör eb ro Bo rå s K ar ls tad K ri stian stad He ls in gb or g Halm stad Gä vle V äs te rås Su nd sva ll Väx jö Ös ter su nd Sk övd e E skils tuna K ar ls kr on a Ud de va lla
visible in figure 1, the same measure lands on 62 university campuses and 148 vocational education facilities respectively. Entries with a value of 0, i.e. the number of municipalities that have had no higher education campus at all over these years, lands on 149 for university campuses against 105 for vocational education campuses. This means that the vocational education system has a larger geographical spread across the country. The vocational education system tends to have its basis in smaller communities, hence it is more accessible for a large proportion of the population. Along with the fact that municipalities with relatively large populations and greater amount of university campuses are not the lone producer of patents, it gives us an intuition of why the coefficient estimate for local accessibility to vocational education is greater than the same estimate for university campuses. It does not necessarily have to mean that access to vocational education has a greater impact on patents being granted. However, it may mean that while holding all else equal, the average number of patents being granted increases more for any increases in local accessibility to vocational education compared to local accessibility to university education. With the geographical spread of the vocational education system in mind, and the fact that the system is built upon regional demand for industry-specific knowledge, it makes sense according to theory (Ponds, van Oort, & Frenken, 2009; Toner, 2010) that the extensive collaboration that the system engages in creates spillover effects necessary for a positive impact on regional innovation propensity.
The estimates for our control variables are all positive and significant, and there are several interesting observations to be made. The seemingly large coefficient estimate for the proportion of people in a municipality working with high-tech manufacturing tells us that this control is very important to innovation propensity. However, the size of the estimated coefficient stems from the fact that the variable is a ratio measure. Thus, it should be interpreted as a scalar effect. It is reasonable to assume that the larger this proportion is, the larger are the industries and possibly the firms that employ these people. Previous studies (Dosi, 1988; Fisher & Temin, 1973) have shown that the size of a firm tends to correlate with its propensity to invest in R&D. While the general consensus is that R&D investments is positively related to firms innovative activities (Frenkel, Shefer, Koschatzky, & Walter, 2001; Hall, 1996), Zoltan and Audretsch (1993) show a significant difference in the degree of R&D expenditure between high-tech- and more traditional industries which confirms that high-tech industries invest more in R&D. This yields an understanding for our industry sector coefficient estimates – although KIBS has a significantly positive effect on patent
grants, it is not of the same degree as for high-tech manufacturing. Knowledge intensive business services, such as law-, financial- and advertising services do require some degree of knowledge and human capital, but the resulting effect on innovation may be lower due to industry-sector differences in R&D. There may also be a difference in the industries’ ability to record and apply for patents that yields the large difference in the coefficient estimates. The coefficient estimate(s) for the municipal level of highly educated people per capita tells us that the proportion of people with post-secondary education is important for regional innovation. Since the variable includes all people with a post-secondary education undertaken for more than 1 year, it is highly interesting for our thesis. The vocational education system in Sweden offers courses and programs that lasts for 1-2 years, while most university programs last for 3 years or more. Although the variable does not distinguish what length or type of education matters most for innovation, the positive estimate endorses the theory of how schooling and its effect on human capital is vital in the production of innovation (Becker, 1994; Dakhli & De Clercq, 2004).
The dummy variable that differentiates municipalities based on the size of the population is significant in both regressions. If a municipality has 100.000 inhabitants or more, it has a significantly positive effect on innovation propensity compared to the reference group. This follows the evidence provided by e.g. Fritsch (2002) that larger, more agglomerated regions tend to have a higher R&D-expenditure to patent production elasticity. Another reason for the positive sign may be the distribution of university campuses discussed in section 4.2, that universities tend to have its basis in more populated regions of the country.
5 Conclusion
The intention for this study was to find out how accessibility to higher education affects innovation. Our empirical findings suggest a positive significant relationship between a higher rate of accessibility and the production of patents. The values of accessibility are all significant in our regressions, and the coefficients are positive.
Granted, the results show a quite small pseudo R-squared. There is some discussion within academic writing on how to interpret the pseudo R-squared (Zimmermann & Veall, 1996), but if we observe it as a traditional R-squared, we seem to have left out some important variables. However, this paper is not an exception within this field of study to have a low
R-squared. Innovation is a multifaceted subject, and is affected by a great number of variables of which some are impossible to measure, and some are surely still unknown.
The positive result of the accessibility variables can be of importance when trying to further develop a sound innovation system. It is our belief that there should be placed a great deal of importance to the accessibility to higher education institutions, including vocational. We have seen that tacit information is a factor in the creation of patents, something which we need high accessibility for.
In terms of practical application of our thesis, we can note several things that may be of benefit for policy-makers or further research. Regarding the findings of this paper, we would suggest implementing a thorough policy for accessibility towards higher education, as to increase innovational activity. This can be done by lowering the amount of time spent traveling to and from the place of education, or simply implement learning institutions more densely throughout the country, if this is economically feasible.
This is related to the control variable for the proportion of highly educated people across the municipalities that we have used. We can observe that the public level of education is an important variable for innovation to take place. Therefore, it would only make sense that an increase in accessibility to higher education would increase the ratio of highly educated people, and in extension, innovation would increase. Increasing accessibility would thus have an indirect positive effect in the long-run, but also in the short run thanks to the ease of tacit knowledge transfer.
A limitation in this paper is the rather simplified way of measuring innovation, namely, only by measuring the number of patents that are being registered in every municipality. Unfortunately, this task seems to be particularly difficult, as no real suggestion has been made. Complete sets of data on R&D expenditure within all the regions would be preferable. However, all firms are not public, and thus not liable to publish their information, which would lead to skewed data.
An interesting point to be made for further research is the implementation of other forms of accessibility. We are entering an age in which the world is getting increasingly integrated with technology and the internet. How much would a high rate of accessibility to higher education online change innovation in a society? Could the positive effects of virtual accessibility offset the need for good physical accessibility?
6 References
Acs, Anselin, & Varga. (1997). Local Geographic Spillovers between University Research and High Technology Innovations. Journal of Urban Economics 42, 422-448.
Acs, Z., & Audretsch, D. (1993). Analysing innovation output indicators: The US experience. In New
concepts in innovation output measurement (pp. 10-41). Palgrave Macmillan UK.
Andersson, M., & Karlsson, C. (2004). The Role of Accessibility for the Performance of Regional Innovation Systems. In C. Karlsson, P. Flensburg, & Å. S. Hörte, Knowledge
Spillovers and Knowledge Management (pp. 283-308). Cheltenham: Elgar, Edward.
Andersson, R., Quigley, J. M., & Wilhelmsson, M. (2009). Urbanization, productivity and innovation: Evidence from Investment in Higher Dducation. Journal of Urban
Economics.
Arbo, P., & Benneworth, P. (2007). Understanding The Regional Contribution of Higher Education Institutions: A Literature Review. OECD Education Working Papers, 73. Archibugi, D., & Pianta, M. (1996). Measuring technological change trough patents and
innovation surveys. Technovation 16(9), 451-468.
Asheim, B. T., & Gertler, M. S. (2005). The Geography of Innovation: Regional Innovation Systems. In J. Fagerberg, D. Mowery, & R. Nelson, The Oxford Handbook of Innovation (pp. 291-317). Oxford: Oxford Univercity Press.
Audretsch, D. B., & Feldman, M. P. (1996). R&D Spillovers and the Geography of Innovation and Production. The American Economic Review, 630-640.
Baptista, R. (2000). Do Innovations Diffuse Faster Within Geographical Clusters?
International Journal of Industrial Organisation, 515-535.
Bartel, A. P., & Lichtenberg, F. R. (1987). The Comparative Advantage of Educated Workers in Implementing New Technology. The Review of Economics and Statistics, Vol. 69, No.
1, 1-11.
Bathelt, H., Malmberg, A., & Maskell, P. (2004). Clusters and knowledge: local buzz, global pipelines and the process of knowledge creation. Progress in Human Geography, 31-56. Becker, G. S. (1994). Human Capital Revisited. In G. S. Becker, Human Capital: A Theoretical
and Empirical Analysis with Special Reference to Education (pp. 15-28). Chicago: The
University of Chicago Press.
Benhabib, J., & Spiegel, M. M. (1994). The role of human capital in economic development evidence from aggregate cross-country data. Journal of Monetary Economics, 143-173.
Boschma, R. (2005). Proximity and Innovation: A Critical Assessment. Regional Studies, 61-74.
Breschi, S., & Lissoni, F. (2003, May). Mobility and Social Networks: Localised Knowledge Spillovers Revisited. WP n. 142.
Capello, R. (2001). Urban Innovation and Collective Learning: Theory and Evidence from Five Metropolitan Cities in Europe. Advances in Spatial Science, 181-208.
Cavusgil, T. S., Calantone, R. J., & Zhao, Y. (2003). Tacit knowledge transfer and firm innovation capability. Journal of Business & Industrial Marketing, 6-21.
Chung, S. (2002). Building a national innovation system through regional innovation systems.
Technovation, 485-491.
Cooke, P., & Morgan, K. (1998). The Associational Economy: Firms, Regions, and Innovation. Oxford: Oxford University Press.
Dakhli, M., & De Clercq, D. (2004). Human capital, social capital, and innovation: a multi-country study. Entrepreneurship & regional development, 16(2),, 107-128.
Dosi, G. (1988). Sources, Procedures, and Microeconomic Effects of Innovation. Journal of
Economic Literature Vol. 26, No. 3, 1120-1171.
Fisher, F. M., & Temin, P. (1973). Returns to scale in research and development: what does the schumpeterian hypothesis imply? Journal of Political Economy Vol. 81, No. 1, 56-70. Florida, R., Mellander, C., & Stolarick, K. (2008). Inside the black box of regional development - human capital, the creative class and tolerance. Journal of Ecnomic
Geography, 615-649.
Frenkel, A., Shefer, D., Koschatzky, K., & Walter, G. H. (2001). Firm characteristics, location and regional innovation: a comparison between Israeli and German industrial firm.
Regional Studies Vol. 35, 415-429.
Fritsch, M. (2002). Measuring the Quality of Regonal Innovaton Systems: A Knowledge Production Function Approach. International Regional Science Review 25:86, 86-101. Fritsch, M., & Scwirten, C. (1999). Enterprise-University Co-operation and the Role of
Public Research Institutions in Regional Innovation Systems. Industry an Innovation, 69-83.
Gennaioli, N., La Porta, R., Lopez-de-Silanes, F., & Shleifer, A. (2011). Human Capital and
Regional Development. Cambridge: national Bureau of Economic Research.
Griliches, Z. (1979). Issues in assessing the contribution of research and development to prouctivity growth. The Bell Journal Of Economics, 92-116.
Hall, B. (1996). The private and social returns to research and development. . Technology,
R&D, and the Economy, 140-162.
Hilbe, J. M. (2008). Negative Binomial Regression. New York: Cambridge University Press. Howells, J. (2005). Innovation and regional economic development: A matter of perspective?
Research Policy 34, 1220-1234.
Jaffe, A. B. (1989). Real Effects of Academic Research. The American Economic Review, Vol. 79,
No. 5, 957-970.
Jaffe, A. B., Henderson, R., & Trajtenberg, M. (1993). Geographic localization of knowledge spillovers as evidenced by patent citations. Quarterly Journal of Economics, 577-598. Klaesson, J., & Johansson, B. (2001). Förhandsanalys av Förändringar i Transport- och
Bebyggelsesystem. Jönköping: Jönköping International Business School.
Koschatzky, K. (2001). Innovation Networks: Concepts and Challenges in the European Perspective . Karlsruhe: Springer-Verlag Company.
Lester, R. K. (2005). Universities, Innovation and the Competetiveness of Local Economies - A Summary
Report from the Local Innovation Systems Project - Phase I. Cambridge: MIT.
Lovering, J. (1999). Theory Led by Policy: The Inadequacies of the ‘New Regionalism’ (Illustrated from the Case of Wales). International Journal Of Urban And Regional
Reasearch, 379-395.
OECD. (2007). Technology and Industry Scoreboard - Innovation and Performance in the Global
Economy. OECD Publishing.
OECD; Eurostat. (2005). Oslo Manual - Guidelines for collecting and interpreting innovation data. Paris: OECD Publishing.
Ponds, R., van Oort, F., & Frenken, K. (2009). Innovation, spillovers and university–industry collaboration: an extended knowledge production function approach. Journal of
Economic Geography, 1-25.
Porter, M. E., & Stern, S. (2001). Innovation: Location Matters. MIT Sloan Management Review, 28.
Rauch, J. E. (1991). Productivity gains from geographic concentration of human capital: evidence from the
cities. Cambridge: National Bureau of Economic Research.
Romer, P. M. (1990). Endogenous technological change. Journal of Political Economy 98, 71-102.
Schricke, E., Zenker, A., & Stahlecker, T. (2012). Knowledge-Intensive (Business) Services in Europe
Shaw, J., & Allison, J. (1999). The Intersection of the Learning Region and Local and Regional Economic Development: Analysing the Role of Higher Education. Regional
Studies, 896-902.
Smith, E. A. (2001). The role of tacit and explicit knowledge in the workplace. Journal of
Knowledge Management, 311-321.
Solow, R. M. (1956). A contribution to the theory of economic growth. The quarterly journal of
economics, 70(1), 65-94.
Statistics Sweden. (2017, April 05). Registrerade studenter efter läsår och kön 1977/78–2015/16.
Retrieved from SCB.se:
http://www.scb.se/hitta-statistik/statistik-efter- amne/utbildning-och-forskning/hogskolevasende/studenter-och-examina-i- hogskoleutbildning-pa-grundniva-och-avancerad-niva/pong/tabell-och-diagram/registrerade-studenter/registrerade-studenter-efter-lasar-oc
Statistics Sweden. (2017, April 05). Var fjärde i Sverige är högutbildad. Retrieved from SCB.se: http://www.sverigeisiffror.scb.se/hitta-statistik/sverige-i-siffror/utbildning-jobb-och-pengar/befolkningens-utbildning/
Swedish National Agency for Vocational Education. (2017, April 23). Yrkeshögskolan. Retrieved from Swedish National Agency for Vocational Education: https://www.myh.se/Verksamhetsomraden/Yrkeshogskolan/
Swedish National Agency for Vocational Education. (2017, 02 21). Årsrapport 2015. Retrieved
from www.myh.se:
https://www.myh.se/Documents/Publikationer/Aterrapporteringar/Arsrapport20 15/Arsrapport-2015.pdf
Thanki, R. (1999). How do we know the value of higher education to regional development?
Regional Studies; Cambridge33.1, 84-89.
Toner, P. (2010). Innovation and Vocational Education. The Economic and Labour Relations
Review Vol. 21, 75-98.
Watanabe, C., Tsuji, Y. S., & Griffy-Brown, C. (2001). Patent statistics: deciphering a ‘real’ versus a ‘pseudo’ proxy of innovation. Technovation, 783-790.
Weibull, J. (1980). On the numerical measurement of accessibility. Environment and Planning
A Vol. 12, 53-67.
Zimmermann, K. F., & Veall, M. R. (1996). Pseudo-R2 Measures for Some Common Lmited Dependent Variable Models. Journal of Economic Surveys, 241-259.
7 Appendix 1
Correlation Matrix,
Univ PATENTS KIBSW HIGHTECH EDUPERC LN_LOC LN_REG LN_XREG
PATENTS 1 0.43 0.21 0.39 0.58 0.22 0.04 KIBSW 0.43 1 0.1 0.5 0.58 0.26 0.08 HIGHTECHW 0.21 0.1 1 0.15 0.12 0.12 0.13 EDUPERC 0.39 0.5 0.15 1 0.62 0.36 0.07 LN_LOC 0.58 0.58 0.12 0.62 1 0.14 0.06 LN_REG 0.22 0 .26 0.12 0.36 0.14 1 0.1 LN_XREG 0.04 0.08 0.13 0.07 0.06 0.1 1 Correlation Matrix,
Vocational PATENTS KIBSW HIGHTECH EDUPERC LN_LOC LN_REG LN_XREG
PATENTS 1 0.43 0.21 0.39 0.42 0.22 0.02 KIBSW 0.43 1 0.1 0.5 0.46 0.28 0 HIGHTECHW 0.21 0.1 1 0.15 0.09 0.11 0.14 EDUPERC 0.39 0.5 0.15 1 0.49 0.38 0.03 LN_LOC 0.42 0.46 0.09 0.49 1 0.13 0.09 LN_REG 0.22 0.28 0.11 0.38 0.13 1 0.16 LN_XREG 0.02 0 0.14 0.03 0.09 0.16 1
Variables (Universities) VIF 1/VIF Variable (vocational) VIF 1/VIF ln(Local Accessibility) 2.60 0.38 EDUpercapita 1.85 0.54 EDUpercapita 1.96 0.51 ln(Local Accessibility) 1.61 0.62
Dum_large 1.84 0.54 Dum_large 1.55 0.64
KIBSworkers 1.63 0.61 KIBSworkers 1.50 0.66
ln(Regional Accessibility) 1.23 0.81 ln(Regional Accessibility) 1.27 0.79 Hightechworkers 1.05 0.96 ln(Extra-regional Accessibility) 1.07 0.93 ln(Extra-regional Accessibility) 1.03 0.97 Hightechworkers 1.05 0.95