Subtly Influencing Gaze Direction
Using a Handheld Augmented Reality
Device
Sofia Larsson
Jimmy Åkesson
Major: Computer Science
Degree: Bachelor of Science, 180 credits
Specialization: Computer Application Development Date of Opposition Seminar: 3rd June 2019
Supervisors: Thomas Pederson, Alberto Alvarez Examiner: José M. Font
Abstract
Smart and helpful technologies are released every year and are quick to become part of our everyday lives. Technologies are becoming more aware of when and where we need them and help us to achieve personal goals, such as taking the bike instead of the car to work. Still, many of these smart technologies have only limited functionality without us interacting with them, resulting in us having to interact with them and losing focus on other tasks.
We believe that a decade from now, some future application interfaces will reside in augmented reality smart glasses. While augmented reality can be a powerful tool when overlaying the real world, we also wish that the augmented reality interfaces do not break the immersion of everyday life.
In this study, we have explored the possibilities of sending visual cues to a user in a subtle or even a subliminal way in an augmented reality setting. In conclusion, there is no obvious answer to whether a cue in the system that was implemented in this study was subliminal. However, we found that the time it took to perceive a cue that gradually intensifies with time differed between people and that people are more inclined to focus on objects placed at an eye-level height which should be taken in consideration when deciding on where to place visual cues.
Keywords: eye-tracking, gaze direction, augmented reality, augmented reality
Sammanfattning
Smarta och hjälpsamma teknologier kommer ut varje år och blir snabbt en del av vår vardag. Teknologierna blir mer och mer medvetna om när och var vi behöver dem och stödjer oss i att nå personliga mål såsom att ta cykeln istället för bilen till jobbet. Dock har dessa teknologier begränsad funktionalitet när vi inte interagerar med dem, vilket resulterar i att vi behöver interagera med dem och förlorar fokus från andra uppgifter.
Vi tror att det ett decennium fram kommer att finnas enkla applikationsgränssnitt i glasögon med förstärkt verklighet (AR-glasögon). Förstärkt verklighet kan vara ett kraftfullt verktyg för att skapa ett skikt över den riktiga världen så önskar vi också att gränssnitten inte stör upplevelsen av den riktiga världen.
I denna studie har vi undersökt vilka möjligheter det finns i att skicka visuella stimuli till en användare på ett subtilt eller subliminalt sätt. Slutsatsen är att det inte uppenbarligen går att säga att det visuella stimuli i systemet som implementerades i denna studie var subliminalt. Dock så kunde vi dra slutsatsen att tiden det tar att upptäcka ett visuellt stimuli som gradvis ökar med tiden skiljer sig mellan användare och att användare är mer benägna att fokusera på objekt som är placerade i ögonhöjd, vilket bör beaktas när man ska bestämma vart visuella stimuli ska placeras.
Table of contents
Introduction 1
1.1 Objective 2
1.2 Research Question 2
2. Related work 3
2.1 Subtle and subliminal cueing 3
2.2 Gaze Direction 4
2.3 Augmented Reality 5
3. Method 6
3.1 Design and creation 6
3.2 Experiment 7
4. Design 7
4.1 Tools 7
4.1.1 Game engine 7
4.1.2 AR SDK 8
4.1.3 Mobile handheld device 8
4.2 Prototyping process 9
4.2.1 First iteration - getting familiar with Unity and ARCore 10 4.2.2 Second iteration - Designing the visual cue 11
5. Experiment 14 5.1 Participants 14 5.2 Experimental Design 14 5.3 Setup 14 6. Results 16 7. Analysis 20 7.1 General analysis 20 7.2 Object placement 21
7.3 Intensity of the cue 22
8. Discussion 23
8.1 Design of the cue 23
8.2 Object and cue placement 24
8.3 Ethics of subtle and subliminal cues 24
9.1 Future work 25
References 27
Appendix A 29
1
Introduction
Consider technologies without intrusive cues: Technologies that do not break your immersion in the experience of what you are currently doing. Could we design technologies in a way that when they cue us, that it happens in such a subtle way that we feel that the idea could have just as well have formed in our minds? It has been almost 30 years since Mark Wieser [1] awoke the idea of technologies that vanish into the background and as he said: “weaves themselves into the fabric of everyday life.” Still, we (the authors of this thesis) think that we are more intruded by our technologies than ever before.
A growing trend in the area of ubiquitous computing is persuasive technologies [2]. Persuasive technologies attempt to change a user’s behavior in some way. There are various design strategies to persuade a user; however, many of these strategies rely on the user being aware of the manipulation [3]. The conclusion is that this can limit the impact of the changes to the user's behavior [3]. An example of persuasive technology is applications that encourage physical activity. These applications are either actively managed by the user, for instance, using running applications that need the user to activate them when starting the running activity, or more passively managed applications as pedometers that measure the users daily step count [4]. Could it be possible to change a user’s behavior without relying on the user's actively conscious decisions? Our suggestion is to use subtle cues which could create opportunities to persuade a user to change the user's behavior. For instance, a user could have a long-term goal of using the bicycle instead of taking the car to work. Could a subtle cue then work as a reminder and make the user take one extra glance at the bicycle and trigger a memory recollection of the long-term goal? While we can not say for sure that directing a user’s gaze would make the user more prone to fulfill his or her long-term goal, we do believe that directing the gaze could be a good start to investigate whether such an effect can be generated.
We believe that overlaying or enhancing objects in the real world with virtual information, commonly known as augmented reality, would be a suiting technique for implementing subtle cues. With augmented reality smart glasses (ARSG) that are growing in popularity over the recent years [5], we think that it is even more convenient and safe to assume that augmented reality will soon be a common medium and will gradually inherit tasks which are today managed by a smartphone. In this paper, we investigate how a user’s gaze direction can be directed to a digitally generated 3D object that is projected in the real world. We also explore how this can be done subtly, and if the cue needs to differ in intensity to be perceived as subtle amongst different users. To answer this, we have developed an augmented reality mobile application which generates 3D augmented objects that are generating subtle visual cues.
2
1.1 Objective
In this thesis, we make attempts to subtly impact a user’s gaze direction with subtle visual cues in an augmented reality environment. Additionally, we explore if the subtle visual cue has the possibility of being perceived subliminally. We also examine the difference in time between users to react to the visual cue.
1.2 Research Question
Due to the way that the problem of this study is described, the first research question (RQ1) is defined as:
To what extent is it possible to direct a user’s gaze with subtle or subliminal visual cues to a digitally projected 3D object displayed on a handheld AR-capable mobile device in a real-world environment?
Assuming that RQ1 is found to be largely possible, the second research question (RQ2) is defined as:
What kind of visual cues can be used with AR implemented on a handheld mobile device platform?
3
2. Related work
The related work review covers three areas: subtle and subliminal visual cueing, augmented reality, and gaze direction detection. All these areas are of relevance for the development of our artefact for this thesis.
Figure 2.1: A Venn diagram showing the areas
of interest for the related work in this chapter.
2.1 Subtle and subliminal cueing
Subliminal is defined as “below the threshold” [6], meaning something that is below the conscious threshold, or below the threshold for something measurable or detectable [6]. If a stimulus is below the threshold of a person's conscious awareness, it is considered subliminal [7]. The investigation of subtle and subliminal stimuli has seen an increase among psychologists in recent years [8]. The impact of subliminal stimuli has been evaluated for a long time by researchers, and there has been evidence that subliminal stimuli can affect behavior [3]. Besides scientific knowledge, there are also many myths regarding subliminal communication and incentives, especially as a potential application in advertisements. Some unknowing moviegoers in New Jersey USA were during a movie screening asked to drink Coca-Cola and eat popcorn in the printed text that was superimposed on the movie being shown. The messages were shown during such a brief time that the viewers were not aware of the text. The marketing firm responsible for the subliminal message reported an increase in sales of Coca-Cola and popcorn but failed to show any documents of the fact [2]. Several attempts have been made by human-computer interaction researchers to create meaningful applications that use subliminal information presentation. McNamara, Baily, and Grimm created a program to aid a user when searching for several objects in pictures of different room environments. The program gives subtle modulations on the image where the objects to be found are located. The experiment used three groups, no modulation, subtle modulation, and obvious modulations to see if there was any difference in the subjects ability to
4
find all the objects in the image. The result of the study showed that both subtle and obvious modulation gave an increase in accuracy for the users, and the difference between subtle and obvious modulations was without any significant difference [9]. Different projects have tried to create tools to help users of an interactive system with subliminal information or instructions. Several of these projects have created practical applications that generate a positive effect on the user [10]. One example of such a tool was developed by DeVaul, Pentland, and Corey using wearable glasses that projected information subliminally in what they described as “just in time” memory support. The glasses helped the user with names of people by showing it subliminally in front of the users while they were looking at cards of people [11]. Kelly believes that four things can be seen in most of these studies. First, all of the studies goals is to provide help and support to the user by subliminal cueing. This shows that contrary to popular belief that subliminal cueing is something negative, researchers show that subliminal cueing can also be used for good. Second, the studies Kelly had referred to all delivered subliminal information when the user really needed it. It seems that subliminal cueing is most effective when it is timely. Third, all the users were involved in a highly cognitively demanding task when the subliminal information was presented. This, according to Kelly, could show that subliminal cues could help by easing the burden of a high cognitive load for the user. Fourth, it seems that subliminal cueing are most helpful when the user has a related goal. In all the studies, Kelly mentions the users completes a task with a set goal at the time of the subliminal cue [10].
2.2 Gaze Direction
The mental processes of a person's underlying behavior can be divided into two categories, System 1 and System 2 [12]. Kahneman states that System 1 is the part of the brain that makes quick, automatic decisions that require little effort while System 2 is slow, effortful, and works in a controlled fashion. When a person is thinking about conscious decisions like going to the gym, they are using System 2, while unconscious decisions like doing a face when confronted by something that upsets use System 1 [12]. Both these systems are communicating with each other where System 1 is giving suggestions to System 2 by feelings and impressions, and System 2 then makes decisions based in some part of this information [12]. When trying to subtly change the gaze direction of an individual you use the fact that system 1 will pick up the cue and force the brain to focus on it to enable system 2 to process the information gathered [12]. The person's peripheral vision process stimuli more quickly than the foveal vision, and this is what subtle gaze direction is dependent upon [9]. When a person is viewing a scene for the first time, the low sharpness of the peripheral vision locates interesting areas and involuntarily draws the foveal vision of the person to those areas [9]. To force a person's focus on a certain point of interest, a subtle modulation is added to an area in the person's peripheral vision. This modulation causes the eye to involuntarily move to focus the foveal vision on the area to identify the detected stimuli [9]. This involuntary eye movement is called a saccade. When a person is observing a scene, the eye moves from focus to focus. The ballistic movement of the eye when moving from one focus point to the next is a saccade [13].
5
Another way, which is commonly directing a user’s gaze in 2D images is by using the effect from traditional photography where the object of interest is in focused while the background is blurred [14].
2.3 Augmented Reality
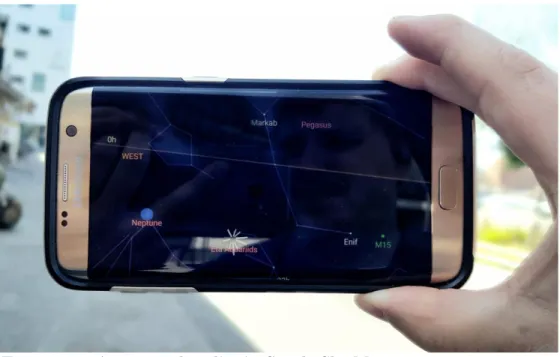
A definition of AR (Augmented Reality) is a system of virtual objects that are projected seamlessly into the real world. Azuma [15] defines an augmented reality system by three characteristics: it combines real and virtual elements; it is interactive in real time, and it is registered in a three-dimensional (3D) way. A probably more well-known example of AR from science fiction would be R2-D2’s projection of Princess Leia in Star Wars. There are also some known real-world examples of AR such as Google’s Sky Map that is an AR smartphone application that enables users to point their phone at the sky and see virtual projections of stars, constellations, and planets in real time.
Figure 2.2: Augmented reality in Google Sky Map.
Making convincing AR applications does have its challenges. The key essentials to make an AR application convincing is precise tracking position of the user, along with the virtual and physical objects in the AR environment [16].
Previous studies have also shown that novice players have difficulties learning game rules in AR applications [17]. While augmented elements that could deliver information to an area of a players view, such as a mobile screen, may overpopulate the view and lead to clutter and weaken the immersiveness of the game [18].
6
3. Method
To answer the research questions, we needed to create an AR environment in which the visual cues were implemented and evaluated. We developed a mobile application with AR implementation; the application was then used as a tool to conduct the experiment in which we observed user behavior when exposed to subtle visual cues.
3.1 Design and creation
In information systems research, it’s common to develop, design, or analyze IT-products or so-called artefacts [16]. A common research methodology for developing artefacts is design and creation. Design and creation can be used as the sole method in a study, but as researchers often want to test the artefact on real people or measure its performance, it is often mixed with other methods such as an experiment [11]. March and Smith [17] wrote that design and creation consist of two activities: building and evaluating. They explained that building is the process of constructing an artefact for a specific purpose and that evaluation is the process of determining how well the artefact performs. According to March and Smith [17], the construction of an artefact can have an outcome of one of or be a mix of these following types: ● Construct: an artefact is the main focus of the research project and is per se
a contribution of knowledge.
● Model: an artefact aids in solving or understanding another contribution to knowledge than the artefact itself.
● Method: an artefact is developed, but the interest of the research projects is on the development process.
● Instantiation: is the realization of an artefact, i.e., it demonstrates the construct, model, or method in its environment.
In this research project, we constructed an artefact that was a model, which was an AR application that aided us in performing the experiment and answering our research question RQ1. To develop the artifact, we used an iterative design process, which is deeper described in Section 4.2. In the process of developing and evaluating the artefact, we naturally found answers to RQ2 since we had to try to generate different types of visual cues. An appropriate way to plan and conduct our construction of the artefact, as well as to answer our research questions was by following the prototyping method. The reason why this approach was advantageous to our research project was that it was reassuring to have some parts of the system implemented in the early stages while waiting for other necessary parts which would be implemented in later iterations.
To be able to perform our experiment, we had to develop our artefact. We did not utilize any existing solution because we could not find anything that let us customize an appropriate environment for the experiment. In addition to that, we found that building a system to our satisfaction gave us learning experience and a deeper knowledge of how visual stimuli can be used in an AR environment.
7
3.2 Experiment
To answer RQ1 which questions cause and effect, i.e., the ability to influence users gaze-direction with visual cues, we chose an experiment as a strategy. A type of experimental design is pre-experimental design (in some cases, also called a pilot study), which is widely used in information systems [19]. It can be implemented as a one-shot case study, which does not have a control group. Instead, the studied instance is compared to what would have happened if the independent variables were not introduced [20]. Pre-experimental designs are useful in situations where it is not possible to do a true experiment, where the restraints are such as limited time, small resources, and a low number of participants [21].
One could argue that RQ1 could be investigated by simple observation as a data generation method, but we chose the experiment strategy because we needed to have control over variables. It’s also important to point out that we were aware of the limitations of the pre-experimental design which are the threat to the internal validity of the results, as well as the external validity and generalizability since samples are not representative [19]. Although, as mentioned before they are commonly used in information systems research and are acceptable for exploratory research projects [19]. Additionally, a pre-experimental design was a suitable approach for our research project because of the time frame, cost, and resource limitations.
4. Design
The artefact is a mobile AR application, running on a Samsung Galaxy Tab S4, that projects holographic objects on a tabletop. The tools used to create the artefact was the AR software development kit (SDK) Google ARCore for Unity [22], which we utilized to make front-end holographic designs in the game engine Unity, and the scripting language C# for back-end game processing logic, for which we used C# as the scripting language.
4.1 Tools
Before starting the development of the artefact, we explored tools which could be used to create an AR environment on a handheld mobile device. As we had no previous experience with any tools for creating AR or digital 3D artefacts, we decided to choose building tools that were well documented and which had the easiest entry learning-level.
4.1.1 Game engine
When deciding which game engine (GE) to use for development of our artefact we chose between two of the most well-known and popular GE’s, and the ones that are most used in game development classes [23]: Unity and Unreal. Unity is popular when developing mobile games, while Unreal is well-known for being used to develop stunningly looking major titles [23]. Unity and Unreal are much alike, providing many features and a complete development environment, but use different scripting languages for back-end game processing logic. Unity has support for C# and JavaScript while Unreal has C++ and a visual scripting language called Blueprints.
8
Since Unity is known for being popular in mobile game development, and that we mostly had prior experience with C# meant that we naturally favored Unity because we wouldn't have to spend time learning a new scripting language as well as an unfamiliar GE.
4.1.2 AR SDK
To implement the mobile AR environment, we chose between two well-documented and popular AR SDKs that would work on an Android device: Google’s ARCore and Vuforia. By reading online forums and consulting with associates, we gathered that: Vuforia has the advantage that it can run on both Android and iOS, while ARCore only runs on Android. ARCore, on the other hand, it has more advanced techniques such as surface and light condition recognition, motion tracking, and object anchoring. Due to the mentioned reasons, since we only required the application to run on an Android device, and because of our personal experience and satisfaction with other developer tools from Google, we conveniently chose to work with ARCore.
4.1.3 Mobile handheld device
We aimed to design an AR environment in which holographic projections make users behave as if the projections resided in the real world. Tonkin et al. [24] studied users performance in visual search tasks in a physical environment compared to when looking at the same environment that was virtually projected on a wall. Their results showed that users performed significantly better when doing a visual search in a physical environment. According to them, the main reason for the time difference may have been because of the fidelity of the virtual projections. In another study made by Tonkin et al. [24], they investigated the performance of visual search on images projected on a large canvas compared to images showed on a laptop screen. Results were that the larger canvas resulted in faster visual search time than search on the smaller laptop display. They concluded that projections that are made on large and high-fidelity screens seem to approach real-life behavior most. Therefore, we decided to execute our artifact (mobile AR application) on the largest mobile screen, with the highest resolution that we could obtain.
Since we decided to use ARCore for projecting holographic objects and therefore were limited to execute our artifact (mobile AR application) on an Android tablet, we started by reviewing a list of ARCore supported devices [25]. For a device to be supported, it means that it has pass ARCores certification process. To get the certificate, a device must have a powerful CPU to ensure stable performance, high-quality camera, motion sensors, and suitable design architecture. By the point in time when we worked on our research project, there were three tablets to choose from: Samsung Galaxy Tab S4, Samsung Galaxy Tab S3, and Chromebook Tab 10. We chose the Samsung Galaxy Tab S4 (see Figure 4.1) because it has the largest screen (10.5" compared to the others 9.7" each), highest resolution (2560x1600 compared to the others 2048x1536 and 2048x1536) and the largest processing power (2.35GHz with 8 cores compared to the others 2.15GHz with 8 cores and 2.0GHz with 6cores).
9
Figure 4.1: The Samsung Galaxy Tab S4 with a 10.5" screen,
which we used to execute the Android augmented reality application that we built.
4.2 Prototyping process
A verifiable prototype approach must have well-defined iterations that show that there has been a thoughtful design rationale [11]. Therefore, we chose to make three iterations as illustrated in Figure 4.2.
Figure 4.2: An illustration of the iterative prototyping process that
consisted of three iterations. All three iteration went through a concept, prototype, and test phase iteratively for each iteration.
10
4.2.1 First iteration - getting familiar with Unity and ARCore
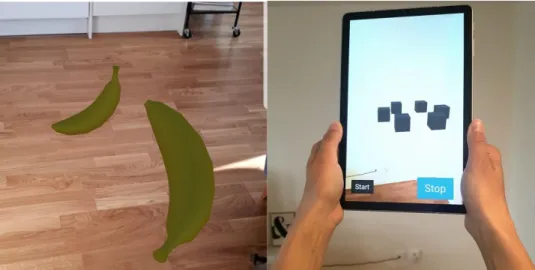
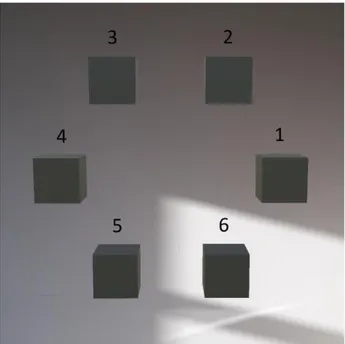
The first iteration of our artefact was constructed with the goal of us learning Unity and ARCore, or more accurately, how to create a 3D environment, placing and interacting with 3D objects. The first object created during the development was a floating gray rectangle. For the next step in the development, the grey rectangle was changed to a banana (see Figure 4.3) with an ability which enabled a user to place the banana anchored to one position in the 3D environment. Later we experimented how we could interact with the bananas by changing their size by pinching and giving them a push by tapping on them. Lastly, we added the ability to recognize a horizontal plane and placing six gray cubes in a circular pattern. These cubes were projected at a position selected by a user by tapping above ground at chest height. First, the cubes were placed horizontally as shown in Figure 4.3, but later we realized that one cube could obscure another, so we decided to place them upright so that a user could see all of them at the same time without having to move around them (Figure 4.4). The iteration gave us a better understanding of what we could do with Unity and ARCore combined, which aided in the completion of the final artefact.Figure 4.3: a screenshot of bananas and the first version of the cubes
11
Figure 4.4: Final version of the first iteration where the cubes are placed
upright so that a user can have a better overview of all of them without one obscuring another.
4.2.2 Second iteration - Designing the visual cue
In the second iteration of the artefact, we designed and implemented the visual cue. According to Fogg, when designing a cue it is important to consider the quality and repetition of it to avoid that it becomes annoying and repetitious [2]. Since we did not know how intense and repetitious our cue had to be subtle from the beginning, and that it probably would not be the same for every user, we implemented Fogg’s idea by making our visual cue unnoticeable at first and gradually become more obvious with time. According to us, a result of knowing when a user consciously starts to perceive the cue would translate to what level of intensity that is necessary for the cue to be subtle. Also, we thought that this design would let us examine if the cue draws a users gaze to it before the user consciously perceives it, making the cue subliminal rather than subtle.
The cue was initially designed as a flicker, making the gray cube that was sending the visual cue change between the gray and red. We soon observed that red or any other strongly saturated color was too obvious, even when displayed for a very short
12
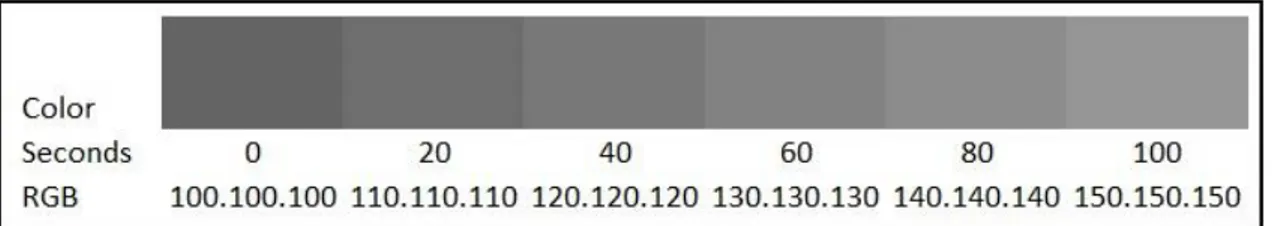
amount of time. Therefore, we chose instead to increase the brightness of the grey cubes. The color was expressed as an RGB (Red, Green, Blue triplet (r,g,b), each component of which can vary from 0 to 255 where if the components are at zero the result is black and if all are at 255, the result is the brightest representable white. The cube initially starts with an RGB color value (100, 100, 100), which is grey color and the change in color was done by increasing each RGB value by one every 60 frames and was shown for one frame. ARCore has a maximum reach of 30fps, which means that the color was increased by one approximately every 2 seconds, as illustrated in Figure 4.5. As the change of hue of the grey color was very small, to begin with, it would not be noticeable at first, but as the difference in brightness of the grey color increase, it will progressively become noticeable and will eventually be noticed. The time between it starting to flicker and to it being consciously perceived by the user were analyzed by us to see if the users' gaze was drawn more towards the manipulated cube than any of the others.
13
4.2.3 Third iteration - Integrating an eye tracking system
Our original plan was to connect the data stream coming from a pair of Tobii Pro Glasses 2, which are a head-mounted eye tracking system resembling a pair of glasses [26] displayed in Figure 4.6, to a mobile device. Given coordinates of where the user's gaze was fixed on the mobile device screen translate it to which 3D object that the user looked at in real-time. After doing some research, we found that it would be too complex and time-consuming about our timeframe to implement the required technology, since the mobile device and the Tobii Glasses position was not fixed it would have been difficult to map coordinates to the positions on the screen.
Figure 4.6: Tobii Pro Glasses 2 [26]. A wearable gaze tracker that
tracks a respondents eye movements using IR cameras, while also recording the environment with a front-facing video camera.
The solution was to use the Tobii Pro Glasses 2 as a separate unit and instead use their front-facing camera to record a user’s eye movements to analyze the video recording afterward. As a complement to our video analysis, we added a small timer to the upper-left corner of the user interface. This aided us later when we did our video analysis because we could see when the experiment had begun and when it stopped.
We also added a small fps counter to the user interface to let us know if frame drops did occur during the experiment. This was important since a low framerate would make so that the frame that was showing the brighter color could have been displayed longer than around 2 seconds and therefore give the participants more time to spot the change. Both the timer and the fps counter were designed to be small and so that they would not draw any user attention, which we later in the video analysis saw worked as intended to be because users did not fix their gaze there.
14
5. Experiment
The experiment examined if it is possible to impact a user’s gaze direction with visual cues in an augmented reality environment. Additionally, we explore if the visual cue has the possibility of being perceived subtly or subliminally. We also examine the time and the intensity of the cue that is necessary for a participant to perceive it. Since a person only can take in a limited number of stimuli at the same time, and a strong stimulus has a larger impact on where a user decides to focus [27]. Therefore, we conducted the experiments in a prepared room with artificial lights and no natural sunlight or windows since we wanted to minimize the number of outside stimuli that could interfere with the experiment. The stable light condition also provided the stable performance of the artefact which with the help of ARCore analyzes surfaces and changing light conditions.
5.1 Participants
For the experiment, we recruited 6 participants. The number of participants in the experiment was determined based on the limited time for us to evaluate the recordings and the number of volunteers. These participants’ ages ranged from 25 to 75 (average 46). The participants did not have any visual impairments to their knowledge that could affect the quality of the experiment. All of the participants were informed about the purpose for our study and its basic procedures and how the data will be used and were then asked to sign a consent form (as seen in Appendix A).
5.2 Experimental Design
Tobii Pro Glasses 2 were used to record the eye movements of a participant, and six cubes were augmented through on a mobile device screen in a symmetrical circular pattern. The reason for generating objects in a circular pattern was to avoid having an object in the center as the participants would likely look in the center first [28]. The cubes were upright and facing the participant and floated approximately 1,4 meters above the ground.
After the participant had clicked the start button, the application displayed a visual cue that increased in intensity. Each participant performed three different conditions of the experiment to counterbalance the results. The visual cue was first displayed on cube 2 (see Figure 6.1), second on cube 4 and lastly on cube 6. As soon as a participant would notice the cue, they were to press the stop button and then were asked to point at the cube that they thought behaved differently.
5.3 Setup
The participant was asked to put on the head-mounted Tobii glasses, and with assistance from one of us, the equipment was calibrated. To calibrate the glasses, we asked the participant to stand at a distance of 1m from a flat vertical surface holding a calibration marker. The calibration marker was a part of the Tobii eyeglasses equipment, and the program used together with the glasses executed the calibration. We then continued by giving the following instructions to the participant:
15
1. “The head-mounted eye-tracking equipment will be recording what you see and also your gaze direction.” A small video demonstrating what will be recorded was shown to the participant.
2. “6 cubes will be shown in the augmented reality application on the mobile device in your hands.”
3. “When the program starts, one of the cubes will behave differently from the other cubes. This will not be clear in the beginning but will be more and more obvious.”
4. “When you notice the different behavior on one of the cubes, you need to press the screen to pause the program and then point at the cube that you noticed a difference on.”
5. “This will be repeated 3 times and you just do the same every time.”
6. “After you have completed the experiment, we will explain the reason for it.” The participant was then asked to hold the mobile device and generate the cubes in front of the participant. When the cubes became visible and were placed on a fitting spot, where the participant could move around them, the participant is asked to press the start button.
During the experiment, the researchers were present to help answer questions of what to do, but not answering if the participant was unsure about which cube to point out. Each of the three conditions ended when the participant saw the visual cue and pressed the stop button.
After the three conditions, the experiment was completed, and we disclosed the real purpose of the experiment, with more detail than we did before the experiment. We told the participants that we would analyze the video recording to see how the participants gaze direction was manipulated by the visual cue. We also took the time to answer any questions or comments that the participants had about the experiment.
We then proceeded with evaluating the recordings with an emphasis on the time leading up to the participant stopping the program. We were looking for evidence that the participant’s gaze was drawn to the cued cube more than to any of the other cubes and time that it took for the participant to perceive the visual cue.
Figure 5.1: An image of the participant and what the participant saw through the
16
6. Results
The experiments were done with 6 participants that all went through the three different conditions. The subtle visual cue was used on cube 2 (see Figure 6.1) in the first condition, on cube 4 in the second condition and on cube 6 in the third condition. In the following part of the thesis, we will show the results of the experiment and analyze the data generated.
Figure 6.1: The numbers above the cubes were
used to identify the cubes in our application code and the video analysis.
All the results are taken from the video recordings of the participants' field of view while conducting the experiments. During the analysis of the video, we looked at what cubes the participants looked at and tried to see if the cube with the cue was getting more attention than the other cubes. The data from the analysis was used to create the individual tables (figure x-x) for each participant. The columns in red are the cubes that were given the visual cue during the different conditions of the experiment.
17
Participant 1
Figure 6.2: Experimental conditions for participant 1. The columns show the
number of gaze directions towards all the cubes with the cube with the visual cue highlighted in red. The x-axis represents the cubes and the y-axis represent the number of focused gazes on the cube.
Participant 1 was a 25-year-old male with high technological background. He had worked with AR development on mobile devices in the past and was very familiar with the concept. Figure 6.2 shows how the participant was showing more gaze focus on cubes one and two than any of the other cubes while conducting the first condition of the experiment. During the second condition of the experiment, the participant still had many gazes on cubes one and two, but also started to have gazes on other cubes as well. The third condition shows how the participant changes focus to cube six while still maintaining many gazes on cube two.
Participant 2
Figure 6.3: Experimental conditions for participant 2. The columns show the
number of gaze directions towards all the cubes with the cube with the visual cue highlighted in red. The x-axis represents the cubes and the y-axis represent the number of focused gazes on the cube.
Participant 2 was a 33-year-old male with some technical background. He had used AR applications before and was familiar with the concept. Figure 6.3 shows how the participant's gaze was focused during the last 20 seconds of each condition. During the first condition, the participant's main focus was on cube two and six. While conducting the second condition part of the experiment, the participant's gaze was primarily on cube one and two, and in the third condition test, the gaze was on cube four and five. The participant told us that he guessed that the cube that had a cue in the previous condition would not have it again and therefore, chose to not look at that cube as much. But during the analysis, we can see that the participant looked even more on the previously cube with a visual cue than any of the others.
18
Participant 3
Figure 6.4: Experimental conditions for participant 3. The columns show the
number of gaze directions towards all the cubes with the cube with the visual cue highlighted in red. The x-axis represents the cubes and the y-axis represent the number of focused gazes on the cube.
Participant 3 was a 38-year-old male with some technical background. He had not used an AR application before and had a little familiarity with the concept of AR. In figure 6.4, we can see the participants gaze focus during the three conditions of the experiment. During the first condition the main focus of the user was on cube cube and two, and during the second condition, the focus was primarily on cube three and four. During the third condition, the participant's gaze was then mainly on cube one, three and four, and only moved to cube six at the very end before the participant pressed the stop button.
Participant 4
Figure 6.5: Experimental conditions for participant 4. The columns show the
number of gaze directions towards all the cubes with the cube with a visual cue highlighted in red. The x-axis represents the cubes and the y-axis represent the number of focused gazes on the cube.
Participant 4 was a 43-year-old male with some technical background. He had not used any AR application but was aware of the concept. As seen in figure 6.5, the participants gaze during condition one was mainly focused on cube two. During the second condition, the participant kept his primary focus on cube one and two with an increase in gaze directions towards cube four at the end of the test. In the third condition, the user seems to have adopted a strategy where he looked at a point between cube one and two and waited to see any change to the cubes using his peripheral vision. When the participant saw the subtle cue on cube six, he moved the gaze towards the cube and waited for it to flicker a second time before pressing the stop button.
19
Participant 5
Figure 6.6: Experimental conditions for participant 5. The columns show the
number of gaze directions towards all the cubes with the cube with the visual cue highlighted in red. The x-axis represents the cubes and the y-axis represent the number of focused gazes on the cube.
Participant 5 was a 64-year-old male with reduced technical skills and had not used AR applications before. Figure 6.6 shows the participants gaze during the three different conditions of the experiment. During the first condition, the participant's gaze was on cube two, and the gaze remained on cube two and three during the second condition as well. While conducting the third condition of the experiment the user seemed to have adopted a similar strategy as participant 4 where the gaze stayed on cube two and three and used the peripheral vision to notice a cue on the other cubes. When a cue was noted on cube six, the user shifted his gaze to the cube and pressed the stop button.
Participant 6
Figure 6.7: Experimental conditions for participant 6. The columns show the
number of gaze directions towards all the cubes with the cube with the visual cue highlighted in red. The x-axis represents the cubes and the y-axis represent the number of focused gazes on the cube.
Participant 6 was a 75-year-old male with lesser technical skills and no prior experience with mobile AR applications or the concept of AR. During the first condition, the participant kept his gaze spread on all cubes except cube four. It took him 88 seconds (the longest time of all participants) to perceive the cue that was on cube two. In the second condition, the participant kept most of his focus on cube one and six. At the end of the second condition, the participant chose cube four as the cube with the cue, but there was a degree of uncertainty by the participant because he wasn’t sure if he saw something. In the third and last condition, the participant shifted his gaze between all cubes. The time it took for the participant to see the visual cue was much shorter, and cube six was chosen with much more certainty. We believe that the longer time and uncertainty in picking the cubes during the first and
20
second condition is due to a combination of the user’s age, lack of technical background and no prior knowledge and experience of AR.
TABLE 1:
The time it took for participants to see the cue and the RGB color value of the cue.
Participant
Condition 1 Condition 2 Condition 3
sec RGB(r, g, b) sec RGB(r, g ,b) sec RGB(r, g, b)
1 48 124,124,124 50 125,125,125 30 115,115,115 2 46 123,123,123 40 120,120,120 62 131,131,131 3 20 110,110,110 56 128,128,128 32 116,116,116 4 36 118,118,118 86 143,143,143 54 127,127,127 5 50 125,125,125 32 116,116,116 96 148,148,148 6 88 144,144,144 48 124,124,124 20 110,110,110
The time it took for the participants to see the visual cue and stop the program was very individual. Table 1 shows the individual time and the RGB value, which is also equivalent to the intensity of the cues for each participant during each condition.
7. Analysis
In this section, we analyze, compare, and explain the results that were presented in the previous section.
7.1 General analysis
During the analysis of the recorded experiments, we could see that the intensity of the visual cues seems to be individual for each user. The time it took for each participant to find the visual cue on the correct cube varied both between participants and between conditions. We could not see any significant signs of participants gaze being drawn more towards the visually cued cube before they consciously noticed the subtle cue. Thus the first stages of the cue seem to be too subtle to be noticed. We could also see in the analysis that the participants had a higher focus on the cubes in the top of the circle, cube 1 and 2 in particular. We believe this could be caused by people naturally looking at a circle in the same way
21
as on a clock. By doing that they presumably have a higher focus on the placement of cubes 1, 2 and 3 close to twelve and one on the clock. We also think that the nature of the circle placement on the screen makes it more natural to lock at the top cubes as they seem to be in the eye level and the bottom cubes force the viewer to look down.
7.2 Object placement
The placement of the cube in a circle formation was made in an attempt by us not to force the user to move his or her gaze in a certain direction. As shown in figure 7.1, a straight line, for instance, could make the user look at all the cubes from left to right or right to left and thus have the same amount of focus points on all cubes even if the participant only meant to look at the cube at the end of the line. The circular pattern of the cube placement allows the user to move his gaze from cube to cube without having to bypass or move the gaze over another cube.
Figure 7.1: The reason for placing the cube in a circle
formation instead of a straight line.
This proved to be true since the analysis shows that the users gaze moves undisturbed between the cubes and some of the cubes are not looked at as much as others. On the other hand, the placement of the cubes in a circular pattern seems to have an unpredicted effect on the participants. Also, we saw that the users had a higher focus on cube one and two during all three conditions. As stated previously, we believe this could be contributed to the similarities to a clock and the habit to start looking at the top part of the clock, e.g., 12 o'clock and work your way clockwise. But after moving the gaze a full circle or even after only looking at a few cubes, the gaze shifts more randomly between the cubes. But now and then the user returns to the top right corner of the circle, and this gives an increase of gaze focus on cube one and two. We also on average see more focused gazes on the top cubes one, two, three and four than on the bottom cubes five and six. We believe this could be a result of
22
feeling that the top cubes are more at the eye level and that the bottom cubes required the user to lower his or her gaze. This effect shows similarities to how products are placed on shelves in stores with the premium brands being placed on the top shelves, e.g., at the eye level and the cheap brands being placed at the bottom shelves [29].
7.3 Intensity of the cue
The time it took for each participant to perceive the visual cue in each experiment condition is directly related to the intensity of the cue. The time it took for each participant to perceive the visual cue during the experiment varied, meaning that the intensity of the cue that is necessary for it to be perceived seems to be individual. Although, by looking at Table 2, all the participants managed to perceive the cue at an average time that was under or just about one minute.
The time it took for each participant to notice the cue in the three different conditions of the experiment varied as well. An example of this is that we could see that the participant who perceived the cue fastest of all participants in the first condition did not have the fastest time in the other conditions. To further demonstrate this is by looking at the results for participant 6 in Table 2 whose fastest time was 20 seconds (RGS(110,110,110)) and slowest time 88 seconds (RGS(144, 144, 144)) which makes a 68-second difference in perceiving the cue. At the same time, participant 1s fastest time was 30 seconds, and the slowest time 50 seconds, which is a 20 seconds difference.
TABLE 2:
Shown in this table is the range of the dataset (the difference between the fastest and the slowest time) as well as the average time to perceive the visual cue for each participant under the three performed conditions
during the experiment.
Participant id range of dataset (seconds) average (seconds)
1 20 42.6 2 22 49.3 3 36 36 4 50 58.6 5 64 59.3 6 68 52
23
8. Discussion
The result of our research shows that the visual cue which we chose to implement in our experiment does not seem to draw a users gaze subliminally to an augmented 3D object but only does so when it becomes subtle, e.g. when the user consciously perceives the visual cue. We believe that because the users were expecting something to happen in the experiment, they did not behave like in a completely everyday life context. After seeing the cue in the first experiment condition, they knew what to expect later, which resulted in more of a search task experiment setup.
We also recognize that our experiment, like any other where participants know that they are being observed could mean that they may have acted unnaturally in our presence. Despite this, we maintain the belief that the main purpose of the experiment was not compromised because the participants were not aware of the details of the experiment.
The result also suggests that users may be prone to focus on objects that have previously been sending a visual cue. Some participants in our experiment kept more gaze focus on the cube that sent the visual cue during the previous condition. This even seems to be done unknowingly by the participant. After the experiment two of the participants in our study told us that they thought of not looking at cubes that had already been sending a cue as they concluded that the same cube would not be used in the following condition. Despite that, during the video analysis, we notice that those participants had a significant number of gazes on the previous cube anyway. Also, this could suggest that it could lead a user to make a habit of looking where there usually has been a visual cue even if it is not there anymore.
8.1 Design of the cue
In the first design idea of visual cue, we used a flicker of the cube from grey to red for one frame. We observed that this strong contrast of colors was noticeable even if it was for only one frame. This led us to change the brightness of the gray color to lessen the contrast of the cue color versus the cube color. This limitation of the eye’s ability to spot even one frame, if the contrast is too high, is something that needs to be taken into consideration when creating subtle cues in this way.
During our analysis we observed that the intensity of the cue needed for the participant to perceive it varied among different conditions of the experiment. This indicates that a fixed value for a user will not work in all cases. We believe that the placement of the visual cue in relation to the user’s current focus has an impact on how strong the intensity of the cue need to be. Because of this we believe that the cue may need a intensity that is somewhat stronger than in the experiment results. Although, we suggest that the intensity of the cue should not be increased to a point when it becomes too obvious because then it would, much like the smartphone prompts today, interrupt and break the immersiveness of real-life tasks.
Despite that the cue was perceived as subtle and not subliminal in our experiment, we believe that if a user were to be exposed to the same cue intensity in a real everyday life context, it would move towards being subliminal. Other outside visual
24
stimuli in the user’s surroundings and that the user focuses on other tasks could make the user not perceive that there was a cue but still direct their gaze towards it. Thus we think this would lead to an environment were the user is not actively searching for the cue, and it could perhaps have an even more subtle or maybe even subliminal impact.
8.2 Object and cue placement
In the analysis of our results, we noticed that most participants in our study had more gaze focuses on the top cubes (cube 1 and 2 in Figure 6.1) than any other. Since we experienced this behavior, we believe that the cube with the visual cue in the first condition of the experiment should not be on one of the top cubes since they already have a higher interest from the user as shown in our results. Still, we believe that positioning the cubes in a circular pattern is preferable to putting them in a straight line or any other pattern that we could think of at the time of the experiment design.
8.3 Ethics of subtle and subliminal cues
Subtle and subliminal cues can raise some ethical concerns. Cues that persuade a person to change behavior should always be questioned and taken in regard to those who design such technologies. According to Fogg, the answer to if persuasion can be unethical is absolute yes, and that even when persuasion is used with good intent, such as health promotion, some experts question whether one has the right to tell how to behave [2]. But what if a person actively chooses to persuade himself, as with technology that very subtly reminds him of taking the stairs more? Conclusively, there is no obvious answer to if using subliminal and subtle cues that are used to persuade are right or wrong.
In this study, we choose to investigate how a visual cue can be designed and if it is possible that people would direct their gaze to it before it became visible without persuading behavioral or attitude change. Therefore, our experiment was not designed to persuade participants by changing their behavior or attitude but focused on the design and functionality of a visual cue. Yet, while working on the study, we reflected on the ethical implications of using subtle or subliminal signals to persuade people. An industry which could potentially misuse this knowledge is marketing, and other commercial sectors were a users gaze direction is essential. Much as this is a field where we would not wish our gained knowledge to nourish unethical persuasive technology, we believe it is crucial to building a solid research foundation of the subject. Thus, we need to get a better understanding of the potential implications when subtle and subliminal knowledge is misused.
25
9. Conclusion
This section summarizes the answers to our research questions and states suggestions for future work that can be done in this field.
RQ1: To what extent is it possible to direct a user’s gaze with subtle or subliminal visual cues to a digitally projected 3D object displayed on a handheld AR-capable mobile device in a real-world environment?
Our conclusion based on the results from the experiment is that it is possible to subtly direct a user's gaze using the kind of visual cue that we implemented. We found that the intensity of the visual cue needed to perceive it differed between people and that people are more inclined to focus on objects placed at an eye-level height which should be taken in consideration when deciding on where to place visual cues. We also conclude that the visual cue may need to be more intense when it is in a user’s peripheral vision. Also, the visual cues may have to be more intense whenever they are not at the eye-level.
RQ2: What kind of visual cues can be used with AR implemented on a handheld mobile device platform?
The visual cue that we implemented in our system sends a cue from the whole body of a virtual 3D object. The cue is designed as a flicker, flickering from the 3D objects original color to a new color which gradually increases its brightness. In our system design, with a maximum limit of 30fps, the flicker is performed every 60th frame and is displayed in one frame. We concluded that strongly saturated color for a cue, even if displayed for only one frame makes the cue to obvious to be subtle. Therefore, designing a visual cue with a similar color to the object that is being cued is preferable.
9.1 Future work
Our idea for future studies is, with the help of machine learning techniques, find a way to identify objects which reside in the real world and implement visual cues as a layer on top of them, by making the whole body of the object send a visual cue. This could give it a more subtle effect than flickering as in our application. An inspiration for wanting to implement visual cues this way comes from a fantasy action role-playing game The Witcher 3: Wild Hunt [30] which makes use of gradually increasing visual cues to guide players to objects of interest. Objects are glowing in low opacity orange or red when a player presses and holds a button and gradually increase the opacity as long as a player chooses to keep holding the button as illustrated in Figure 9.1.
26
Figure 9.1: A screenshot of a barrel in the game The Witcher 3: Wild Hunt [30]in
its normal state in the left image. The middle image is showing how it is faintly glowing when a player presses and holds a button, and the image to the right showing how the glow becomes stronger it the player chooses to keep holding down the button.
We would also like for a similar experiment as ours be done in a similar setting but where users are asked to perform some other non-related task simultaneously. We believe it would say something about what intensity of the cue is needed when a user is not aware of him or her being exposed to the cue.
27
References
[1] M. Weiser, “The Computer for the 21st Century,” ACM SIGMOBILE Mob. Comput. Commun. Rev. - Spec. Issue Dedic. Mark Weiser, vol. 3, no. 4, pp. 3– 11, Jul. 1990.
[2] B. J. Fogg, Persuasive technology : using computers to change what we think and do. Morgan Kaufmann, 2003.
[3] A. T. Adams, J. Costa, M. F. Jung, and T. Choudhury, “Mindless Computing: Designing Technologies to Subtly Influence Behavior,” Proc. ACM Int. Conf. Ubiquitous Comput. UbiComp Conf., vol. 2015, pp. 719–730, Sep. 2015. [4] S. Consolvo et al., “Activity sensing in the wild: a field trial of ubifit garden,”
in in Proceedings of the twenty-sixth annual SIGCHI conference on Human factors in computing systems, ser. CHI ’08, 2008, pp. 1797–1806.
[5] Tractica, “Smart Augmented Reality Glasses,” 2017. .
[6] B. I. Lindskog, Medicinsk miniordbok, 6. omarb. och utv. uppl., [2. tr.]. Stockholm: Norstedts Akademiska förl, 2005.
[7] S. Dehaene, J.-P. Changeux, L. Naccache, J. Sackur, and C. Sergent, “Conscious, preconscious, and subliminal processing: a testable taxonomy,” Trends Cogn. Sci., vol. 10, no. 5, pp. 204–211, May 2006.
[8] R. F. Bernstein, D. R. Leone, and D. J. Galley, “The Generalizability of Subliminal Mere Exposure Effects: Influence of Stimuli Perceived Without Awareness on Social Behavior,” p. 10.
[9] A. McNamara, R. Bailey, and C. Grimm, “Improving search task performance using subtle gaze direction,” in Proceedings of the 5th symposium on Applied perception in graphics and visualization - APGV ’08, Los Angeles, California, 2008, p. 51.
[10] R. Kelly, “Subliminal computing: the support you don’t see,” XRDS Crossroads ACM Mag. Stud., vol. 18, no. 1, p. 25, Sep. 2011.
[11] R. W. DeVaul, A. (Sandy) Pentland, and V. R. Corey, “The Memory Glasses: Subliminal vs. Overt Memory Support with Imperfect Information,” in
Proceedings of the 7th Ieee International Symposium on Wearable Computers, Ieee Computer Society, 2003.
[12] D. Kahneman, Thinking, fast and slow, 1st ed. New York: Farrar, Straus and Giroux, 2011.
[13] H. Deubel and W. X. Schneider, “Saccade target selection and object
recognition: Evidence for a common attentional mechanism,” Vision Res., vol. 36, no. 12, pp. 1827–1837, Jun. 1996.
[14] R. Bailey, A. Mcnamara, N. Sudarsanam, M. Corporation, and C. Grimm, “Subtle gaze direction,” ACM Trans Graph, 2009.
[15] R. T. Azuma, “A Survey of Augmented Reality,” p. 48.
[16] O. Bimber and R. Raskar, Spatial Augmented Reality: Merging Real and Virtual Worlds. A K Peters/CRC Press, 2005.
[17] A. H. Larsen, “Digitizing the board game experience utilizing mobile platforms,” p. 57.
[18] A. McNamara, L. Murphy, and C. Egan, “Investigating the use of eye-tracking for view management,” in ACM SIGGRAPH 2014 Posters on - SIGGRAPH ’14, Vancouver, Canada, 2014, pp. 1–1.
28
professionals : information management and systems., Second edition. Centre for Information Studies, Charles Sturt University, 2002.
[20] J. W. Creswell, Research design : qualitative, quantitative, and mixed methods approaches., 4th ed. SAGE Publications, 2014.
[21] N. J. Salkind, Encyclopedia of research design. [electronic resource]. Sage, 2010.
[22] ARCore SDK for Unity. Google.
[23] P. E. Dickson, J. E. Block, G. N. Echevarria, and K. C. Keenan, “An Experience-based Comparison of Unity and Unreal for a Stand-alone 3D Game Development Course,” in Proceedings of the 2017 ACM Conference on Innovation and Technology in Computer Science Education - ITiCSE ’17, Bologna, Italy, 2017, pp. 70–75.
[24] C. Tonkin, A. T. Duchowski, J. Kahue, P. Schiffgens, and F. Rischner, “Eye tracking over small and large shopping displays,” in Proceedings of the 1st international workshop on Pervasive eye tracking & mobile eye-based interaction - PETMEI ’11, Beijing, China, 2011, p. 49.
[25] “ARCore Supported Devices,” 04-Feb-2019. [Online]. Available:
https://developers.google.com/ar/discover/supported-devices. [Accessed: 05-Apr-2019].
[26] “Tobii Pro Glasses 2,” Tobii Pro, 25-Jun-2015. [Online]. Available:
https://www.tobiipro.com/product-listing/tobii-pro-glasses-2/. [Accessed: 23-May-2019].
[27] J. M. Wolfe and T. S. Horowitz, “What attributes guide the deployment of visual attention and how do they do it?,” Nat. Rev. Neurosci., vol. 5, no. 6, pp. 495–501, Jun. 2004.
[28] M. M. Hayhoe and D. H. Ballard, “Vision in Natural and Virtual Environments,” p. 8.
[29] A. Valenzuela, P. Raghubir, and C. Mitakakis, “Shelf space schemas: Myth or reality?,” J. Bus. Res., vol. 66, no. 7, pp. 881–888, Jul. 2013.
[30] “The Witcher 3: Wild Hunt,” The Witcher 3: Wild Hunt - Official Website. [Online]. Available: https://thewitcher.com/en/witcher3. [Accessed: 23-May-2019].
[31] C. Tonkin, A. D. Ouzts, and A. T. Duchowski, “Eye tracking within the packaging design workflow: interaction with physical and virtual shelves,” in Proceedings of the 1st Conference on Novel Gaze-Controlled Applications - NGCA ’11, Karlskrona, Sweden, 2011, pp. 1–8.
29
Appendix A
Consent form
Malmö University Nordenskiöldsgatan 1 211 19 Malmö SwedenExperiment: Gaze Direction Using a Handheld Augmented Reality Device Experiment leader: Sofia Larsson and Jimmy Åkesson
Researchers: Sofia Larsson and Jimmy Åkesson
This is an experiment about how gaze direction works in an augmented reality setting. During the experiment you will look at 3D cubes through a mobile device while standing. We will record what you see with the help of a pair of Tobii Eye Tracking Glasses. Your participation is entirely voluntary. You may choose to discontinue the experiment at any time during the experiment if you wish.
By signing this document, you consent that:
● You understand that we have recorded your eye movements and eye images. ● You have been given full disclosure of the aim of the study.
● You understand that the data are reported in anonymized form.
● Your data will be used for publication and made publically available to other
researches (in anonymized form). Thank you for your participation!