Teknik och samhälle
Datavetenskap och medieteknik
Examensarbete 15 högskolepoäng, grundnivå
Using Mobile Devices for Exercise Capacity Testing: An
Implementation and Validation Study
Att använda mobila enheter för kapacitetstestning: en implementation- och valideringsstudie
Felix Morau
Elin Forsnor
Examen: Kandidatexamen 180 hp
Huvudområde: Data och Informationsveten-skap
Program: Informationsarkitekt
Datum för slutseminarium: 2020-06-04
Handledare: Dario Salvi and Carl-Magnus Olsson
Abstract
Mobile phones can be used to assess patients health by collecting valuable information through the sensors, GPS and accelerometers and then uploading them to a central database to allow for clinicians to remotely monitor the decline, improvement or over-all health status of a patient [1] [2].
Many mHealth applications use mobile phones built-in GPS, accelerometer and other sensors which allows for a large selection of work to compare the implemented exercise capacity test to [1].
The exercise capacity tests developed for this thesis is to be used in Mobistudy. Mobis-tudy is an open mobile-health platform for clinical research. The platform has an emphasis on regulatory compliance, patient consent and transparency [3].
The thesis resulted in the creation of two artifacts which were able to successfully collect data from the user to transfer to the clinicians using the application. During the analysis it was found that the SMWT algorithm developed by Salvi et al [4] worked well under non optimal conditions. The Queens College Step Tests result were in general poor, however more testing with more different phones is required to provide a clear answer.
0.1 Definitions
mHealth: Mobile health involves sensors, mobile apps, social media, and location-tracking
technology used in disease diagnosis, prevention, and management [2].
6MWT: 6 Minute Walk Test, a test which measures a patients functional capacity,
how the patient is responding to treatment and a prognosis across a range of chronic con-ditions [5].
Wearable Devices: Devices such as FitBits or Smartwatches which have the ability
to collect bio-metrics from its user.
Accelerometer: An instrument for measuring the acceleration of a moving or
vibrat-ing body.
VO2max: Maximal oxygen uptake that can be achieved despite increases in intensity
of exercise [6].
Step Counting: Counting the number of steps a person walks/runs.
Modal: A box which appears on top of the displayed current, usually darkens the
background.
Contents
0.1 Definitions . . . .
1 Introduction 1
1.1 Area of Concern . . . 1
1.2 mHealth Opportunities . . . 1
1.3 Exercise Capacity Testing . . . 1
1.3.1 Six Minute Walk Test . . . 2
1.3.2 Queens College Step Test . . . 2
1.4 Related Work . . . 2 1.5 Problem Definition . . . 3 1.6 Research Objective . . . 3 1.7 Context . . . 3 1.8 Research Approach . . . 4 1.9 Contribution . . . 4 1.10 Overview . . . 4
2 Method: Design Science Research 4 2.1 Problem Identification and Motivation . . . 5
2.2 Define the Objectives for a Solution . . . 6
2.3 Design and Development . . . 6
2.4 Demonstration . . . 6
2.4.1 Evaluation . . . 6
2.4.2 Communication . . . 6
2.4.3 Methodological Reflections and Study Limitations . . . 7
3 Results 7 3.1 Problem Identification . . . 7
3.2 Objectives of a Solution . . . 7
3.3 Design and Development . . . 8
3.3.1 Six Minute Walk Test . . . 11
3.3.2 Queens College Step Test . . . 13
3.4 Demonstration of Implementation . . . 15
4 Analysis 19 4.1 Evaluation of Six Minute Walk Test . . . 19
4.1.1 Data . . . 20
4.1.2 Data Analysis . . . 21
4.2 Evaluation of Queens College Step Test . . . 21
4.2.1 Data . . . 22
4.2.2 Data Analysis . . . 23
5 Discussion and Final Reflections 23 5.1 Positioning Our Results . . . 23
5.2 Practical Experiences and Design Choices . . . 24
5.4 Final Reflections . . . 25
1
Introduction
1.1 Area of Concern
In February 2020, the number of smartphone users was 3.5 billion people, worldwide [7]. This increasing use of smartphones, together with the development of heart rate bands, smart watches and other wearable devices, has given rise to a large amount of user-generated data from day-to-day life. Effectively, this has opened up for today’s mobile phones to play a prominent role in modern healthcare [2] [8].
1.2 mHealth Opportunities
With a decrease in both price and size of sensors, mobile phones have become powerful yet ubiquitous monitoring systems within mobile health, or mHealth as it is popularly known [1]. mHealth services have the potential to be used for instance to encourage physical activity and healthy diets, monitoring asthma and various heart conditions. The widespread adoption of smartphones with powerful hardware often including bio-metric sensors and built-in GPS provides a useful platform for further service exploitation. In addition, people often carry their phones with them everywhere, and are used to their phones which also makes them a natural technology for self-monitoring tools as well [1]. This reduces the barriers for users to accept and adapt to the mHealth applications at hand, where the smartphone’s access to the internet further makes it possible to constantly send information about the patients metrics to the physicians or researchers. Such bio-metric patient data can then be visualised and presented back to the patients directly on their phone.
1.3 Exercise Capacity Testing
Within healthcare, exercise capacity testing is an integral component for monitoring changes in physical function of patients. Examples of tests include various oxygen con-sumption based tests such as cardiopulmonary exercise testing [9] and VO2max testing [6].
Cardiopulmonary tests are usually performed by patients with chronic heart and lung disease which makes it important for the patient to be able stop if they experience dizziness, chest-pains or other symptoms during the test [9]. Most cardiopulmonary exercise tests are static biking/running or step tests which measures functional status and capacity. These tests can be used to provide a means of monitoring response to treatment in patients with chronic disease [10].
VO2max tests show the highest rate at which oxygen can be taken in and utilised by the body. This measures the cardio-respiratory fitness and health of a person. It is used by both healthy and unhealthy people as a way to measure changes in aerobic capacity. The graded exercise test which measures VO2max requires the patient to be able to push themselves to absolute exhaustion and analysing the air. The test is very hard and expensive to administer and is challenging to run in real-world settings [6]. So called sub-maximal exercise testing, which are less problematic to run in practice, can be used a substitute to predict the VO2max. Sub-maximal tests using steps and walking
distance in a controlled (but easy to manage in practice) manner have been validated in terms of their capacity to estimate VO2max [6].
1.3.1 Six Minute Walk Test
The Six Minute Walk Test is an inexpensive, simple, safe, and generally accepted method for measuring the exercise capacity of patients with chronic heart/lung disease. The test should be used routinely in order to get a valid measurement of the patients aerobic capac-ity. The Six Minute Walk Tests performed by clinicians today are often conducted in clini-cal settings where the patients walks a predetermined path. These paths are often straight and the patients walk several laps over the course of the test [11] [12]. Research shows that the correlation between the Six Minute Walk Test and the estimation of VO2max is significant, which validates the Six Minute Walk Test as an effective way to predict the aerobic ability of patients and monitoring them to catch eventual regress/progress [11].
The measured variables in the Six Minute Walk Test are the distance walked during the test, symptoms, oxyhaemoglobin saturation and heart rate if possible. The distance a patient walks (6MWD = 6 Minute Walking Distance) is influenced by age, sex, height, weight, FEV and ethnicity [12] [9]. The first popular walk test was a twelve minute long test. Further development of the test has resulted in two new, shorter versions of the test, the Two Minute Walk Test and the Six Minute Walk Test, which today are the most widely used in the given field [10].
1.3.2 Queens College Step Test
The Queens College Step test is a paced step test designed around stepping up and down a step at a specific height. The test runs for a duration of three minutes where the step rate is set by a metronome. A significant correlation was found between the predicted and measured VO2Max which suggests that the Queens College Step Test is an adequate sub-stitute if exact V02max is not required. The Queens College Step Test is better suited for healthier participants [6]. One reason for using the Queens College Step Test on healthier subjects rather than on ill subjects is that the Queens College Step test is externally paced and exerts more stress on cardiorespiratory systems than the Six Minute Walk Test [13]. The Queens College Step Test has been previously used in studies relating to collecting VO2max data [14] [15] [13]. The Queens College Step Test and the Six Minute Walk Test have the same goal of collecting data relating to VO2Max but the results vary. One reason for this is that the Six Minute Walk Test is self paced while the Queens College Step Test is externally paced [13]. This means that the participant should aim to step using a four-step cadence, "up-up-down-down" for the duration of the test. The cadence is regulated by a metronome and is set at 88 bpm (22 steps) for women and 96 bpm (24 steps) for men [16].
1.4 Related Work
There has been some work relating to digital walking test done recently. An algorithm developed for use for the six minute walk test which was integrated into a mobile appli-cation has been developed by researchers at Oxford University. This test used the GPS of the phones to provide the location users performing the test outside [4]. For indoor
purposes the GPS is not a reliable tool for distance tracking [17]. Different techniques for calculating indoor walking distance has been tried, machine learning, using the smart-phones accelerometer to provide three-axial acceleration to calculate the estimated gait speed and predict the 6MWWD. There were effort put into designing a remote monitoring system which monitored the heart rate and ECG of adults with heart failure during the Six Minute Walk Test, this combined with the accelerometer and GPS collected the distance travelled. However, due to the user having to physically hold the phone in their hands this test could be deemed unreliable for the six minute walk test [17]. Salvi et al. designed a system designed around detecting when the user turned around, the preliminary assess-ment of this design showed was that the test was highly accurate and well accepted by its users however it needs further testing to asses its clinical value [4].
1.5 Problem Definition
Given the above description of the opportunities that mHealth brings, and the need within healthcare to use various exercise capacity tests, the overarching purpose of this study is to explore how these can be combined. This is relevant, as such tests are currently performed under clinician supervision at a clinic or other medical facility. Exploring the validity in how these tests could be done by patients themselves, through use of technology, rather than be forced to travel to a specific place to do these step or walking tests.
Aside from patient convenience, this of course holds potential for more efficient use of the time for clinicians if a mobile service can provide the same service. If relevant for the specific patient condition, allowing tests to be conducted when convenient for participants may also increase the regularity and adherence to treatment plans through engaging interaction design and sharing or results. In these Corona virus times, mobile service based tests have become even more relevant as many that need these tests are in the risk groups.
1.6 Research Objective
Our overarching research objective is to contribute towards the understanding of how exercise capacity may be measured using mobile phones by participants themselves at home or another location convenient to them. We address this through two specific research questions:
1. RQ1: How can raw data gathered from the phone be translated into clinically-significant metrics?
2. RQ2: How accurate are the tests performed this way?
1.7 Context
The application will use an existing algorithm for the Six Minute Walk Test and focus on implementing it into a platform for mHealth research. As noted by Amagasa et al. [18], while smartphones may be of use for monitoring physical activity when counting steps, a measure of precaution is relevant when making comparisons between pedometers and smartphones as people cannot be assumed to carry their smartphones every waking
moment. Therefore, it makes sense to measure capacity with a controlled test by using a smartphone application [18] [1].
1.8 Research Approach
Design driven research is a well established approach for conducting research, where this study relies on the specific process elaborated on by Peffers et al. [19] as the Design Science Research Method (DSRM). Compared to methodological paradigms such as theory building or interpretive research, design science is argued to be more suited when the aim is to create tangible things, such as a software service in our case, that serve human purposes in itself. The methodology offers a rigorous process for how designed artifacts may be used to solve observed problems in practice.
1.9 Contribution
This study is a contribution to research and practice through the validated implemen-tations of two sub-maximal physical capacity tests - the Six Minute Walk Test and the Queens College Step Test - relying on opportunities provided by mHealth. Specifically, our work extends the Mobistudy platform (SECTION 3).
1.10 Overview
The remainder of the paper is structured as follows: Section two outlines the Design Sci-ence Research Method (DSRM) in terms of the background and process. Section three then moves on to include the specific steps of DSRM that our research has taken, starting from problem identification and defining our objectives for the solution, to then describe our design and development as well as demonstrating the technical validation of our archi-tecture and developed software components. Section four provides the evaluation results from three phones that in practice were exposed to the mHealth service, subsequently act-ing as our validation for the implemented tests. Section five finally reflects on our results and the potential for further development as well as development experiences that may be of relevance for future research.
2
Method: Design Science Research
The Design Science Research Method (DSRM) [19] has its background in a growing need and interest in using novel designed technology objects as part of information systems research. The method is in part motivated by theories from social as well as natural sciences, and carries distinct engineering qualities which makes it suitable for research looking to do practice evaluations as well as contributions. The goal of the methodology is to use a rigorous process to design artifacts to solve observed problems, while relying on related research and state of the art design and development principles. Several studies in the mHealth domain have previously used the Design Science Research methodology [20] [21] [22] [23], illustrating the applicability of this choice for our case as well. The methodology holds seven guidelines that describe the characteristics of well carried-out design science research:
1. The research must produce and artifact created to address a problem. 2. Relevant to the solution of an unsolved and important problem. 3. The utility, quality and efficiency must be evaluated.
4. The research should represent a verifiable contribution.
5. The development of the artifact should use existing theories and knowledge and come up with a solution to a defined problem.
6. The research must be effectively communicated.
The DSRM methodology uses six main phases for designing and creating Information Systems [19][fig 2]. While there is a logical order to the activities, a researcher may choose to do them in other orders than sequentially from the start. The order of activities is based on the focus of the specific research, and the starting point it has. In studies of problem-centered nature, where the problem domain first needs to be identified and then acts as driver for the following steps, would imply a sequential order from the start of phase 1 to the end. A more objective-centered research, where the problem is well estab-lished and the need is more related to translating this into activities would begin with phase 2. Similarly, a design- and development-centered approach, starting with phase 3 would be used if the existence of an artifact has not been thought of as an solution to a problem yet and there is need to evaluate the potential of this, possibly through multiple iterations or multiple different artifacts. Finally, DSRM may also be employed with a client/context-initiated focus - starting directly in phase 4 - to lend subsequent steps of the process scientific rigor.
This study is traditional in the sense that it largely holds a problem-centered focus, even if the starting point includes a known set of core references describing the potential of mHealth (section 1), and practice need (section 1). However, in order to more elaborately define the problem, a literature review was conducted to further extended the understand-ing of the problem area, as well as a state of the art design and development review of more technical nature for the implementation needs we faced. Below, we present the general outline of the DSRM phases and specific tasks we do within them. We elaborate more fully on the outcome of our research in the results (section 3).
2.1 Problem Identification and Motivation
Describing the problem and the value of a solution. Some researchers [19] transform the problem into objectives, called metarequirements and for some the efforts are implicated as a part of programming and/or data collection. Identified problems are not required to directly translate into objectives for the artifact. This phase of DSRM instead strives to ensure that the researchers have a knowledge of the state of the art in the area.
The main problem this thesis aims to resolve is the question regarding how raw data can be acquired from a phone, and the motivation for clinicians to make use of such data.
This part of the research sets the stage for the overall goal of the research, as well as specifically addresses RQ1.
2.2 Define the Objectives for a Solution
This phase of DSRM relates to the objectives of the solution to the problem definition, and knowledge of what is realistic and possible to create a design artifact. The objectives can be either qualitative or quantitative. A quantitative objective means that the desired solution is better than current ones. Qualitative means that the artifact solves a previously unsolved problem. This activity also requires knowledge of the state of the art, identified in the previous phase.
The objective for this thesis is to create a way for patients to conduct walk/step tests using their phones.
2.3 Design and Development
In this phase, the developed artifact has to have the research contribution embedded into its design. This activity includes both the planning and creation of the artifact. This step requires knowledge of theory that can be used for a solution.
The artifact in this thesis will be the step/walk tests in the Mobistudy application which effectively acts as our way to embed our contribution to an existing stream of research that also aims to acts as a solution.
2.4 Demonstration
This step requires knowledge on how to use the artifact to solve the aforementioned prob-lem by doing experiments, case studies, simulations or other activities.
The results gained from the applications will be compared to a ground truth steps/distance and comparing the two outcomes.
2.4.1 Evaluation
During this activity one compares how well the artifact solves the problem and how ef-fective the solution is. The evaluation can take many shapes and form, it could be a comparison, objective quantitative performance measurements, surveys, client feedback or simulations [20] [23] [22] [21].
This thesis evaluates the results by using comparisons between the ground truth and the implementation as well as objective quantitative performance measurements.
2.4.2 Communication
The final step of the DSRM process is to communicate the results and reflect on the relevance of the study and to illustrate what contribution we are making.
We primarily do this in the discussion (section 5), which thus overall returns our reflections to the general objective of the study rather than look specifically at the research questions.
2.4.3 Methodological Reflections and Study Limitations
This study is limited in scope due to being a bachelors thesis, where the focus lies on the development of the artifacts which serves as the results. The development of these artifacts is also limited to the knowledge of the authors of this thesis. Due to the time frame and scope only the outside Six Minute Walk Test was developed due to both time constraints and not enough knowledge to adequately develop an inside Six Minute Walk Test in the given time frame. The methodology chosen worked perfectly for this thesis as it is focused on creating artifacts for research purposes.
3
Results
In this section, we present the first four phases of the DSRM process [19]. Each phase is presented in its own subsection to provide a clear and systematic structure which also helps show how our research approach has directly helped guide our study.
3.1 Problem Identification
The Six Minute Walk Test (6MWT) was chosen and developed for this application as it is a highly used test to use [5] for measuring the exercise capacity of patients with chronic diseases. The test has been implemented in applications before but requires more testing and validation before its clinical value can be assessed. The objective of the implemented test is to provide a way for patients to perform the Six Minute Walk Test without having to visit a clinicians office. Other tests have been been developed in a standalone way previously whereas this test is implemented and integrated with the Mobistudy platform to allow healthcare professionals to get data from their patients without requiring their presence.
Compared to the Six Minute Walk Test, the Queens College Step Test is designed to be performed by healthier patients. The Queens College Step Test has also been imple-mented in applications before, but not in a way that allows healthcare professionals to use the data collected by the test. The objective of the implemented Queens College Step Test is to allow for patients to perform the Queens College Step Test without having to travel to a clinicians office. This allows the researchers/clinicians to collect data and monitor their patient without having to interact physically with their patient.
3.2 Objectives of a Solution
Mobistudy is an open mobile-health platform for clinical research. The platform has an emphasis on regulatory compliance, patient consent and transparency. The purpose of the platform is to create an operating system independent way for researchers to conduct clinical tests and health research without the the need to invest resources in developing
applications for their specific test / research. The platform is designed alongside clinicians in order to build a platform which does not require further development. The platform uses six high level requirements to ensure that the platform is as dynamic and as versatile as possible. A researcher should be able to setup a new study without the need of a devel-oper, the platform includes a lot of options for data collection, the platform should be as transparent as possible and take care of regulatory compliance and privacy, the platform make use of other existing apps that share their data through standardized APIs, the plat-form should be cross-platplat-form, the platplat-form should be user-friendly. Mobistudy uses an optional consent system meaning that the participants are free to drop out at any time [3]. The platform is built entirely in the JavaScript programming language with the Vue.js Framework [24]. To port the platform to the Android and iOS platforms, Apache Cordova [25] has been used. For styling and design the Quasar Framework [26] which is specifically developed for the Vue.js Framework has been used.
The artifacts created by this thesis are implemented in the Mobistudy App where the objectives of them is to effectively extend the platform by allowing researchers to have their patients preform walk/step tests without interacting with the patients face to face.
3.3 Design and Development
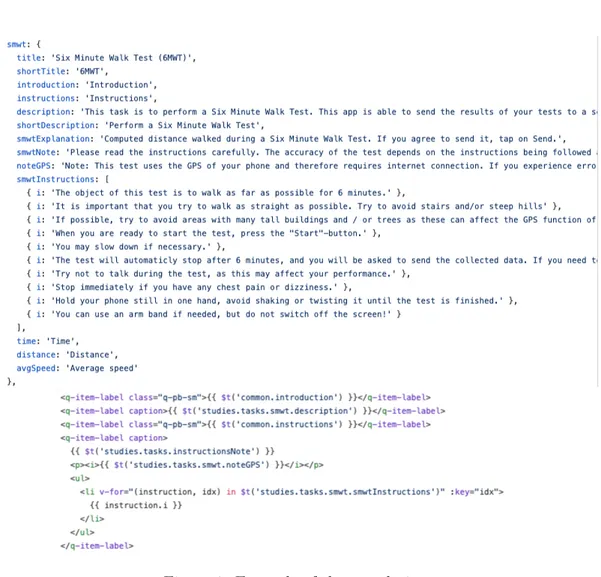
Given the reliance on Vue.js, Quasar Framework and Apache Cordova within Mobistudy, the artifacts created as a part of this thesis are also implemented using these technologies. This means that the developers of a physical capacity test has to adhere to specific syntax and standards which are decided by these different frameworks. Mobistudy also uses a custom setup of ESLint to make sure that all code is formatted in the same way. One major feature of the platform is that it is multilingual meaning that more language than English has to be provided. To solve this the i18n functionality of the Quasar Framework were used. The i18n is a combination between the Quasar Framework and the Vue.js Framework which allows the developer to define strings which means specific things depending on what internationalization is chosen.
Figure 1: Example of the translations.
As shown in the figure above [Fig 1], instead of inputting strings to the application to render text, the developer instead writes a variable for the word or expression. For example the "noteGPS" shown in the example has a Swedish translation and an English translation available which is easily extend to multiple languages.
Each of the capacity tests created in this thesis has their own unique route in the application. The routing used in the application is provided by the vue-router NPM package. The Vue Router is a package created by the official Vue.js creators which ensures that the package is safe and maintained.
The API used by the Mobistudy platform is developed in JavaScript and Node.JS and uses Express, and relies on a NO-SQL database called ArangoDB which the application fetches its data from and writes new data collected to. NO-SQL is a database which com-pared to SQL is not based on relations between the tables. NO-SQL also supports JSON (JavaScript Object Notation) which is highly beneficial when working with JavaScript. NO-SQL is also far more lightweight and offers a more semi-structured and flexible option to the more common SQL [27].
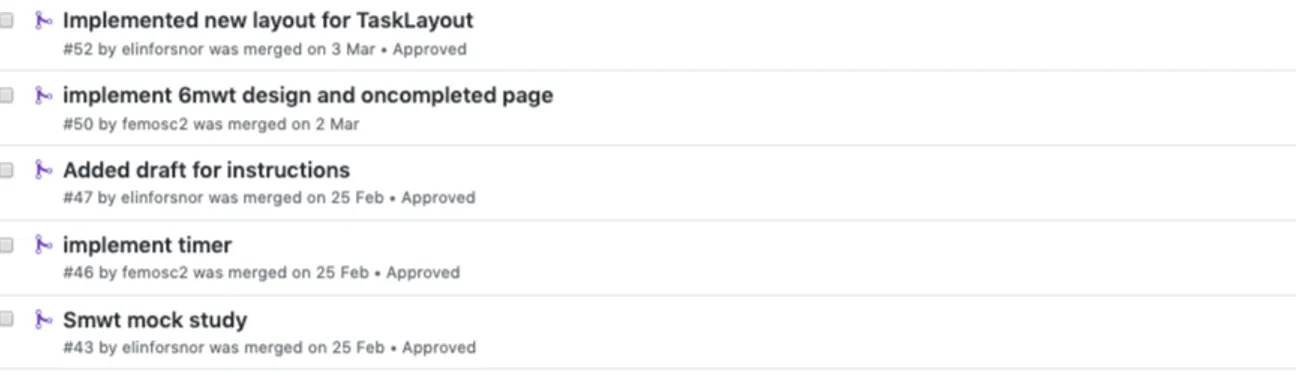
and the web sections of the platform. All of the code is hosted in the official Mobistudy repository on GitHub [28]. Due to the open source nature of the project everyone is free to contribute to the project. To ensure that no malicious code is pushed the project uses a pull request system where a new branch is created for every new feature. The code is then reviewed by someone who is heavily involved with the project to ensure the validity of the code and is then merged with the master branch.
Figure 2: Example of the pull request history.
The project uses Webpack to package the project into a build which can be deployed for widespread use.
The Six Minute Walk Test was designed with the expectations that the patient had no previous information regarding what the Six Minute Walk Test was used for or how it was performed. As we had no prior experience with mHealth or capacity tests we had to do a lot of literature reviewing to understand what the purpose of the tests were, as the patients might also be completely inexperienced in the field of capacity tests they would need some kind of explanation of the test. Therefore one of the first identified tasks was to create an information popup which gave the users direction and information about the Six Minute Walk Test and how to perform it.
Another important feature found during the literature review process was that since the test is performed by patients with chronic diseases, there also has to be a way for them to stop the test [12]. As the Six Minute Walk Test in the Mobistudy app is designed to be performed outside the chosen method to measure the distance was by using the GPS.
3.3.1 Six Minute Walk Test
Given the architecture of the Mobistudy platform, and technologies it relies on, some compatibility issues with NPM packages were found during development. As the artifacts created are meant to run on mobile operative systems, certain plugins and modules where used to be able to mock the functionality of a smartphone. One for the first problems we found was that some Google Maps packages did not work at all or only worked partially. As a solution we chose a custom Google Maps wrapper which we found on the NPM website. The maps requires the coordinates gathered by the phone sensors in order to work. The GPS coordinates are not loaded in synchronously which meant that the map returned an error and did not render. To solve this, the coordinates were gathered when the information modal was presented to the user. When the user closes down the modal the coordinates are gathered and the map renders.
Figure 4: Checking the quality of the GPS-signal
The map centers on the users current location by using the center parameter. As seen in Figure 4, a check is made of the GPS signal to ensure that it is of sufficient quality before the user is able to start the test. This is assessed by checking that the
GPS position contains a value for altitude and that the accuracy is < 15. The accuracy-property is a read-only, strictly double representing the accuracy with a 95% confidence level of the latitude and longitude properties, expressed in meters. Once the signal is of sufficient quality, the user is able to press the ’Start’-button. Once the user starts the test a timer appears. The timer starts at 6:00 and ticks down by using the built-in setInterval() function. There was a conscious decision made in start the timer at 6:00 and counting down instead of starting the timer at 0:00 and counting up as it was seen as a more user friendly experience with the counter counting down. The walk test itself uses an algorithm which calculates the distance the user has walked. If the users phone has pedometer functionality the pedometer determines if the user is moving or not. If the user is not moving the algorithm does not add new GPS nodes to the results. This is to prevent multiple GPS nodes on the same location which would make the total distance inaccurate, even if the deviations in GPS positioning may be small for each new position that the phone receives while standing still. The algorithm is using the accuracy-property of the GPS sample to determine if a sample is good enough. If the accuracy > 5, the sample is values as good enough. Once a sample has been selected, the distance between the previous selected sample and the newly selected one is computed and added to the total.
The user is presented with three different ways to be able to finish once the test has started. The first and primarily intended way is to complete the test by walking for the whole six minutes. Once the six minutes have passed and the timer reaches 0, the algorithm automatically runs a method called completeTest. This method resets all the data fields related to the test and saves the collected data in a data object. The user then gets redirected to the next step of the test. The second way to stop the test is to press the "complete" button. This can be done at any time during the test if the user feels that they can not continue the test for whatever reason. The data from the incomplete test is still saved as an object and the user gets redirected to the next step of the test. The third way is to press the ’Close’-button in the header. When this button is pressed, all data is instantly voided and the user is routed back to the home screen. The reason for including this option is if the user for example is unexpectedly stopped during the test or if they simply pressed the wrong button. Through this method no data is stored.
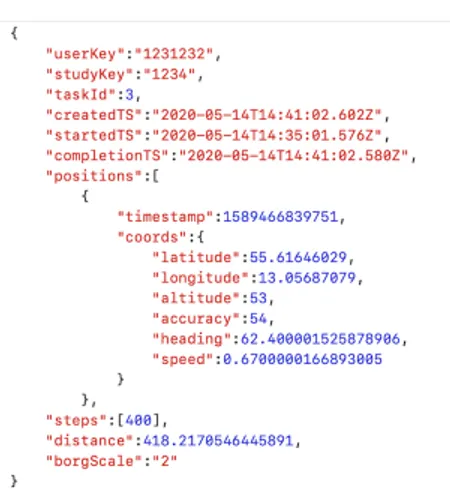
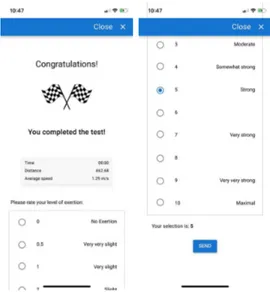
If the user completes the test by walking for six minutes, or by pressing the complete button, the user is then presented with to another screen showing a summary of the test data. The user is then asked to rate their perceived level of exertion using a Borg RPE-scale [29] before pressing the ’Send’-button. The RPE-scale is presented in the form of radio buttons provided by the Quasar Framework. The value of the Borg-scale is added to the data object containing the collected data from the test. Once the user pressed the ’Send’-button, the data object is sent to the API. The API handles the data and stores it in the NO-SQL database. The data is made available to the clinicians by using the web application, where they can see the results of their patients. Data from both completed and uncompleted tests is sent to the server and uploaded to the database and displayed to the clinicians. It is the clinicians who decide what data is relevant or not.
Figure 5: Example of data object for the Six Minute Walk Test
During the early stages of development we also provided a way for users to pause the algorithm of the test (not the timer) in case they had to stand still and rest or wait for a traffic light. However, this was removed later on in the development process as testing showed that the algorithm did a sufficiently good job without this pause function. Reducing the number of options for the users was thus valued higher than the possible added extra precision this may provide. In fact, not being certain that all users always pressed pause at the right time would also have added noise to the collected data. The algorithm for collecting the data was developed in a prior implementation of the Six Minute Walk Test [4], so our focus has not been on algorithm optimization in this study - as also visible from our research objective [11] [4]. The sensors that the algorithm uses are the pedometer and the GPS. As mentioned earlier, the reason for using GPS is that during the literature review it was found that the GPS is the best sensor for calculating distances outside. The reason it is specifically for the outside is that GPS have issues when the sensor is obstructed (by for example a roof). The Six Minute Walk Test implemented by this thesis does not include functionality for handling an indoor Six Minute Walk Test as there is no clear cut choice for calculating distance inside [11] [4], unless sensors such as Bluetooth beacons were added, or each user would calibrate their step length before starting each indoor test. The clinical test assumes that participants walk in a straight line for at least 20 meters (ideally more), which may also be hard to achieve in most indoor settings. The more a user would have to turn around, the greater the risk will be that the distance would be affected in an indoor scenario, so we have left that for future research to work specifically on. An ideal scenario would be for the algorithm to detect when the participants is making too many turns, however due to the nature of the platform the participants should be motivated to complete the test as intended.
3.3.2 Queens College Step Test
The design and implementation of the Queens College Step Test (QCST) is far simpler than the Six Minute Walk Test in that the only required sensor is the pedometer for counting steps. The task requires an information popup before the test begin to educate the patient on what to do and what the test is used for. The information popup describes the pre-settings for the test, describes the step height that should be used and informs the
user that the test is a paced test.
Figure 6: Information popup for the Queens College Step Test)
Since the Queens College Step Test is more physically challenging, it is by design not intended for people with chronic conditions. The Queens College Step Test is a sub-maximal exercise test that is commonly used test to predict VO2max when time is limited, laboratory equipment is unavailable, or it may be considered unsafe to exercise at high intensities. The user steps up and down a platform of 16.25 inches / 41.3 cm at a rate of 22 steps per minute for females and at 24 steps per minute for males. The user steps with a four-step cadence, "up-up-down-down" for a total of 3 minutes. The user stops immediately after the test is completed and are to measure their heart rate for 15 seconds. The number is multiplied by four in order to get the heart rate value in the format of beats per minute. The heart rate is then inserted by the clinician into a formula of their choosing to calculate the estimated VO2max [30].
As mentioned the Queens College Step Test is a far simpler implementation that than the Six Minute Walk Test. The user is presented with the information modal were the information presented to them is scientifically sourced to provide a greater understanding of the test and the application. Compared to the Six Minute Walk Test, this test does not require any specific NPM packages to be installed. The Queens College Step Test simply just uses the pedometer to register movement from the participant and provides a guided way to perform the step test correctly. Once the user has read the instructions and are ready to start the test, a timer appears. The timer starts at 3:00 and ticks down by using the built-in setInterval() function. During the test, the user is notified by audio at the start and end of the test and when they reach 1-minute intervals in the same way they would have been on a clinical setting.
The user is presented with the same three options to complete the test as for the Six Minute Walk Test. Once the three minutes has passed and the timer reaches 0, or the user premature completes the test by pressing the "Complete"-button, the test runs a method
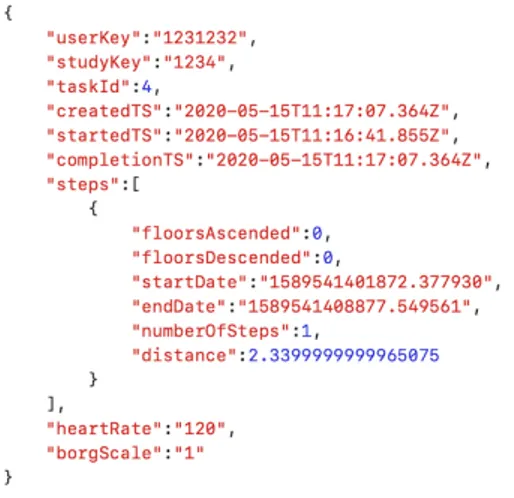
called completeTest. This method resets all the data fields related to the test and saves the collected data in a data object. The user then gets redirected to the next step of the test where they are asked to measure and enter their heart rate and then press the "Next"-button. The user gets redirected and is then presented with to another screen showing a summary of the test data. The user is then asked to rate their perceived level of exertion using a Borg RPE-scale [29] before pressing the ’Send’-button. Once the user pressed the ’Send’-button, the data object is sent to the API and follows the same procedure as for the Six Minute Walk Test. Data from both completed and uncompleted tests is sent to the server and uploaded to the database and displayed to the clinicians. It is the clinicians who decide what data is relevant or not and it is the clinician who do the calculations.
Figure 7: Information popup for the Queens College Step Test)
The pedometer is used to count the number of steps that the user makes to verify that the user is moving up and down the step. The steps measured by the pedometer are not used in the calculation of VO2max, but only aim to get the user to perform the physical activity of the test in order for the user to get an increased heart rate. As mentioned in Section 1, the step test is supposed to have a specific elevation which the participants step up and down from. The implementation currently does not check for changes in elevation as there were no validated ways to test that the user does/does not go up and down during the test. However due to the nature of the Queens College Step Test and this application the participants should be motivated to perform the tests as they should be performed.
3.4 Demonstration of Implementation
A problem which occurs when using Cordova is that the JavaScript code runs fine one the computer it might not be the case for the smartphones, as the artifacts created are meant to run on mobile operative systems certain plugins and modules where used to be able to mock the functionality of a smartphone during development. The mock was used as a way for us to use the app without having to package the application and run it on a smartphones during the development phase.
Most of the data used during the development phase where mocked.
to run the backend. The mocked API enables testing the whole chain of events and mocks everything from participant data to server calls. This was used during the entire development process and the actual API is only used for the production build
To mock GPS data we created a position-object which had the data fields for times-tamp, latitude, magnitude, altitude and accuracy. By using the built-in setInterval() method in JavaScript we are able to simulate movement. For the pedometer parts the same things were used, the setInterval() method were used to increase the steps by one each second as a way to simulate walking.
We discussed whether to give instant feedback to the user regarding if their pace is good enough, but decided to leave this out because of the risk of potentially confuse or stress the participant. Especially because some pedometers provide data with a certain delay, so the user may be actually doing the test correctly, just that the phone doesn’t keep up with the data.
By using mocked data, the output of the test is always the same. This simplified the tests and verified that the algorithm was implemented correctly during the initial development phase.
During the later development stages the tests where validated by doing shortened versions of the tests. The six minute walk test was done in one minute and the paced Queens College Step tests was done in a minute.
Figure 8: Six Minute Walk Test in action.
Figure 10: Queens College Step Test in action.
4
Analysis
Having described the first four phases of the DSRM process [19] in the previous sec-tion, we now move on to the fifth phase. In this evaluation phase, we present the results from three users that in practice used the two sub-maximum tests we devel-oped for the Mobistudy platform. Effectively, this section discusses the validity of the mHealth tests for inclusion in clinical research. The version used for the tests were 11987dd8ec8d1433a3d73424ecb145d3a1431392.
4.1 Evaluation of Six Minute Walk Test
The implementation of the Six Minute Walk Test that this thesis produced was tested in a real life environment. Three participants used the Mobistudy application to perform a Six Minute Walk Test outdoors. Each one of the participants used a different phone for their individual test. While executing the test, the participants also used a trundle wheel to measure the ground truth distance walked during the test. The results between the application and the ground truth was compared. Before the test starts the purpose of the application is presented to the participants. There are many things that can affect accuracy GPS positioning, so-called ’noise’. Some examples of noise are tall buildings or shady trees, hilly terrain and also weather conditions such as overcast and rain. The participant’s are therefore asked to try and walk as straight as possible and try to avoid things that could cause ’noise’. The live test is observed by one of the authors to make sure that the test is performed correctly.
4.1.1 Data
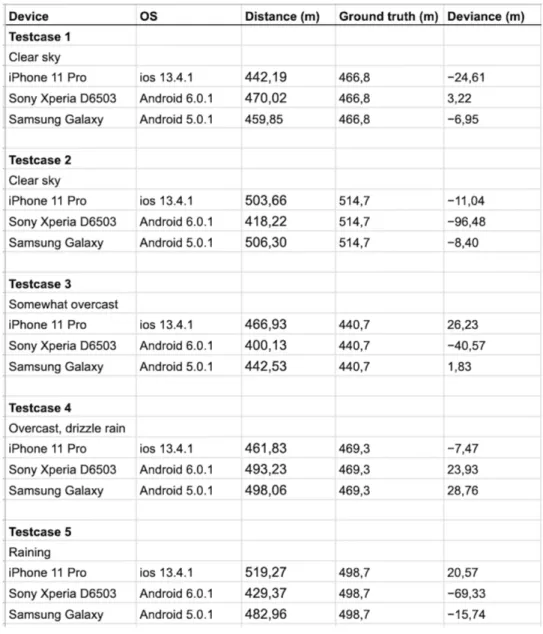
Table 1: Results of the 6MWT tests
In Table 1, the results of the Six Minute Walk tests is shown. Three different phones were used for the tests, an IPhone 11 Pro, a Sony Xperia D6503 and a Samsung Galaxy S4. Each of these phones runs different operative systems and uses different hardware which might affect the accuracy of the tests. Each test case was therefore performed simultaneously by three different participants, using three different phones. Since each individual test case is performed along the same route, the same distance walked and it is issued at the same time, it is possible to link any differences in accuracy to hardware rather than to other external factors mentioned above. The test cases where performed under different weather conditions. For test case 1 and 2 the sky was clear while for test case 3 it was somewhat cloudy. For test case 3 the weather was cloudy and rainy and for
test case 5 it was pouring rain. All of the different tests where also performed in different locations in Malmö.
4.1.2 Data Analysis
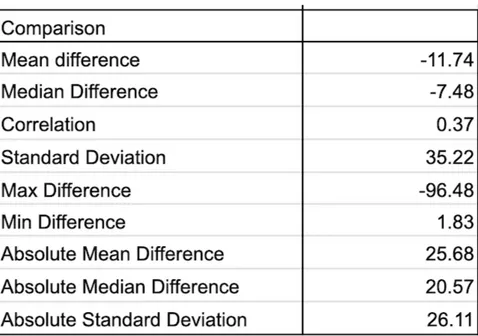
Table 2: Analysis of the 6MWT tests
In Table 2 the analysis of the Data in Table 1 is found. The absolute mean difference being 25.68 means that on average the application is 25.68 meters different than the ground truth (measured by a trundle wheel). The absolute median difference being 20.57 would mean that there are some outliers in the results as the median is noticeably smaller than the mean average. The largest difference recorded during the tests were -96.48 meaning that the application calculated the distance to be 96 meters shorter than the ground truth. Other outliers include -69.33, -40.57, 28.76. Noticeably the -69.33, -40.57 and -96.48 result where all measured by the Sony Xperia D6503 which could indicate that the phone simply have worse sensors than the others. The best result was recorded (1.83) by the Samsung Galaxy. The Samsung Galaxy had the best absolute mean difference at 12.34, second was the IPhone with 17.99 and at last place the Xperia with 46.71. The absolute median for the different phones were 8.4 (Samsung Galaxy), 20.57 (IPhone) and 40.57 (Xperia). There was no major difference on the accuracy of the algorithm that depended on weather conditions.
4.2 Evaluation of Queens College Step Test
To analyze the effectiveness of the implementation of the Queens College Step Test that this thesis produced, the Queens College Step Test was tested in a real life environment. The participants of the test are three men aged 24, 26 and 28. Before the test begins the participants have the purpose of the application explained for them. The participants are
then directed to start the test. Once the participants have started the test, two observers are counting the steps manually in order to gather ground truth data. The results between the data gathered from the application is compared to the ground truth data counted by the two observers. For men, the cadence of a Queens College Step Test is 96 beats per minute, or 24 step-ups per minute, meaning that the total step goal for a completed step test is 72 step-ups, or 288 steps in total.
4.2.1 Data
Table 3: Results of the QCST tests
In Table 3 the results of the Queens College Step Tests tests can be found. As for the Six Minute Walk Test, three different phones where used for the tests, an IPhone 11 Pro, a Sony Xperia D6503 and a Samsung Galaxy S4. Each of these phones runs different operative systems and uses different hardware which might affect the accuracy of the tests. All of the tests were performed on the same day and place using the same step height for each test. All of the participants were able to keep up with the pace of the test, resulting in the same total step count for all test cases. The participants also held the the phones in their hand the same way. Any difference on the accuracy of the step count can therefore be linked to hardware rather than to other external factors.
4.2.2 Data Analysis
Table 4: Analysis of the QCST tests
As seen in the data analysis of Table 4 the absolute mean difference is 97.4 meaning that the application is on average 97.4 steps wrong. The absolute median difference being 22.5 means that the there are quite a few outliers in the results. As in Section 4.1.2 the result varies due to different phones and their sensors. The iPhone had the best results sporting an absolute mean difference of 15.33 and an absolute mean of 287 which means that on average it was 15 steps of the goal of 288 while the average were only off by one. The Samsung Galaxy had an absolute mean of 261.33 and absolute mean difference of 42. These results are worse than the iPhone by a lot which does lend to the theory that the newer phones sensors are simply better. The by far worst of the three phones are once again the Sony Xperia which had an absolute mean of just 24.6 and an absolute mean difference of 266.33. This would mean that on average the Xperia recorded just 24.6 steps while the absolute truth was 288. The absolute median difference of the different phones where 14 (IPhone), 258 (Xperia) and 17 (Samsung).
5
Discussion and Final Reflections
At this point, the remaining phase of the DSRM process [19] is communication of the results and reflecting on the relevance of the study as a whole. We do this by placing our results in relation to previous studies of mHealth implementations, to illustrate what type of contribution we are making. We also summarize the practical experiences of relevance for others developing exercise capacity tests, and the specific design choices we landed on as final implementation. We end by sharing our final reflections on the study as a whole.
5.1 Positioning Our Results
The results of the Six Minute Walk Test could be seen as rather positive. The tests had an absolute standard deviation of 26.1 which would seem that the tests are rather accurate. Due to a lack of resources there were not more phones tested which would be needed in future studies. Worth noting is that one of the tests returned a 96 difference and one returned a 69 difference which are major outliers. Both of these tests came from the same
phone (Sony Xperia) which produced less than satisfactory results in the other tests as well. Worth noting is also that the Six Minute Walk Test performed the same in non-optimal conditions (non-optimal being walking in a straight line, without large buildings and clear weather) which is very positive as that is seemed as a major drawback of using GPS. This would indicate that the algorithm developed by Salvi et Al [4] performs well in urban environments and fulfills it purpose of providing a way to perform the Six Minute Walk test without the need of a clinician.
For the Queens College Step Test the results are not as positive. While the iPhone managed to perform the test at an adequate level the Samsung phone struggled slightly while the Xperia failed miserably. The results of the Xperia seems to indicate that the phones sensors might be an abnormality but due to the lack of resources these tests has to be included. Therefore the Queens College Step Test tests should be deemed unreliable at best due to the lack of test cases. However, it is important to point out that the amount of steps collected has no direct effect on the calculation of VO2max. Using the pedometer is just a way of trying to make sure that the user has actually completed the physical activity, which is a prerequisite for the test to be meaningful. However, the test results indicate that although the pedometer may be good for measuring steps while walking, it is not a sufficiently reliable method for measuring this type of movement and activity.
5.2 Practical Experiences and Design Choices
One of the hardest part about the development of the artifacts was to gain access to the phones sensors. Cordova provides plugins to deal with iOS/Android sensors but these did not always function out of the box. This is due to the fact that Android and iOS applications are not meant to be built with HTML/CSS/JavaScript but rather Kotlin/Java and Swift. However the Quasar Framework did make the development of the user interface easier and provided a lot of pre-built components which was implemented without any difficulties. Implementing the map for the Six Minute Walk Test was also a design choice to give the user more feedback as simply staring on a timer is not very user-engaging. By using a map the user gains some instant feedback and validation that they are moving. During early development the timers went from zero to six/three minutes. However this was later changed as during internal testing it was deemed more user friendly if the timer counted down. Not implementing a way for the user of the Six Minute Walk Test to contact emergency services was also a choice made as we did not possess the knowledge of how to safely implement the feature without it being abused/missclicked.
5.3 Future Work
One of the major downfalls of the created artifact is that the Six Minute Walk Test is only designed for outdoor testing. This is mainly due to how GPS is inaccurate when travelling through roofs. In order for the Six Minute Walk Test to work inside another method has to be developed. This was researched during in Section 1 and there seemed no clear answer to what sensors where the most suitable for doing the Six Minute Walk Test indoors. Another downfall of both artifacts is that they rely on the user to not cheat in the tests. While the nature of the application should motivate the users to be honest with their results nothing stops the users from simply tricking the pedometer or using a GPS
spoofer to move around. The heart rate can also be cheated and the user can simply put in the wrong information. There is also room for user-failure here, meaning that while they are honest they simple do not calculate their heart rate in the correct way. There exists solutions for this as the camera flash can be used to gather the heart rate [31] of the users however due to time constraints this was not implemented but should be implemented in future versions of the artifact.
A way to measure elevation during the Queens College Step Test is something that also should be implemented to prevent the users from cheating by just moving normally. There has been some research done on how to detected cheating in physical activity by using Machine Learning and could be deemed an alternative in the future. Functionality for making sure that the user is walking straight enough during the Six Minute Walk Test could also be an important feature to implement as research shows that the Six Minute Walk Test should be performed in a straight line if possible (Section 1). Another feature which could be important to implement in the Six Minute Walk Test is the ability to contact emergency services if you are feeling unwell. Previous research has shown that having a way for the patient to contact emergency services could be important [32].
Problems that occurred during development concerning the phone sensors where mostly due to Cordova. While Cordova reduces the amount of time required to create the ap-plication compared with creating two separate apap-plications (with for example Kotlin for Android and Swift for iOS) performance is in general lower for cross-platform applica-tions. Accessing the devices sensors and functions is also easier on native apps compared to hybrid apps [33].
For future studies the tests (both Six Minute Walk Test and the Queens College Step Test) has to be performed on many different phones with different operative systems. One of the major downfalls of this study is that it is based on only thee different phones. Far more different phones is required to further validate the study. While doing the data analysis the need for more test cases arose as we quickly found that our results easily became skewed by outliers (such as the Sony Xperia phone). A large amount of phones (10+) would be an optimal amount to ensure the validity of the tests. The we did not test more phones during this thesis was due to us lacking resources to gather more phones.
5.4 Final Reflections
The artifacts created during this thesis proves that raw data can be translated in to clinically-significant metrics as both the steps collected by the Queens College Step Test and the distance calculated with the GPS in the Six Minute Walk Test are data which is required to calculate a patients well-being. The accuracy of the tests are varying, the Six Minute Walk Test has rather satisfactory results even when the application is not used in optimal conditions. This lends to the theory that the algorithm is a great alternative to performing the tests in an analog way. For the Queens College Step Test the tests gave rather unsatisfactory results due to the Sony Xperia phone sensors not working as expected. We feel that the results gathered by the Six Minute Walk Test is far more reliable than the Queens College Step Test however more test with more different phones is required to further validate the tests. A major conclusion of this thesis is that the analysis section is very important as creating an artifact capable of translating raw metrics into data valuable for clinicians is not all that hard. However the accuracy of the data is what
the clinicians value the most. To ensure the validity of the data analysis a lot of tests has to be run and on a lot of different phones and operative systems. There also exists a large amount of far more technically advanced solution as outlined in section 5.3, while the nature of the application should motivate the people using it to use it as intended it can not be guaranteed that the users will not cheat during the tests.
Table 5: Most important sections
In Table 5, an overview over the most important sections of this paper can be found. As noted section 1.4 provide the rather inexperience authors with information regarding how others had researched the subject before and how they had developed artifacts for mHealth. It provided the authors with a strong sense of guidance which helped them throughout the rest of the thesis. In Section 2 the Design Research Methodology is introduced, this methodology was unknown to the authors prior to this thesis. The authors had also no experience with developing artifacts for research and this provided them with a powerful methodology to help structure their work. Section 2.3 provides an overview over the artifacts including a lot of figures to provide what the authors have accomplished with this thesis. In the data analysis the artifact is analyzed and provides insight into the positives and negatives of the application. Finally, the future work section provides a very thorough outline of the downfalls of this thesis and how future thesis could be improved and what features future artifacts in the Walk/Step test domain should have.
References
[1] A. Trifan, M. Oliveira, and J. L. Oliveira, “Passive sensing of health outcomes through smartphones: Systematic review of current solutions and possible limitations.,” JMIR MHEALTH AND UHEALTH, vol. 7, no. 10, 2019.
[2] I. Sim, “Mobile devices and health,” The New England Journal of Medicine, no. 5, 2019.
[3] D. Salvi, J. Lee, C. Velardo, R. Goburdhun, and L. Tarassenko, “Mobistudy: an open mobile-health platform for clinical research,” 09 2019.
[4] D. Salvi, E. Poffley, E. Orchard, and L. Tarassenko, “The mobile-based 6-minute walk test: Usability study and algorithm development and validation.,” JMIR MHEALTH AND UHEALTH, vol. 8, no. 1, n.d.
[5] R. T., L. A. L., N. M. T., W. T. J., and H. A. E., “The six-minute walk test: a useful metric for the cardiopulmonary patient.,” Internal Medicine Journal, no. 8, p. 495, 2009.
[6] H. Bennett, G. Parfitt, K. Davison, and R. Eston, “Validity of submaximal step tests to estimate maximal oxygen uptake in healthy adults.,” SPORTS MEDICINE, vol. 46, no. 5, pp. 737 – 750, n.d.
[7] Statista, “Number of smartphone users worldwide from 2016 to 2021,” 2020. https://www.statista.com/statistics/330695/number-of-smartphone-users-worldwide/, Sidst set 01/03/2020.
[8] P. Klasnja and W. Pratt, “Healthcare in the pocket: Mapping the space of mobile-phone health interventions.,” Journal of Biomedical Informatics, vol. 45, no. 1, pp. 184 – 198, 2012.
[9] J. Siana, T. Therese, W. Suzanne, C. Emma, C. Nishi, and H. Alun D., “Assessment of exercise capacity and oxygen consumption using a 6 min stepper test in older adults.,” Frontiers in Physiology, 2017.
[10] S. Sherra, B. Dina, L. Yves, and T. Scott, “A qualitative systematic overview of the measurement properties of functional walk tests used in the cardiorespiratory domain*.,” Chest, no. 1, p. 256, 2001.
[11] R. M. Ross, J. N. Murthy, I. D. Wollak, and A. S. Jackson, “The six minute walk test accurately estimates mean peak oxygen uptake.,” BMC PULMONARY MEDICINE, vol. 10, 2010.
[12] R. T., L. A. L., N. M. T., W. T. J., and H. A. E., “The six-minute walk test: a useful metric for the cardiopulmonary patient.,” Internal Medicine Journal, no. 8, p. 495, 2009.
[13] P. R. Narkhede, S. Jaimala, and M. Amita, “Comparison of maximal oxygen con-sumption values estimated from six minute walk test and queens college step test.,”
Indian Journal of Physiotherapy Occupational Therapy, vol. 8, no. 1, pp. 154 – 158, 2014.
[14] S. Chatterjee, P. Chatterjee, and A. Bandyopadhyay, “Validity of queen’s college step test for estimation of maximum oxygen uptake in female students,” The Indian journal of medical research, vol. 121, pp. 32–5, 01 2005.
[15] M. . . . Sopalard, J. . . . Leelarungrayub, and J. . . . Klaphajone, “Variation of knee angle and leg length for predicting vo2maxin healthy male volunteers using the queens college step test.,” Journal of Physical Education and Sport, vol. 16, no. 2, pp. 275–280, 2016.
[16] D. . . . Lubans, P. . . . Morgan, R. . . . Callister, and C. . . . Collins, “The rela-tionship between pedometer step counts and estimated vo2 max as determined by a submaximal fitness test in adolescents.,” Pediatric Exercise Science, vol. 20, no. 3, pp. 273–284, 2008.
[17] B.-S. Lin, R.-J. Jhang, and B.-S. Lin, “Wearable cardiopulmonary function evaluation system for six-minute walking test.,” SENSORS, vol. 19, no. 21, n.d.
[18] S. Amagasa, M. Kamada, H. Sasai, N. Fukushima, H. Kikuchi, I.-M. Lee, and S. Inoue, “How well iphones measure steps in free-living conditions: Cross-sectional validation study,” JMIR Mhealth Uhealth, vol. 7, p. e10418, Jan 2019.
[19] P. Ken, T. Tuure, R. Marcus A., and C. Samir, “A design science research methodol-ogy for information systems research.,” Journal of Management Information Systems, vol. 24, no. 3, p. 45, 2007.
[20] S. Chatterjee, J. Byun, K. Dutta, R. U. Pedersen, A. Pottathil, and H. Q. Xie, “Designing an internet-of-things (iot) and sensor-based in-home monitoring system for assisting diabetes patients: iterative learning from two case studies.,” EUROPEAN JOURNAL OF INFORMATION SYSTEMS, vol. 27, no. 6, pp. 670 – 685, n.d. [21] S. Chatterjee, J. Byun, K. Dutta, R. U. Pedersen, A. Pottathil, and H. Q. Xie,
“Designing an internet-of-things (iot) and sensor-based in-home monitoring system for assisting diabetes patients: iterative learning from two case studies.,” EUROPEAN JOURNAL OF INFORMATION SYSTEMS, vol. 27, no. 6, pp. 670 – 685, n.d. [22] “Smsaude: design, development and implementation of a remote/mobile patient
man-agement system to improve retention in care for hiv/aids and tuberculosis patients.,” Journal of Medical Internet Research, no. 1, 2015.
[23] R. Gimbel, L. Shi, J. E. Williams, C. J. Dye, L. Chen, P. Crawford, E. A. Shry, S. F. Griffin, K. O. Jones, W. W. Sherrill, K. Truong, J. R. Little, K. W. Edwards, M. Hing, and J. B. Moss, “Enhancing mhealth technology in the patient-centered medical home environment to activate patients with type 2 diabetes: A multisite feasibility study protocol.,” JMIR research protocols, vol. 6, no. 3, p. e38, 2017. [24] E. You, “Vue.js - the progressive framework,” 2020. https://vuejs.org, Sidst set
[25] Cordova, “Apache cordova,” 2020. https://cordova.apache.org/, Sidst set 01/03/2020. [26] Quasar, “Quasar framework,” 2020. https://quasar.dev/, Sidst set 01/03/2020. [27] A. Zhen Hua Liu, A. Beda Hammerschmidt, and A. Doug McMahon, “Json data
management : supporting schema-less development in rdbms.,” Management of Data, p. 1247, 2014.
[28] Mobistudy, “Mobistudy,” 2020. https://github.com/Mobistudy, Sidst set 01/03/2020. [29] G. A. Borg, “Psychophysical bases of perceived exertion,” Medicine Science in Sports
Exercise, vol. 14, no. 5, pp. 377–381, 1982.
[30] P. G. D. K. e. a. Bennett, H., “Validity of submaximal step tests to estimate maximal oxygen uptake in healthy adults,” Sports Medicine, vol. 46, p. 737750, 2016.
[31] B. . . . Yan, C. . . . Chan, O. . . . To, W. . . . Lai, . . Tse, G. ( 1, C. . . . Li, Y. . . . Poh, and M.-Z. . . . Poh, “Correction: Resting and postexercise heart rate detection from fingertip and facial photoplethysmography using a smartphone camera: A validation study (jmir mhealth uhealth, (2017) 5, 3, 10.2196/mhealth.7275).,” JMIR mHealth and uHealth, vol. 7, no. 1, 2019.
[32] J. E. Morales-Blanhir, C. Palafox Vidal, J. Rosas Romero Mde, M. García Castro, A. Londoño Villegas, M. Zamboni, et al., “Six-minute walk test: a valuable tool for assessing pulmonary impairment,” J Bras Pneumol, vol. 37, no. 1, pp. 110–7, 2011. [33] J. J. Felix Mohammadi Kho’i, “Comparing native and hybrid applications with focus