Structural basis for activation of plasma-membrane
Ca
2
+
-ATPase by calmodulin
Julius Nitsche
1
, Inokentijs Josts
1
, Johannes Heidemann
2
, Haydyn D. Mertens
3
, Selma Maric
4
,
Martine Moulin
5
, Michael Haertlein
5
, Sebastian Busch
6
, V. Trevor Forsyth
5,7
, Dmitri I. Svergun
3
,
Charlotte Uetrecht
2,8
& Henning Tidow
1
Plasma-membrane Ca
2+-ATPases expel Ca
2+from the cytoplasm and are key regulators of
Ca
2+homeostasis in eukaryotes. They are autoinhibited under low Ca
2+concentrations.
Calmodulin (CaM)-binding to a unique regulatory domain releases the autoinhibition and
activates the pump. However, the structural basis for this activation, including the overall
structure of this calcium pump and its complex with calmodulin, is unknown. We previously
determined the high-resolution structure of calmodulin in complex with the regulatory
domain of the plasma-membrane Ca
2+-ATPase ACA8 and revealed a bimodular mechanism
of calcium control in eukaryotes. Here we show that activation of ACA8 by CaM involves
large conformational changes. Combining advanced modeling of neutron scattering data
acquired from stealth nanodiscs and native mass spectrometry with detailed dissection of
binding constants, we present a structural model for the full-length ACA8 Ca
2+pump in its
calmodulin-activated state illustrating a displacement of the regulatory domain from the core
enzyme.
DOI: 10.1038/s42003-018-0203-7
OPEN
1The Hamburg Centre for Ultrafast Imaging & Department of Chemistry, Institute for Biochemistry and Molecular Biology, University of Hamburg, Martin-Luther-King-Platz 6, 20146 Hamburg, Germany.2Heinrich Pette Institute, Leibniz Institute for Experimental Virology, Martinistrasse 52, 20251 Hamburg, Germany.3European Molecular Biology Laboratory Hamburg, Notkestrasse 85, 22607 Hamburg, Germany.4Biofilms- Research Center for Biointerfaces, Department of Biomedical Science, Faculty of Health and Society, Malmö University, Malmö 20506, Sweden.5Life Sciences Group, Institut Laue–Langevin, 6 Rue Jules Horowitz, 38042 Grenoble, France.6German Engineering Materials Science Centre (GEMS) at Heinz Maier-Leibnitz Zentrum (MLZ), Helmholtz-Zentrum Geesthacht, Lichtenbergstr. 1, 85747 Garching bei München, Germany.7School of Life Sciences, Keele University, Staffordshire ST5 5BG, England. 8European XFEL GmbH, Holzkoppel 4, 22869 Schenefeld, Germany. These authors contributed equally: Inokentijs Josts, Johannes Heidemann, Haydyn D. Mertens. Correspondence and requests for materials should be addressed to H.T. (email:tidow@chemie.uni-hamburg.de)
123456789
C
alcium ions (Ca
2+) play a major role as secondary
mes-sengers in numerous signal transduction processes
(reviewed in the ref.
1,2). In order to maintain the
con-centration gradient between low intracellular (100 nM) and high
extracellular (2 mM) Ca
2+that sets the stage for calcium
sig-naling
1, eukaryotic cells have evolved a sophisticated regulation
system involving plasma-membrane Ca
2+-ATPases (PMCAs).
These high-affinity Ca
2+pumps export Ca
2+ions from the
cytosol into the extracellular environment using energy provided
through ATP hydrolysis, and are tightly regulated. They help to
maintain overall Ca
2+homeostasis and provide local control of
intracellular Ca
2+signaling
3,4.
PMCAs belong to the P
2B subfamily of P-type ATPases
5and
play a major physiological role in e.g., for pre-synaptic and
post-synaptic Ca
2+regulation in neurons, feedback signaling in the
heart and sperm motility
6. Compared to other P-type ATPases,
plasma-membrane calcium ATPases contain an additional
auto-inhibitory or regulatory domain. While mammalian PMCAs
contain a C-terminal autoinhibitory domain, in plant ACAs
(autoinhibited Ca
2+-ATPases) this domain is located at the
N-terminus
7. Binding of calmodulin (Ca
2+-CaM) to this region
relieves autoinhibition and results in pump activation, however,
the conformational changes leading to PMCA activation are not
well understood.
To investigate the structural basis for PMCA activation, we
have dissected the underlying binding events of autoinhibition
and activation using biochemical and biophysical methods, and
combined this analysis with small-angle neutron and X-ray
scattering studies of a PMCA pump reconstituted in stealth
nanodiscs, facilitating its structural characterization in a lipidic
solution environment. Using this hybrid approach, we developed
a structural model for the activation of plasma-membrane Ca
2 +-ATPases by calmodulin. In its calmodulin-activated state, the
regulatory domain is displaced from the core, enabling maximal
enzymatic activity. The combination of stealth nanodiscs,
selec-tively deuterated protein components and SANS should be
broadly applicable to many membrane protein complexes.
Results
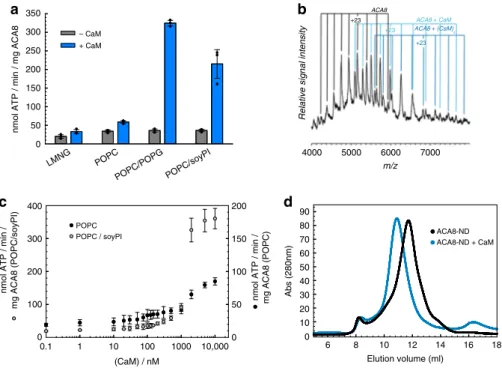
Binding of two calmodulin molecules to ACA8 leads to its
activation. Full-length ACA8 protein was expressed and purified to
homogeneity and its state of inhibition was assessed by the basal
ATPase activity. Binding of calmodulin (CaM7, hereafter denoted
as CaM) to the CaM-binding domain (CaMBD) of detergent
solubilized ACA8 leads to a two-fold increase in ATPase activity of
the pump compared to the basal activity in the absence of CaM
(Fig.
1
a). To gain insights into the stoichiometry of the ACA8-CaM
complexes, DDM-solubilized and purified ACA8 in its apo and
CaM-bound states was analyzed by native mass spectrometry.
Native mass spectrometry is an established method for the precise
determination of protein stoichiometries in soluble and membrane
protein complexes
8. The spectrum shows peaks corresponding to
the apo ACA8, ACA8-CaM (single CaM) and ACA8-CaM
2(two
CaM molecules bound) (Fig.
1
b). In the full m/z range spectrum
highly charged CaM is detected, which dissociated from the weakly
charged ACA8 and the ACA8-CaM complex (Supplementary
Fig. 1). These
findings show that a maximum of two CaM
mole-cules can bind to the full-length ACA8 as previously observed for
the isolated regulatory domain and thereby confirm the proposed
two-step activation mechanism
9.
In order to investigate the structure and conformational changes
of ACA8 in a native-like lipidic environment, we reconstituted the
pump in MSP1D1 nanodiscs (ND) composed of various lipids
(Supplementary Fig. 2). Size-exclusion chromatography profiles of
ACA8 incorporated in nanodiscs for all different types of lipids
indicated a monodisperse sample preparation (Fig.
1
d). ATP
hydrolysis assays in different lipid reconstitutions revealed much
higher activity of CaM-activated ACA8 in the nanodiscs composed
of 1-palmitoyl-2-oleoyl-sn-glycero-3-phosphocholine (POPC)
com-pared to the activity of the ACA8-CaM complex in detergent
micelles (Fig.
1
a), emphasizing the importance of a lipidic
environment for the proper function and activation of ACA8 as
previously demonstrated for human PMCAs
10,11. Reconstitution of
ACA8 into nanodiscs containing 70% POPC and 30% POPG or
70% POPC and 30% soy-PI results in a further 3–5-fold activity
increase of CaM-activated ACA8 compared with POPC alone,
showing that negatively charged head groups are able to further
increase the enzymatic activity once the pump is activated (Fig.
1
a).
Overall, our absolute activity values as well as the activation factors
(activity of ACA8
+ CaM/activity of ACA8) for
nanodisc-incorporated samples are in good agreement with previous results
obtained
using
microsome
preparations
12–15.
To
further
improve our understanding of the role of lipids in ACA8 activation
by CaM we analyzed the basal ATPase activity of ACA8 by titrating
CaM to the apo-ACA8 in POPC and POPC/soy-PI nanodiscs. In
both instances, we observe concentration-dependent increase in the
ATP hydrolysis rate, revealing two transitions, which reflect the
proposed bimodular activation mechanism
9(Fig.
1
c). Additionally,
these experiments show a marked effect of ACA8 activation by
negatively charged lipids at higher CaM concentrations. Above a
CaM concentration of approx. 500 nM, the activity of ACA8 in
nanodiscs composed of soy-PI is shifted to higher pump rates,
indicating that once two CaM molecules are bound, the anionic
headgroup of soy-PI further stimulates the activity. These
findings
are in good agreement with previous studies on PMCAs with a
photo-activatable phosphatidylcholine analog, showing that CaM
and phosphatidic acid behave independently regarding their effects
on enzyme activity and transmembrane conformation
16.
Alto-gether, these results support the bimodular activation mechanism
and further show the importance of diverse surrounding lipids for
the activation process.
CaM-binding induces large conformational changes in ACA8.
In order to investigate the structural changes leading to the
activation of ACA8 by CaM, we carefully dissected the different
binding affinities of the various protein-protein interactions
during activation by using
fluorescence anisotropy (Fig.
2
).
Fluorescence anisotropy detects differences in rotational speed,
which in turn correlates with differences in molecular masses (if
the mass differences are large enough). All experiments were
performed using ACA8 constructs reconstituted in
POPC-nanodiscs.
We
first measured binding of fluorescein-labeled CaM to
full-length ACA8, revealing tight binding with an apparent K
dof 18
nM (Fig.
2
a). In this setup, the measured affinity corresponds to
binding of CaM to the high-affinity binding site and resembles
the value previously determined for CaM-binding to the
isolated regulatory domain
9. To characterize the structural
changes during the activation we expressed and purified the
regulatory domain of ACA8 (ACA8RD, residues 1–130) alone
in E. coli. Next, we assessed the level of secondary structure in
ACA8RD using far-UV circular dichroism spectroscopy. These
experiments indicated that this domain consists partly of
random coil segments with some degree of
α-helicity,
presumably spanning residues 40–95 as observed in the
ACA8RD-(CaM)
2crystal structure
9(pdb:4aqr) (Supplementary
Fig. 3). Titration of the
fluorescein-labeled ACA8RD to the core
of ACA8 (residues 131–1074, a construct lacking the regulatory
domain) yields a dissociation constant (K
d) of 1.7
μM (Fig.
2
b).
decrease in anisotropy (K
0.5approx. 120 nM), indicating that
the displacement of ACA8RD from the core of ACA8 is
dependent on CaM-binding to ACA8RD (Fig.
2
c). The
displacement setup described in Fig.
2
c reports indirectly on
the binding of the second CaM molecule to the low-affinity
binding site, as the regulatory domain will be only displaced
from the ACA8core construct once both CaM are bound.
Overall, these binding experiments indicate that the regulatory
domain binds weakly to the core of the ACA8 pump. Binding of
two CaM molecules to regions on the regulatory domain that
are also involved in binding to the catalytic core
12can then
displace the regulatory domain from the core enzyme. The fact
that the regulatory domain has a higher affinity to CaM than to
the core enzyme suggests that the availability of Ca
2+-loaded
CaM is the dominant factor in the regulation of pump activity.
Displacement of the regulatory domain caused by
CaM-binding can also be observed by size-exclusion chromatography
(SEC). The SEC-profile of the ACA8 + CaM complex in ND
reveals a shift of the elution peak (11.1 ml for complex vs. 11.9 ml
for ACA8 alone) that cannot be simply explained by the binding
of CaM but rather indicates a hydrodynamic expansion of the
complex in solution leading to this drastic change in the particle
elution volume (Fig.
1
d).
With these data in hand the structural changes during
activation were further studied by small-angle X-ray scattering
(SAXS). SAXS is a suitable technique to determine overall
dimensions and shapes as well as
flexibility and larger
conformational changes of biomolecules in solution. We
performed
SAXS
measurements
of
POPC-nanodisc-incorporated ACA8 and its complex with CaM (Fig.
3
). The
LMNG POPC POPC/POP G POPC/soyPI
a
c
b
d
350 – CaM + CaM 300 250 200 150 100 50 0 0 0.1 1 10 100 1000 10,000 0 50 100 150 200 90 4000 5000 6000 +23 +23 +23 ACA8 ACA8 + CaM ACA8 + (CaM)2 7000 m/z 80 70 60 50 40 30 20 10 0 6 8 10 12 14 16 18(CaM) / nM Elution volume (ml)
400 300 POPC POPC / soyPI ACA8-ND + CaM ACA8-ND 200 100
nmol ATP / min / mg ACA8
nmol ATP / min /
mg ACA8 (POPC/soyPI)
nmol ATP / min / mg ACA8 (POPC) Abs (280nm)
Relative signal intensity
Fig. 1 Incorporation of ACA8 in nanodiscs and activation by CaM-binding. a ACA8 ATPase activity assay. Activity was measured (in triplicates) in detergent micelles and nanodiscs containing different lipids in absence or presence of calmodulin.b Native mass spectrometry showing up to two CaM molecules bound to full-length ACA8 in detergent solubilized state. At high acceleration voltages (200 V) proteins are released from the detergent micelles. The masses (Supplementary Table 1) indicate the presence of unbound ACA8 (black), ACA8-CaM (light blue) and ACA8-(CaM)2(dark blue).c CaM-dependent activity measurements of nanodisc-incorporated ACA8. Measurements were performed in nanodiscs containing POPC (black) or POPC/ soyPI mixture (gray) as lipid component with different amounts of CaM added.d Size-exclusion chromatography profile of ACA8 in nanodisc (black line) and in complex with CaM (blue line) showing an expansion once CaM is bound
a
0.19b
c
0.18 0.17 0.16
Anisotropy Anisotropy Anisotropy
0.15 0.14 0.13 0.12 0.16 0.155 0.150 0.145 0.135 0.130 0.125 0.120 0.115 0.140 0.15 0.14 0.13 0.12 0.11 0.10 0.09 0 10 20 30 40 50 60 70 80 0 500 1000 1500 2000 2500 3000 0 100 200 300 400 500 600 700
ACA8-ND (nM) ACA8core (nM) CaM (nM)
+ +
+
Fig. 2 Binding affinities within ACA8-CaM complex investigated by fluorescence anisotropy. a Binding of fluorescein-labeled CaM to full-length ACA8 (Kd = 18 nM). b Binding of fluorescein-labeled regulatory domain (RD) to ACA8core (Kd= 1.7 μM). c Addition of CaM to a preformed complex containing ACA8core and labeled RD. Decrease in anisotropy indicates displacement of RD from ACA8core through CaM-binding to RD. All experiments were performed using protein reconstituted in nanodiscs
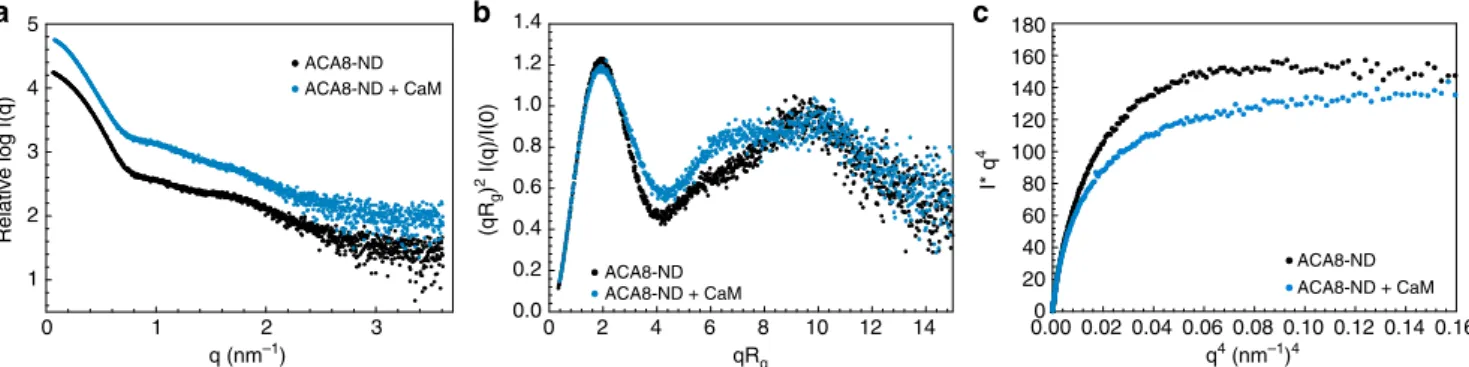
calculated M
rfrom I(0) values are in excellent agreement with the
theoretical values (Table
1
). Binding of CaM leads to an increase
in radius of gyration (R
g) from 5.3 nm for the apo ACA8 to 5.88
nm for the CaM-activated state and a slight increase in maximum
diameter (D
max) (20 nm/22 nm) once CaM is bound (Table
1
/
Supplementary Fig. 4). Beside the increase in R
gand D
maxthe
dimensionless Kratky plot ((qR
g)
2x I(q)/I(0) vs. qR
g) shows
differences in the mid q-range where usually domain movements
are visible, indicating conformational rearrangement and
increased
flexibility, which is most likely due to the displacement
of the regulatory domain upon CaM binding (Fig.
3
b). This data
is in line with the
fluorescence anisotropy data and shows that the
conformational changes upon activation of ACA8 by CaM can be
detected by small-angle X-ray scattering. Moreover, we analyzed
the
flexibility of the regulatory domain in the activated state using
the Porod-Debye plot. A plot of q
4I(q) vs. q
4will achieve a plateau
for more compact molecules and not for more
flexible molecules.
The ACA8-CaM complex does not show a plateau in the low
q-range of the Porod-Debye plot (q
4< 0.1 nm
−4), indicative of a
more diffuse contrast that is consistent with a
flexible
conforma-tion. A clear plateau is visible for ACA8 in its autoinhibited state
(Fig.
3
c). SAXS measurements with ACA8 incorporated in
nanodiscs containing anionic lipids (POPG or soy-PI) did not
show any expansion in the absence of CaM with radii comparable
to those of ACA8 in POPC-nanodiscs (Supplementary Fig. 5).
Binding of CaM to ACA8 in nanodiscs containing anionic lipids
leads to an increase in R
g. This indicates that anionic lipids are
not sufficient to fully activate the pump on their own, however
they seem to play a role in later stages of CaM activation. We
speculate that anionic lipids might stabilize an intermediate
conformation that can readily be activated by CaM-binding
leading to high activity gain (Fig.
1
a).
Structural model of activated ACA8-(CaM)
2complex in
nanodiscs. In order to investigate the structure of ACA8 in its
autoinhibited as well as CaM-activated state in a native-like lipid
environment we made use of the recently developed stealth
nanodisc (sND) technology (Fig.
4
d)
17,18. Stealth nanodiscs are
fractionally deuterium labeled scaffolds consisting of
phosphati-dylcholine lipids and MSP1D1 belt protein; these can be rendered
effectively invisible to low-resolution neutron diffraction using
the appropriate solvent contrast and allow the low-resolution
structure determination of integral membrane proteins in a lipid
environment without contribution of the scaffold to the
small-angle neutron scattering (SANS) signal (Fig.
4
d). Using this
stealth nanodisc / SANS method structural changes involving the
Relative log I(q) (qR
g ) 2 I(q)/I(0) 5 4 3 2 1 q (nm–1) qRg 0 2 4 6 8 10 12 14 0.00 0.02 0.04 0.06 0.08 0.10 0.12 0.14 0.16 q4 (nm–1)4 ACA8-ND ACA8-ND + CaM 0 1 2 3 1.4 1.2 1.0 0.8 0.6 0.4 0.2 0.0 180 160 140 120 100 80 60 40 20 0 I* q 4 ACA8-ND ACA8-ND + CaM ACA8-ND ACA8-ND + CaM
a
b
c
Fig. 3 Small-angle X-ray scattering (SAXS) analysis of nanodisc-incorporated ACA8 and its complex with CaM. a Binding of CaM to ACA8 leads to an increase in Rgand Dmax.b Dimensionless Kratky plot of the data in a highlighting the conformational change of the regulatory domain upon CaM binding to ACA8.c Porod-Debye-Plot plot without plateau for the ACA8-CaM complex indicating a decrease in the overall contrast due to a moreflexible conformation. Data for ACA8 in ND are depicted in black, data for the corresponding complex with CaM are shown in blue
Table 1 SAXS parameters
ACA8-ND (apo) ACA8-ND+ CaM
SAXS SAXS
(SASDEV4) (SASDEW4)
Data collection parameters
Instrument EMBL P12 (PETRA-III, DESY, Hamburg)
Beam geometry 0.2 × 0.12 mm2 Wavelength (Å) 1.24 q range (nm−1) 0.05–4.6 Exposure time (s) 1 (20 × 0.05 s) Concentration range (mg/ ml) 1–8 1–6 Temperature (K) 283 283 Structural parameters I(0) (cm−1) [from p(r)] 0.093 0.129 Rg(Å) [from p(r)] 53.8 60.0
I(0) (cm−1) (from Guinier) 0.094 0.128
Rg(Å) (from Guinier) 53.0 ± 0.9 58.8 ± 1.9
Dmax(Å) 200 220
Porod volume estimate (Å3)
626450 805590
Molecular-mass determination Partial specific volume
(cm3g−1) 0.816
a 0.810a
Contrast (Δp × 1010cm−2) 1.808 1.876
Molecular mass Mr(Da) [from I(0)]
259000 334000
Molecular mass Mr(Da) [from Porod volume (Vp/ 1.6)] 391531 503493 Calculated Mrfrom sequence (Da) 256240a 288240a Software employed
Primary data reduction RADAVER
Data processing PRIMUS/Qt
Computation of model intensities CRYSOL 3D graphics representations PyMOL
aCalculated for a complex composed of 1xACA8+ 2xMSP1D1 + 124xPOPC molecules. This
assumption is based on a homology model of ACA8 incorporated into MSP1D-POPC nanodiscs using the CHARMM GUI web server45
incorporated membrane protein are usually easier to detect and to
model compared to SAXS experiments, as in the sND/SANS
setup only the components of interest contribute to the scattering
signal, while in the SAXS setup the nanodisc also contributes to
the signal. The SAXS measurements, however, provide important
independent controls, as the overall structural trends (such as
increase in R
g, D
max,
flexibility etc.) should also be observable.
Control experiments confirmed that the deuterated disc
constituents do not affect the activation process of ACA8 by
CaM, as the expansion in hydrodynamic radius as well as the
activity is comparable to those in non-deuterated nanodiscs
(Fig.
4
c; Table
2
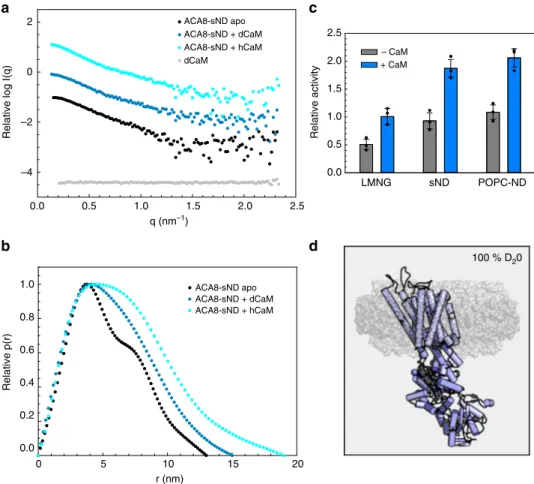
). SANS data were acquired (all in sND) (1) for
apo-ACA8, (2) ACA8 in complex with protonated CaM, and (3)
ACA8 in complex with perdeuterated CaM (dCaM), where only
ACA8 in its activated state contributes to the scattering signal as
the contrast matched-out CaM is invisible to neutron scattering
(Fig.
4
). From the SANS scattering data we could calculate
parameters of overall size (R
g, D
max) that clearly show expansion
of ACA8 upon CaM-binding (Table
2
/Supplementary Fig. 6).
The experimentally derived radius of gyration for ACA8 in
stealth nanodiscs was 4.0 nm for the apo conformation, and the
distance distribution function has a bi-lobed shape with two
peaks, at 3.6 and 7.0 nm, and a maximal particle dimension of 13
nm, which is consistent with a rather compact multi-domain
particle (Fig.
4
b). Once CaM binds to ACA8 both R
gand D
maxshow a large increase to 4.3 nm and 15 nm, respectively, for the
complex with deuterated CaM, which is in line with the SAXS
data. The complex of ACA8 with hydrogenated CaM shows an
even bigger R
gand D
maxof 5.0 nm and 18 nm, respectively,
indicating that the deuterated CaM is effectively matched out in
the ACA8-sND
+ dCaM complex (Fig.
4
a, b; Table
2
). The peak
at 7.0 nm in the distance distribution function becomes less
pronounced and shifts towards larger distances when either
hydrogenated or deuterated CaM are used, indicative of protein
expansion. These data are consistent with the model that the
binding of the regulatory domain to the core is released and the
ACA8 structure becomes less compact relative to the apo
conformation (Fig.
4
b), as already indicated by the SAXS
experiments. Notably, all R
gvalues derived from SANS
measure-ments in sND are smaller than those obtained by SAXS indicating
the minimal scattering contribution of the nanodisc to the SANS
data (Tables
1
and
2
). For this reason, the observed changes upon
activation by CaM are more pronounced in our SANS data using
sND compared to the SAXS data.
In order to generate a structural model for ACA8 in its
activated CaM-bound state, high-quality ACA8
+ dCaM stealth
nanodisc data were obtained from SANS measurements. With the
activating CaM and lipid nanodiscs rendered invisible due to the
partial deuteration strategy employed, the acquired dataset
represents a fully-activated ACA8 in a native-like lipid
environ-ment. We generated a homology model of the
“ACA8 core”
(residues 130–1074) based on a sarco/endoplasmic reticulum Ca
2a
b
c
d
LMNG sND POPC-ND Relative activity 2.5 2.0 1.5 1.0 0.5 0.0 – CaMRelative log I(q)
2 0 –2 –4 + CaM 0.0 0.5 1.0 1.5 2.0 2.5 q (nm–1) ACA8-sND apo ACA8-sND + dCaM ACA8-sND + hCaM dCaM ACA8-sND apo ACA8-sND + dCaM ACA8-sND + hCaM Relative p(r) 1.0 0.8 0.6 0.4 0.2 0.0 r (nm) 0 5 10 15 20 100 % D20
Fig. 4 Small-angle neutron scattering (SANS) analysis of ACA8 and its ACA8-CaM complexes in stealth carrier nanodiscs. a Comparison of SANS scattering data of ACA8 in sND in 100% D2O in apo conformation (black) with data for the corresponding complex with hydrogenated (hCaM) and deuterated CaM (dCaM) (light blue and dark blue, respectively). The deuterated nanodisc components do not contribute to the SANS scattering signal in 100% D2O18. Scattering signal for deuterated CaM (73% deuterated) is shown in gray, showing that dCaM is fully matched out.b Distance distribution (P (r))-plot of the data shown ina indicating that binding of CaM to ACA8 leads to an increase of Dmax.c Activity assay in absence and presence of CaM. d Cartoon illustration of the used stealth carrier nanodisc technique. At 100% D2O the nanodisc components are fully matched out (shown in semi-transparent gray) and only ACA8 (violet) contributes to the scattering signal
+
-ATPase (SERCA) structure in E2 conformation (pdb:3b9b).
We used the long helix (residues 40–95) from the previously
determined crystal structure of the ACA8 regulatory domain in
complex with CaM
9(pdb:4aqr) and generated models of the
linker (96–130) and the N-terminal extension (1–40) in various
conformations using the program RANCH
19,20. The quality of
these models was evaluated by back-calculating the scattering
intensities from the models and
fitting against the measured
SANS data of the complex with deuterated CaM (Fig.
5
).
Although the overall size and shape of the homology model
complexes describe the low-q regions of the SANS data well, no
single model was found to provide a satisfactory
fit to the
experimental data across the entire data range. As the regulatory
domain is expected to be more
flexible in the activated state we
performed ensemble optimized modeling (EOM) analysis to
quantitatively assess changes in the ensemble-averaged
confor-mation upon CaM binding. The use of EOM for the modeling of
SANS data acquired for integral membrane proteins in stealth
nanodiscs is a very promising strategy for the structural
characterization of
flexible IMPs. EOM uses a genetic algorithm
to select an ensemble of conformers of the regulatory domain
whose weighted averaged scattering curve best reproduces the
experimental scattering data
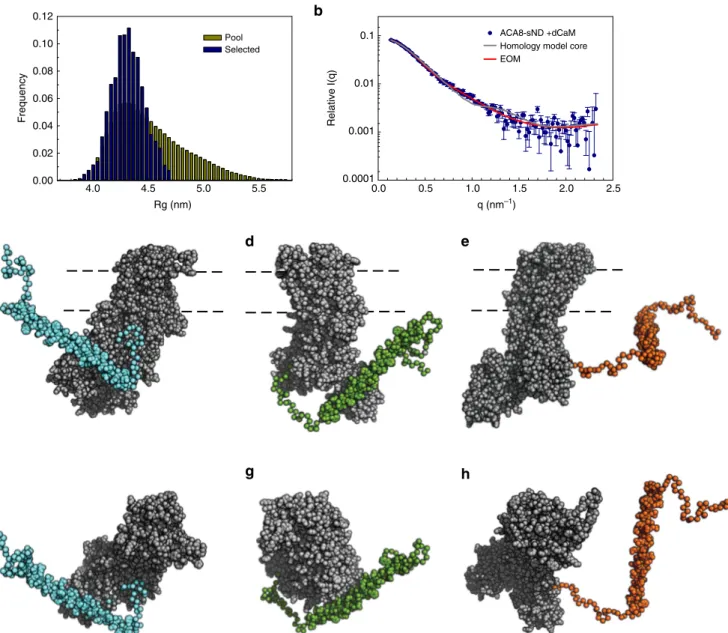
19,20. The selected ensemble (best
performing sub-ensemble) reveals an excellent
fit to the
experimental data (chi
2= 1.0) (Fig.
5
b). Three representative
models with R
gvalues between 4.0 and 4.4 nm show different
orientations of the regulatory domain (Fig.
5
c) and as an
ensemble describe the conformational
flexibility of the complex.
None of the selected conformers contains a fully extended
regulatory domain, which is also apparent in the R
gdistribution
plot that is shifted to smaller R
gvalues for the selected pool
compared to the random pool. The R
gsize-distribution indicates
that the complex occupies a restricted range of conformations
that tend towards the more compact rather than extended
conformations, relative to the random pool. This is also reflected
in the metric R
flexthat provides a quantitative measure for the
flexibility of the system, with R
flexbeing 68.1% for the selected
ensemble and 86.1% for the pool.
Conclusions
Taken together, these data illustrate that CaM-binding to ACA8
leads to displacement of the regulatory domain from the ACA8
core enzyme. This displacement of the regulatory domain releases
the autoinhibition and allows the enzyme to undergo its
con-formational cycle required for the pumping of Ca
2+ions. In
combination with our previous crystal structure of the ACA8
regulatory domain in complex with CaM
9, this structural model
for activated ACA8 reveals the structural basis for activation of
plasma-membrane Ca
2+-ATPase by calmodulin in the context of
the full-length protein in a native-like lipid environment. The
results add further structural insights into the previously
pro-posed bimodular activation mechanism
9showing that binding of
two CaM molecules leads to full activation of this Ca
2+pump via
displacement of the regulatory domain.
Methods
Materials. Detergents and lipids were purchased from the following companies: DDM (#D310/Anatrace), LMNG (#NG310/Anatrace), cholate (#3407.1/Roth), POPC (#850457 P/Avanti Polar Lipids), POPG (#840457P/Avanti Polar Lipids), soyPI (#840044P/Avanti Polar Lipids). All other chemicals were of analytical grade and obtained from Roth (Karlsruhe, Germany) or Sigma Aldrich (St. Louis, MO, USA). Expression and purification of full-length ACA8, ACA8core, and ACA8RD. ACA8 was overexpressed with an N-terminal His8-tag in S. cerevisiae strain BJ5460 (MATa ura352 trp1 lys2801 leu2delta1 his3delta200 pep4::HIS3 prb1delta1.6R can1 GAL)21using a pYES2 plasmid. Large-scale cultures were grown in
uracil-depleted media (6.7 g l−1YNB)+ 0.1% glucose at 30 °C up to an OD600of 0.6 and expression was induced by adding 2% galactose. Cells were harvested 20 h post induction by centrifugation at 3000xg and resuspended in 30 mM Tris pH 8.0, 300 mM NaCl, 20% (v/v) glycerol, 3 mM ß-mercaptoethanol, 20 mM EDTA (buffer A)
Table 2 SANS parameters
ACA8-sND (apo) ACA8-sND+ dCaM ACA8-sND+ CaM
SANS SANS SANS
(SASDES4) (SASDET4) (SASDEU4)
Data collection parameters
Instrument SANS-1 (MLZ, Munich) SANS-1 (MLZ, Munich) SANS-1 (MLZ, Munich)
Wavelength (Å) 5.0 5.0 5.0 q range (nm−1) 0.12–2.4 0.12–2.4 0.12–2.4 Exposure time (s) 7200 7200 7200 Concentration (mg/ml) 3.5 3.2 3.0 Temperature (K) 283 283 283 Structural parameters I(0) (cm−1) [from p(r)] 0.11 0.1 0.15 Rg(Å) [from p(r)] 42.5 45.8 52.9
I(0) (cm−1) (from Guinier) 0.11 0.092 0.1
Rg(Å) (from Guinier) 40 42.8 50
Dmax(Å) 130 150 180
Porod volume estimate (Å3) 202000 217000 297000
Molecular-mass determination
Partial specific volume (cm3g−1) 0.744 0.744 0.739
Contrast (Δp x 1010cm−2) −3.320 −3.320 −3.299
Molecular mass Mr(Da) [from Porod volume (Vp/1.6)] 126250 135625 185625
Calculated Mrfrom sequence (Da) 118000 118000 150000
Software employed
Primary data reduction BerSANS BerSANS BerSANS
Data processing PRIMUS/Qt PRIMUS/Qt PRIMUS/Qt
Rigid-body modeling EOM
Computation of model intensities CRYSON CRYSON CRYSON
before being disrupted with glass beads. Following clearing of the lysate, cell membranes were isolated by centrifugation at 180,000×g and membranes were solubilized in buffer A with 1% lauryl maltose neopentyl glycol (LMNG) for 1.5 h with gentle stirring. To remove insoluble material the solubilized membranes were centrifuged at 100,000×g and supernatant were incubated with Ni2+affinity resin. Resin was washed with buffer containing 30 mM Tris pH 8.0, 300 mM NaCl, 2 mM CaCl2, 1 mM ß-mercaptoethanol, 0.005% LMNG and 40 mM imidazole and ACA8 were eluted with 150 mM imidazole. The purity of ACA8 was judged by SDS-PAGE and corresponding fractions were pooled and concentrated to 2 mg/ml before reconstituted into nanodiscs. The ACA8 mutant lacking the regulatory domain (ACA8core) was expressed and purified in the same way as the full-length protein.
The regulatory domain of ACA8 (aa 1–130) (ACA8RD) was cloned as a fusion construct with an N-terminal His6-lipoamyl-TEV-tag22in the pET28a vector and a cysteine was introduced right before thefirst residue of the regulatory domain to allow site specific labeling with thiol-reactive probes. ACA8RD was co-expressed together with CaM7 in E. coli strain C4123, grown in 2xTY media at 20 °C for 16 h.
Cells were harvested at 4000×g and resuspended in buffer containing 30 mM Tris pH 7.5, 300 mM NaCl, 10% glycerol, 2 mM CaCl2, 1 mM Tris-(2-carboxyethyl)-phosphin (TCEP) (buffer D) before lysed using high-pressure homogenizer (EmulsiFlex-C3, Avestin). The cleared lysate was loaded on HisTrap column, pre-equilibrated with buffer D and washed with 20 mM imidazole before eluted with 200 mM imidazole followed by TEV protease digestion and a second nickel affinity chromatography step to separate the His-lipoamyl-TEV tag.
Expression and purification of CaM7. CaM7 from A. thaliana was used as cal-modulin ortholog throughout this study. CaM7 in pET42a vector was transformed into E.coli Bl21 Gold (DE3) and grown in LB medium at 37 °C. After induction of protein expression with 0.5 mM isopopropyl ß-D-1-thiogalactopyranoside (IPTG), cells were grown for another 16 h at 20 °C and harvested by centrifugation at 3000 × g. Cells were resuspended in 30 mM Tris pH 7.5, 50 mM NaCl, 1 mM ß-ME, 2 mM CaCl2(buffer B) and broken using high-pressure homogenizer (EmulsiFlex-C3, Avestin). The lysate was cleared by centrifugation at 40,000 × g and the supernatant was bound to HiTrap Phenyl HP column, pre-equilibrated with buffer B. CaM7 was eluted with 5 mM EDTA. Fractions containing pure CaM7 were pooled, concentrated to 10 mg/ml and stored at−80 °C until further use.
Expression and purification of membrane scaffold protein MSP1D1. MSP1D1 in pET28a vector was transformed in E.coli strain BL21 (DE3) and grown in terrific broth (TB) media at 37 °C. At an OD600of 1.5 the protein expression was induced by adding 1 mM isopropyl ß-D-1-thiogalactopyranoside (IPTG) and cells were grown for 4 h at 37 °C. The protein was purified according to a modified protocol established by Sligar and co-workers24. Briefly, cells were harvested by
cen-trifugation at 3000×g, resuspended in lysis buffer (50 mM Tris pH 8.0, 500 mM NaCl) with 1% Triton X–100 and broken using sonication. The cleared lysate was loaded onto a HisTrap column and washed with ten column volumes each of lysis buffer containing 1% Triton X-100 and 50 mM cholate, respectively. MSP1D1 was eluted with buffer containing 500 mM imidazole, and fractions containing pure
a
c
b
d
e
f
g
h
Frequency Relative I(q)
0.12 0.10 0.08 0.06 0.04 0.02 0.00 Rg (nm) q (nm–1) 0.0 0.5 1.0 1.5 2.0 2.5 4.0 4.5 5.0 5.5 Pool 0.1 0.01 0.001 0.0001 Selected ACA8-sND +dCaM Homology model core EOM
Fig. 5 Structural model of the activated ACA8-(CaM)2complex. The Ensemble Optimization Method (EOM)20was used to generate and select a pool of models with different conformations of the regulatory domain (a) that were subsequently used tofit the experimental SANS data (acquired in stealth nanodiscs) (b). c–h The resulting representative models for the activated ACA8-(CaM)2complex from the best-fitting sub-ensemble show ACA8core (gray) with the regulatory domain in three different conformations (cyan, green and orange).f–h are rotated by 90 degrees
protein were pooled and incubated with TEV protease overnight. Subsequently, the protease and cleaved His-tag were separated by applying a second IMAC chro-matography step and MSP1D1 without His-tag was concentrated up to 400 µM and stored at−80 °C until further use.
Expression and purification of deuterated membrane scaffold protein MSP1D1 (dMSP1D1), deuterated phosphatidylcholine (dPC), and deuterated calmo-dulin (d-CaM7). Matchout-labeled MSP1D1 (d-MSP1D1) was overexpressed in E. coli strain BL21 (DE3) as previously described25,17. After adaption of the strain to
minimal deuterated medium26, cultures were grown inflaks in 85% deuterated
minimal medium with glycerol as a carbon source27. The protein was purified
according to a modified protocol established by Sligar and co-worker24(as
described above for non-deuterated protein).
Selectively deuterated mixed acyl phosphatidylcholine, PC, was produced in a modified E. coli strain grown in minimal 100% deuterated medium supplemented with deuterated glycerol (C3D8O3) and partially deuterated choline chloride (trimethyl- d9, 98%; Eurisotop) as previously described28. Total phospholipids
were extracted using the method of Bligh and Dyer29and purified according to
head-group using silica-gel column chromatography with varying ratios of chloroform and methanol as previously described28.
Matchout-labeled CaM7 (d-CaM7) with a deuteration level of 73% was overexpressed in E. coli strain BL21 (DE3) adapted to growth in deuterated minimal medium30. A 1.8 l (final volume) deuterated high cell-density fed-batch
fermenter culture25was carried out at 30οC. Feeding with glycerol was started at
an OD600value of about 5. Expression of d-CaM was induced at an OD600of about 12 by addition of IPTG (0.5 mMfinal concentration). Cells were harvested at an OD600of 19 yielding 100 g wet weight of matchout-labeled cell paste. Cells were resuspended into buffer containing 30 mM Tris pH 8.0, 100 mM NaCl, 1 mM CaCl2, lysed using a high-pressure homogenizer (EmulsiFlex-C3) and purified by hydrophobic affinity chromatography (using a HiTrap Phenyl HP column), as described above.
Reconstitution of ACA8 into (stealth) nanodiscs. For reconstitution of ACA8 or ACA8core into nanodiscs, 50 mM lipids (1-palmitoyl-2-oleoyl-sn-glycero-3-phos-phocholine (POPC), 1-palmitoyl-2-oleoyl-sn-glycero-3-phospho-(1’-rac-glycerol) (POPG) or L-α-phosphatidylinositol (soy-PI) (Avanti Polar Lipids)) were dissolved in a buffer containing 30 mM Tris pH 8.0, 200 mM NaCl, 2 mM CaCl2, 1 mM ß-mercaptoethanol (buffer C) and 100 mM cholate. Lipid mixtures contained 70% POPC and 30% POPG or 70% POPC and 30% soy-PI, respectively. ACA8, the MSP1D1 membrane scaffold protein and the lipids were mixed in a molar ratio of 1:5:150 in buffer C containing 20 mM cholate and incubated for 1 h at 4 °C. By adding detergent removal beads (Thermo Fischer Scientific) in a 1:1 (v/v) ratio, detergents were removed to initiate the nanodisc assembly and the sample was incubated over night at 4 °C under constant agitation. Detergent removal beads were removed and the sample cleared by centrifugation before subsequent pur-ification of nanodisc-embedded ACA8 on a Superdex200 column (GE Healthcare) in a buffer containing 20 mM Tris pH 8.0, 150 mM NaCl, 1 mM CaCl2, 1 mM ß-mercaptoethanol. For reconstitution of ACA8 in stealth carrier nanodiscs (sND) the molar ratio of all components and the protocol was kept unchanged, but deuterated MSP1D1 and deuterated PC were used and the assembled stealth nanodiscs were dialyzed extensively against D2O-based buffer.
Native mass spectrometry (NMS). Detergent (DDM)-solubilized ACA8 was exchanged to 200 mM ammonium acetate solution pH 8.3, 2x CMC (0.018%) DDM using centrifugalfilter units (Vivaspin 500, 100,000 MWCO, Sartorius) at 4 ° C and 15,000×g. Nano electrospray ionization (ESI) capillaries were prepared as described before31.
Native MS experiments were performed with a nanoESI source in positive ion mode on a QToF2 (Waters and MS Vision) that was modified for the analysis of high-mass ions32. 7 mbar source pressure and 1.7 × 10⁻²mbar argon as collision
gas were used. Capillary and cone voltages were set to 1.7 kV and 190 V, respectively. The collision energy was ramped up to 400 V, the illustrated spectra were recorded at 200 V. CsI (25 mg/ml) spectra were acquired and used to calibrate raw data using MassLynx software (Waters). Data were analyzed using MassLynx and Massign33.
Activity measurements. ACA8 activity was measured either in LMNG or nanodisc composed of different lipids as well as stealth carrier nanodisc using the Baginski assay34. All reactions were performed in buffer containing 150 mM NaCl,
30 mM Tris-HCl (pH 7.4 at 25 °C), 2 mM MgCl2, 1.95 mM EGTA, and 2 mM CaCl2, resulting in 50μM final free Ca2+concentration. Three microgram of purified ACA8 in LMNG and 2 µg ACA8 in nanodisc were incubated in 50 µl sample buffer with 1 mM ATP for 10 min at 25 °C before the reaction was stopped by adding 50 µl ascorbic acid solution (140 mM ascorbic acid, 0.5 M HCl, 0.1% SDS, 5 mM ammonium heptamolybdate). The addition of 75 µl containing 75 mM sodium citrate, 2% (w/v) sodium metaarsenite and 2% (v/v) acetic acid stopped the colorimetric reaction and the absorbance at 860 nm was read on a Tecan In fi-nite200 microplate reader after 10 min. Calmodulin was added in a range between 5 nM and 10 µM prior ATP addition. All activity measurements were performed
under initial velocity conditions. The spontaneous and non-enzymatic hydrolysis of ATP just in buffer was subtracted from the measurements with ACA8. Mixed lipids contained 70% POPC and 30% POPG or 70% POPC and 30% soy-PI, respectively. A calibration curve using sodium phosphate in a concentration range from 0.01 to 0.6 mM was used for determining the concentration of released phosphate. All reactions were measured as triplicates.
Fluorescence anisotropy titration. Forfluorescence anisotropy measurements Alexa Fluor 488 C5maleimide was used to label ACA8RD or CaM. For fluores-cence labeling Alexa Fluor 488 C5maleimide were added to 40 µM ACA8RD-(CaM7)2or 40 µM CaM, respectively, in a molar ratio of 10:1 and incubated overnight at 4 °C. The reaction were stopped by adding 5 mM ß-mercaptoethanol, freefluorescein isothiocyanate (FITC) was separated with a PD10 column and the ACA8RD-(CaM)2complex were dissociated by adding 10 mM EDTA followed by binding of ACA8RD to a cation exchange chromatography column to separate both proteins. Fractions containing ACA8RD were pooled, concentrated andflash frozen in liquid nitrogen until further use. FITC-labeled CaM was used directly after PD10 column. Measurements were performed on an Agilent Cary Eclipse fluorescence spectrophotometer. Fluorescence anisotropy was measured with excitation at 480 nm and emission at 520 nm and slit width of 10 nm. Each measurement was integrated over 5 s and the photomultiplier voltage was set to 700 V. Reactions were carried out at 20 °C in buffer containing 30 mM Tris pH 8.0, 150 mM NaCl, 2 mM CaCl2, 0.5 mM TCEP. In the binding experiments, 25 µM ACA8core (in POPC nanodiscs) were titrated into 50 nMfluorescein-labeled ACA8RD or full-length ACA8 (in POPC nanodiscs) was titrated into 15 nM FITC-labeled CaM. Dissociation constants were obtained byfitting anisotropy data to the equation corresponding to a one-site binding model with robs= r0+ (Δr × [P]) / (Kd+ [P)]
Small-angle X-ray scattering (SAXS)18. SAXS was measured using the Bio-SAXS
instrument P12 on the storage ring Petra III (DESY, Hamburg, Germany)35. The
scattered intensity was recorded as a function of the scattering vector q with qj j = 4 π sinθ/λ, using a wavelength of 0.124 nm. All SAXS measurements were carried out at 10 °C in 30 mM Tris pH 7.5, 150 mM NaCl, 2 mM CaCl2, 2 mM MgCl2and 0.5 mM TCEP at protein concentrations ranging from 1 to 8 mg/ml with exposure times of 20 × 0.05 s. The average of the data was normalized and background subtracted using automatic procedures on the beamline36. Calibration of the scattering intensity into
absolute units of cm−1was performed using the forward scattering intensity of bovine serum albumin. The radius of gyration was evaluated from the experimental SAXS pattern using the Guinier approximation and as well as from the entire scattering curve using the program GNOM37. The latter also provided the distance distribution
function, p(r), and the maximal dimension, Dmax(see Table1).
Small-angle neutron scattering (SANS)18. SANS data of ACA8 in the
auto-inhibited as well as in the activated state (with hydrogenated and deuterated cal-modulin) were collected at the SANS-1 beamline at Forschungs-Neutronenquelle Heinz Maier-Leibnitz (FRMII) in Munich38. All measurements were performed in
100% D2O buffer (30 mM Tris pH 7.5, 150 mM NaCl, 1 mM MgCl2, 1 mM CaCl2) using a sample concentration of 3.0–3.5 mg/ml at 10 °C. Measurements at FRMII were performed at 5 Å wavelength with a sample-detector distance of 5.5 m (0.01 < q < 0.23 Å−1) where the detector was moved by 404 mm in direction perpendicular to the beam. Water reference sample (H2O), buffers, empty cell, the direct beam and the total absorber boron-cadmium were measured as well to perform data reduction using the BerSANS software and yielded one-dimensional scattering intensities I(q). The scattering curves of all samples were buffer subtracted using the software PRIMUS36and the radii of gyration were extracted by the Guinier
approximation. For SANS data sets at 100% D2O molecular mass estimates were obtained from the forward scattering (I0), with the contrast and partial specific volume as determined from the solution components and protein sequence using the MULCH server (http://smb-research.smb.usyd.edu.au/NCVWeb/)39. All SANS
and SAXS scattering parameters have been included in Tables1and2according to the recommended publication guidelines for small-angle scattering studies40.
Model calculation from SANS data (ACA8 in stealth carrier nanodiscs). The conformationalflexibility of ACA8 in its activated state was probed using the ensemble optimized modeling (EOM) program20. A homology model of ACA8core
(130aa-1074aa) was generated with the program Phyre241using the SERCA
structure in E2 conformation (pdb:3b9b). A pool of 10,000 ACA8 full-length models with the different conformations of the regulatory domain was generated with RANCH20by using the ACA8core homology model and the crystal structure
of the regulatory domain (pdb:4aqr) as input domains. Theoretical scattering intensity of each model was computed with CRYSON42. The genetic algorithm
method, GAJOE20, from the EOM package was subsequently used to select a subset
of models, whose weighted average scattering curve showed the bestfit to the data of ACA8-dCaM complex (Fig.5a / Supplementary Fig. 7). Structural models were displayed using PyMOL43.
Data availability
The SAXS and SANS data have been deposited at the SASBDB (www.sasbdb.org) and have been assigned the following accession codes: SASDES4, SASDET4, SASDEU4, SASDEV4, SASDEW4 (see Tables 1, 2). The mass spectrometry data have been deposited to the ProteomeXchange Consortium via the PRIDE44partner
repository with the dataset identifier PXD011177. All other relevant data generated and/or analyzed during the current study are available from the corresponding author on reasonable request.
Received: 4 June 2018 Accepted: 26 October 2018
References
1. Clapham, D. E. Calcium signaling. Cell 131, 1047–1058 (2007). 2. Berridge, M. J. Calcium signalling remodelling and disease. Biochem. Soc.
Trans. 40, 297–309 (2012).
3. Di Leva, F., Domi, T., Fedrizzi, L., Lim, D. & Carafoli, E. The plasma membrane Ca2+ATPase of animal cells: structure, function and regulation. Arch. Biochem. Biophys. 476, 65–74 (2008).
4. Brini, M. & Carafoli, E. Calcium pumps in health and disease. Physiol. Rev. 89, 1341–1378 (2009).
5. Axelsen, K. B. & Palmgren, M. G. Evolution of substrate specificities in the P-type ATPase superfamily. J. Mol. Evol. 46, 84–101 (1998).
6. Strehler, E. E., Filoteo, A. G., Penniston, J. T. & Caride, A. J. Plasma-membrane Ca(2+) pumps: structural diversity as the basis for functional versatility. Biochem. Soc. Trans. 35, 919–922 (2007).
7. Bonza, M. C. et al. At-ACA8 encodes a plasma membrane-localized calcium-ATPase of Arabidopsis with a calmodulin-binding domain at the N terminus. Plant Physiol. 123, 1495–1506 (2000).
8. Laganowsky, A., Reading, E., Hopper, J. T. & Robinson, C. V. Mass spectrometry of intact membrane protein complexes. Nat. Protoc. 8, 639–651 (2013). 9. Tidow, H. et al. A bimodular mechanism of calcium control in eukaryotes.
Nature 491, 468–472 (2012).
10. Pignataro, M. F. et al. Modulation of plasma membrane Ca2+-ATPase by neutral phospholipids: effect of the micelle-vesicle transition and the bilayer thickness. J. Biol. Chem. 290, 6179–6190 (2015).
11. Filomatori, C. V. & Rega, A. F. On the mechanism of activation of the plasma membrane Ca2+-ATPase by ATP and acidic phospholipids. J. Biol. Chem. 278, 22265–22271 (2003).
12. Baekgaard, L., Luoni, L., De Michelis, M. I. & Palmgren, M. G. The plant plasma membrane Ca2+pump ACA8 contains overlapping as well as physically separated autoinhibitory and calmodulin-binding domains. J. Biol. Chem. 281, 1058–1065 (2006).
13. Fusca, T. et al. Single point mutations in the small cytoplasmic loop of ACA8, a plasma membrane Ca2+-ATPase of Arabidopsis thaliana, generate partially deregulated pumps. J. Biol. Chem. 284, 30881–30888 (2009).
14. Bonza, M. C. & Luoni, L. Plant and animal type 2B Ca2+-ATPases: evidence for a common auto-inhibitory mechanism. FEBS Lett. 584, 4783–4788 (2010).
15. Giacometti, S. et al. Phosphorylation of serine residues in the N-terminus modulates the activity of ACA8, a plasma membrane Ca2+-ATPase of Arabidopsis thaliana. J. Exp. Bot. 63, 1215–1224 (2012).
16. Mangialavori, I. et al. Plasma membrane calcium pump (PMCA) differential exposure of hydrophobic domains after calmodulin and phosphatidic acid activation. J. Biol. Chem. 286, 18397–18404 (2011).
17. Maric, S. et al. Stealth carriers for low-resolution structure determination of membrane proteins in solution. Acta Crystallogr. D 70, 317–328 (2014). 18. Josts, I. et al. Conformational states of ABC transporter MsbA in a lipid environment investigated by small-angle scattering using stealth carrier nanodiscs. Structure 26, 1072–1079 (2018).
19. Tria, G., Mertens, H. D., Kachala, M. & Svergun, D. I. Advanced ensemble modelling offlexible macromolecules using X-ray solution scattering. IUCrJ 2, 207–217 (2015).
20. Bernado, P., Mylonas, E., Petoukhov, M. V., Blackledge, M. & Svergun, D. I. Structural characterization offlexible proteins using small-angle X-ray scattering. J. Am. Chem. Soc. 129, 5656–5664 (2007).
21. Jones, E. W. Tackling the protease problem in Saccharomyces cerevisiae. Methods Enzymol. 194, 428–453 (1991).
22. Tidow, H., Veprintsev, D. B., Freund, S. M. & Fersht, A. R. Effects of oncogenic mutations and DNA response elements on the binding of p53 to p53-binding protein 2 (53BP2). J. Biol. Chem. 281, 32526–32533 (2006).
23. Miroux, B. & Walker, J. E. Over-production of proteins in Escherichia coli: mutant hosts that allow synthesis of some membrane proteins and globular proteins at high levels. J. Mol. Biol. 260, 289–298 (1996).
24. Ritchie, T. K. et al. Chapter 11 - Reconstitution of membrane proteins in phospholipid bilayer nanodiscs. Methods Enzymol. 464, 211–231 (2009). 25. Dunne, O. et al. Matchout deuterium labelling of proteins for small-angle
neutron scattering studies using prokaryotic and eukaryotic expression systems and high cell-density cultures. Eur. Biophys. J. 46, 425–432 (2017). 26. Artero, J. B., Hartlein, M., McSweeney, S. & Timmins, P. A comparison of refined X-ray structures of hydrogenated and perdeuterated rat gammaE-crystallin in H2O and D2O. Acta Crystallogr. D 61, 1541–1549 (2005). 27. Rochel, N. et al. Common architecture of nuclear receptor heterodimers on
DNA direct repeat elements with different spacings. Nat. Struct. Mol. Biol. 18, 564–570 (2011).
28. Maric, S. et al. Biosynthetic preparation of selectively deuterated
phosphatidylcholine in genetically modified Escherichia coli. Appl. Microbiol. Biotechnol. 99, 241–254 (2015).
29. Bligh, E. G. & Dyer, W. J. A rapid method of total lipid extraction and purification. Can. J. Biochem. Physiol. 37, 911–917 (1959).
30. Haertlein, M. et al. Biomolecular deuteration for neutron structural biology and dynamics. Methods Enzymol. 566, 113–157 (2016).
31. Garcia-Alai, M. M. et al. Epsin and Sla2 form assemblies through phospholipid interfaces. Nat. Commun. 9, 328 (2018).
32. van den Heuvel, R. H. et al. Improving the performance of a quadrupole time-of-flight instrument for macromolecular mass spectrometry. Anal. Chem. 78, 7473–7483 (2006).
33. Morgner, N. & Robinson, C. V. Massign: an assignment strategy for maximizing information from the mass spectra of heterogeneous protein assemblies. Anal. Chem. 84, 2939–2948 (2012).
34. Chifflet, S., Torriglia, A., Chiesa, R. & Tolosa, S. A method for the determination of inorganic phosphate in the presence of labile organic phosphate and high concentrations of protein: application to lens ATPases. Anal. Biochem. 168, 1–4 (1988).
35. Blanchet, C. E. et al. Versatile sample environments and automation for biological solution X-ray scattering experiments at the P12 beamline (PETRA III, DESY). J. Appl. Crystallogr. 48, 431–443 (2015).
36. Konarev, P. V., Volkov, V. V., Sokolova, A. V., Koch, M. H. J. & Svergun, D. I. PRIMUS: a Windows PC-based system for small-angle scattering data analysis. J. Appl. Crystallogr. 36, 1277–1282 (2003).
37. Svergun, D. I. Determination of the regularization parameter in indirect-transform methods using perceptual criteria. J. Appl. Crystallogr. 25, 495–503 (1992).
38. Heinz Maier-Leibnitz Zentrum et al. SANS-1: Small angle neutron scattering. J. Large Scale Res. Fac.https://doi.org/10.17815/jlsrf-1-32(2015).
39. Whitten, A. E., Cai, S. & Trewhella, J. MULCh: modules for the analysis of small-angle neutron contrast variation from biomolecular assemblies. J. Appl. Crystallogr. 41, 222–226 (2008).
40. Trewhella, J. et al. 2017 publication guidelines for structural modelling of small-angle scattering data from biomolecules in solution: an update. Acta Crystallogr. D 73, 710–728 (2017).
41. Kelley, L. A., Mezulis, S., Yates, C. M., Wass, M. N. & Sternberg, M. J. The Phyre2 web portal for protein modeling, prediction and analysis. Nat. Protoc. 10, 845–858 (2015).
42. Svergun, D. I. et al. Protein hydration in solution: experimental observation by x-ray and neutron scattering. Proc. Natl Acad. Sci. USA 95, 2267–2272 (1998). 43. PyMOL. ThePyMOL Molecular Graphics System, Version 2.0 Schrödinger,
LLC.
44. Vizcaino, J. A. et al. 2016 update of the PRIDE database and its related tools. Nucleic Acids Res. 44, D447–D456 (2016).
45. Jo, S., Kim, T., Iyer, V. G. & Im, W. CHARMM-GUI: a web-based graphical user interface for CHARMM. J. Comput. Chem. 29, 1859–1865 (2008).
Acknowledgements
We thank Franz Hagn (Munich) for advice on nanodisc preparation, Poul Nissen and Thomas Boesen (Aarhus) for plasmids, Simon Newstead (Oxford) for yeast cells and Katharina Veith for technical assistance. The synchrotron SAXS data were collected at beamline P12 operated by EMBL Hamburg at the PETRA III storage ring (DESY, Hamburg, Germany). The SANS data were collected at the SANS-1 instrument operated by HZG and FRM II at the Heinz Maier-Leibnitz Zentrum (MLZ), Garching, Germany. The authors gratefully acknowledge thefinancial support provided by HZG to perform the neutron scattering measurements at the Heinz Maier-Leibnitz Zentrum (MLZ), Garching, Germany. We are grateful to the staff at SANS-1 (MLZ, Munich) and P12 (EMBL, Hamburg). We acknowledge access to the Sample Preparation and Character-ization (SPC) Facility of EMBL, Hamburg. VTF acknowledges the UK Engineering and Physical Sciences Research Council (EPSRC) for grants GR/R99393/01 and EP/C015452/ 1 that originally funded the Deuteration Laboratory within ILL’s Life Sciences Group that produced deuterated material for this study. The authors thank Professor William Dowhan and his group at the University of Texas, USA for their kind contribution in providing the original PC-producing E. coli strain, which was further mutated for pro-duction of deuterated PC in Grenoble. This research was funded by an Emmy Noether grant (to H.T.) and the excellence cluster‘The Hamburg Center for Ultrafast Imaging
-Structure, Dynamics and Control of Matter at the Atomic Scale’ of the Deutsche For-schungsgemeinschaft (DFG EXC 1074). The Heinrich Pette Institute, Leibniz Institute for Experimental Virology is supported by the Free and Hanseatic City of Hamburg and the Federal Ministry of Health. J.H. and C.U. are funded by the Leibniz Association through SAW-2014-HPI-4 grant.
Author contributions
Conceptualization, J.N. and H.T.; Methodology, J.N., I.J., S.M. and H.T.; Investigation, J. N., I.J., J.H., S.M., H.D.M., M.M., M.H., V.T.F., S.B. and H.T.; Writing—Original Draft, J. N. and H.T.; Writing—Review & Editing, J.N., I.J., H.D.M., D.I.S., S.B., V.T.F., C.U. and H.T.; Resources, D.I.S., C.U. and H.T.; Funding Acquisition, V.T.F. and H.T.; Super-vision, H.T.
Additional information
Supplementary informationaccompanies this paper at https://doi.org/10.1038/s42003-018-0203-7.
Competing interests:The authors declare no competing interests.
Reprints and permissioninformation is available online athttp://npg.nature.com/ reprintsandpermissions/
Publisher’s note: Springer Nature remains neutral with regard to jurisdictional claims in published maps and institutional affiliations.
Open Access This article is licensed under a Creative Commons Attribution 4.0 International License, which permits use, sharing, adaptation, distribution and reproduction in any medium or format, as long as you give appropriate credit to the original author(s) and the source, provide a link to the Creative Commons license, and indicate if changes were made. The images or other third party material in this article are included in the article’s Creative Commons license, unless indicated otherwise in a credit line to the material. If material is not included in the article’s Creative Commons license and your intended use is not permitted by statutory regulation or exceeds the permitted use, you will need to obtain permission directly from the copyright holder. To view a copy of this license, visithttp://creativecommons.org/ licenses/by/4.0/.