1
DECONSTRUCTING LEED By Marco Maguina
November 2010
I. Abstract
This paper presents an analysis of the data supplied by the US Green Buildings Council on the credits achieved by 117 LEED-certified commercial and institutional buildings. The paper identifies which credits are usually selected by type of project, ownership, certification level or climate zone explores the correlation between several group of credits and quantifies the energy savings produced by the program.
The findings detailed in this research should be considered as preliminary, and the analyses should be repeated when longer data histories from a larger sample of LEED certified buildings are available.
Keywords: US Green Building Council, Leadership in Energy and Environmental Design, LEED New Constructions and Major Renovations v 2.2.
II. Introduction
With over 35,000 projects registered at the US Green Building Council, LEED has become remarkably successful around the world and while it remains a voluntary certification in most parts, some government agencies have prescribed LEED as a mandatory tool for public or private developments. LEED’s success can be attributed to several factors: it is easy to understand; it gives credits for a wide range of sustainable features; it defines a clear baseline to be used as reference with clearly established rules for success; and it provides a recognizable metric for making market comparisons.
While the first LEED certification was achieved on October 1st, 2000, the percentage of
certified projects remains relatively low today; only 6,791, representing 19.31% of all registered projects, have achieved a certification. Alone under the New Constructions system
16,337 projects, 11,974 (73.29%) of which have been registered after January 1st, 2009,
remain to be certified. This represents a tremendous opportunity for any company offering sustainable solutions and that aims to support a reduction of the urban areas environmental pressure.
This paper does not intent to judge the credit’s selection, it aims however to offer a better understanding on how the LEED program has been applied by identifying the credits typically selected by type of project, ownership, certification level or climate zone and by exploring the correlations among several group of credits.
III. Background
As of October 2010, 35,159 projects were registered at the US Green Building Council database, 31,586 (89.84%) of these, located inside the United States. As seen on Figure 1, out of all registered projects 4,343 (12.35%) are registered under the Commercial Interiors rating system, 3,548 (10.09%) under Core & Shell, 5,498 (15.94%) projects under Existing Buildings, 1,296 (3.69%) under LEED for schools, 19,878 (56.54%) under New Constructions and Major Renovations, 210 (0.60%) projects under Neighborhood Development and 385 projects have been registered under the LEED Retail rating system.
2
Figure 01: Projects by rating system (all certification levels)
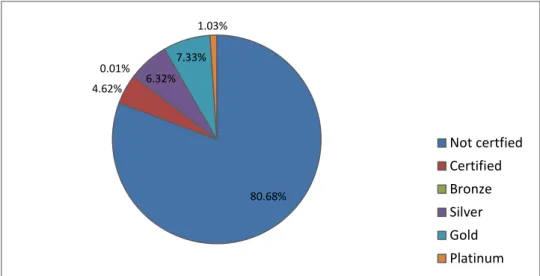
Year to date only 6,791, representing 19.31% of all registered projects, have achieved a certification. As seen on Figure 2, while 80.68% (28,367 projects) remain to certify, 4.62% (1,625) have achieved the basic certification level, 0.01% (4 projects) have a achieved a Bronze certification that briefly existed under the LEED NC version 1.0 rating system, 6.32% (2,221) of all registered projects are Silver certified, 7.33% (2,578) Gold and 1,03% (363) have achieved a Platinum certification.
Figure 02: Projects by certification level (all rating systems)
IV. Methods
While 19,878 projects have been registered under the LEED New Construction system, a total of 13,644 (68.63%) projects are registered under its version 2.2 (LEED NC 2.2).
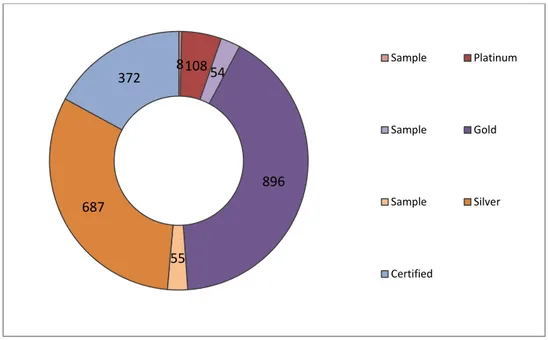
Under this version 115 projects have achieved a Platinum certification, 950 a Gold, 742 a Silver and 372 a basic certification. For purposes of consistency only projects certified under LEED NC 2.2 have been included in this study.
A total of 117 projects were selected to conduct this study. This sample represents 5.36% of all projects registered under LEED NC 2.2 and has a confidence interval of 8.74 at a confidence level of 95%. 12.35% 10.09% 15.64% 3.69% 56.54% 0.60% 1.10% Commercial Interiors Core & Shell
Existing Buildings Schools New Constructions Neighbourhood Development Retail 80.68% 4.62% 0.01% 6.32% 7.33% 1.03% Not certfied Certified Bronze Silver Gold Platinum
3
The projects were selected under the following criteria:
Projects have been certified under the LEED NC versions 2.2,
Projects have achieved a Platinum, Gold or Silver certification,
Project’s scorecard has been published,
Information about the project’s location, type, ownership, size, registration and
certification date has been published.
As seen on Figure 3 the sample includes 8 Platinum projects representing 6.95% of all Platinum certifications, 54 Gold (5.68%) and 55 Silver certification (7.41%). Projects that have achieved the “basic” LEED NC 2.2 certification have not been included in the sample.
Figure 03: Project in Sample by Certification level
Sorted by ownership (table 01), most projects that have achieved a certification (all levels) are owned by profit organizations followed by public projects (Federal, State and Local Governments) in case of silver certified projects and by nonprofit organizations in case of Platinum and Gold ones.
Table 01: Sample sorted by project ownership
Ownership All Platinum Gold Silver
Federal Government 4.27% 0.00% 3.70% 5.45% State Government 5.98% 0.00% 7.41% 5.45% Local Government 11.11% 0.00% 5.56% 18.18% Nonprofit organizations 20.51% 37.50% 20.37% 18.18% Profit organizations 50.43% 50.00% 57.41% 43.64% Individuals 5.13% 12.50% 1.85% 7.27% Others 2.56% 0.00% 3.70% 1.82%
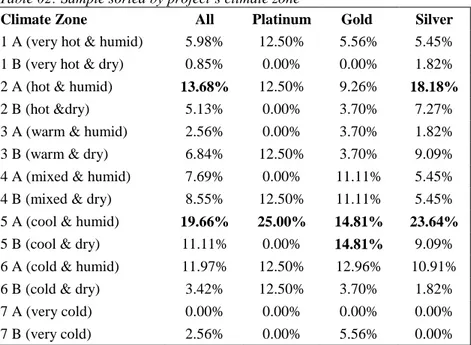
ASHRAE climate zones were determined using the projects zip-code. Organized by climate zones, as seen on Table 02, the highest concentration of projects are located in Climate Zones 5A (19.66%) and 2A (13.68), and while the highest number of Platinum projects within the sample are located in 5A (25%), Gold projects are located equally in climate zones 5A and
8 108 54 896 55 687 372 Sample Platinum Sample Gold Sample Silver Certified
4
5B (14.81%) and the Silver projects in climate zones 5A (23.64%) and 2A (18.18%).
Table 02: Sample sorted by project’s climate zone
Climate Zone All Platinum Gold Silver
1 A (very hot & humid) 5.98% 12.50% 5.56% 5.45% 1 B (very hot & dry) 0.85% 0.00% 0.00% 1.82%
2 A (hot & humid) 13.68% 12.50% 9.26% 18.18%
2 B (hot &dry) 5.13% 0.00% 3.70% 7.27%
3 A (warm & humid) 2.56% 0.00% 3.70% 1.82%
3 B (warm & dry) 6.84% 12.50% 3.70% 9.09%
4 A (mixed & humid) 7.69% 0.00% 11.11% 5.45%
4 B (mixed & dry) 8.55% 12.50% 11.11% 5.45%
5 A (cool & humid) 19.66% 25.00% 14.81% 23.64%
5 B (cool & dry) 11.11% 0.00% 14.81% 9.09%
6 A (cold & humid) 11.97% 12.50% 12.96% 10.91%
6 B (cold & dry) 3.42% 12.50% 3.70% 1.82%
7 A (very cold) 0.00% 0.00% 0.00% 0.00%
7 B (very cold) 2.56% 0.00% 5.56% 0.00%
As seen on Table 03, while the highest percentage on projects, including the Platinum and Gold certified, took between 2 and 2.5 years to reach the certification, the highest amount of Silver projects reached the certification within 1 to 1.5 years.
Table 03: Projects by time to achieve certification
Days to certify All Platinum Gold Silver
213 – 365 (1 year or less) 8.55% 0.00% 11.11% 7.27%
366 – 548 (1 – 1.5 years) 20.51% 0.00% 12.96% 30.91%
549 – 730 (1.5 – 2 years) 25.64% 37.50% 27.78% 21.82% 731 – 915 (2 – 2.5 years) 28.21% 50.00% 29.63% 23.64% 916 – 1095 (2.5 – 3 years) 16.24% 12.50% 16.67% 16.36%
Above 1096 (above 3 years) 0.85% 0.00% 1.85% 0.00%
Table 04 presents the sample by gross building area. As seen, regardless of the certification level, the highest percentages of projects have a gross building area between 10,001 and 50,000 square feet.
Table 04: Sample project’s gross building area (square foot)
Project area (sqf) All Platinum Gold Silver
below 10,000 15.38% 12.50% 12.96% 18.18%
10,001 – 50,000 39.32% 37.50% 37.04% 41.82%
50,001 – 120,000 25.64% 25.00% 25.93% 25.45%
above 120,001 19.66% 25.00% 24.07% 14.55%
Table 05 presents the sample by type of project. As seen, followed by Education, Commercial offices are the type of project most often certified (all certification levels).
5
Table 05: Sample by project type
Project type All Platinum Gold Silver
Assembly 1.71% 0.00% 1.85% 1.82%
Commercial offices 46.15% 62.50% 51.85% 38.18%
Finance & Communications 1.71% 0.00% 1.85% 1.82%
Health Care 1.71% 0.00% 1.85% 1.82% Education 9.40% 12.50% 5.56% 12.73% Industrial 3.42% 0.00% 3.70% 3.64% Residential 5.13% 12.50% 3.70% 5.45% Retail 6.84% 0.00% 3.70% 10.91% Public 3.42% 0.00% 3.70% 3.64% Others 20.51% 12.50% 22.22% 20.00% V. Theory
Leadership in Energy and Environmental Design (LEED) is an internationally recognized green building certification system, providing third-party verification that a building or community was designed and built using strategies aimed at improving performance across
all the metrics that matter most: energy savings, water efficiency, CO2 emissions reduction,
improved indoor environmental quality, and stewardship of resources and sensitivity to their impacts.
The development of LEED began in 1993, in 1998 the LEED 1.0 pilot program was released, during this period, extensive revisions were made and by March 2000, LEED 2.0 was launched to the marketplace. Over time the program evolved to more accurately represent and incorporate emerging green building technologies. LEED NC v2.2 was released in 2005 and replaced by LEED NC v3.0 in 2009.
LEED was created to accomplish the following:
Define "green building" by establishing a common standard of measurement,
Promote integrated, whole-building design practices,
Recognize environmental leadership in the building industry,
Stimulate green competition,
Raise consumer awareness of green building benefits,
Transform the building market.
Today, LEED consists of a suite of nine rating systems for the design, construction and operation of buildings, homes and neighborhoods. Five overarching categories correspond to the specialties available under the LEED Accredited Professional program.
LEED for New Construction and Major Renovations version 2.2 contains the same credits as the new NC v2009, but considers fewer points. There are 69 possible points and buildings can qualify for four levels of certification:
Certified: 26 to 32 points
Silver: 33 to 38 points
Gold: 39 to 51 points
6
LEED certification is obtained after submitting an application documenting compliance with the requirements of the rating system as well as paying registration and certification fees.
VI. Analysis
The following analysis explores the frequency of credits used in the different projects, the correlation between credits as well as quantifying the energy savings based on the New York building code and the ASHRAE 90.1-2004 standard.
VI.1 Sustainable Sites - Credit frequency
The Sustainable Site chapter is composed by one prerequisite and 14 credits that support the integration of building location and sustainable features in the projects objectives encouraging development and preservation or restoration practices that limit the environmental impact of building on local ecosystems.
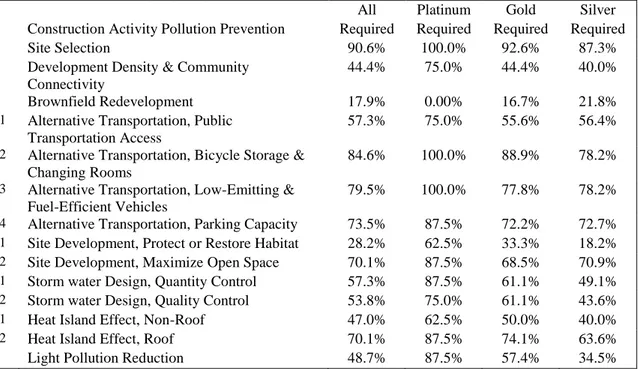
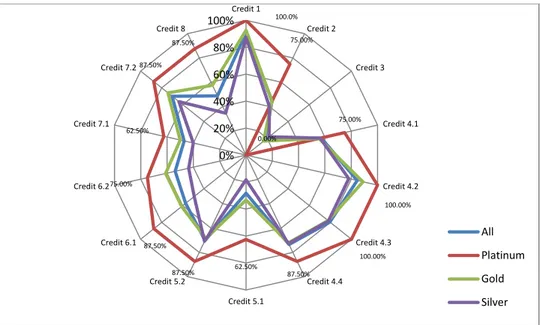
Table 06 shows the frequency of Sustainable Sites credits usage. The most frequent used credits are SS credit 1, Site Selection, 106 times representing 90.6% of the projects, SS Credit 4.2, Alternative Transportation, bicycle storage & changing rooms, 99 times or 84.6%, SS Credit 4.3, Alternative Transportation, low emitting vehicle & fuel efficient vehicles (93 times, 79.5%) and SS credit 4.4, Alternative Transportation, parking capacity (86; 73.5%). The least used credits include SS Credit 3, Brownfield redevelopment (21; 17.9%), SS credit 5.1, Site Development, Protect or Restore Habitat (28.2%), SS Credit 7.1, Heat Island Effect, Non-Roof (56; 47%) and SS Credit 8, Light Pollution Reduction (57; 48.7%).
Table 06: Sustainable Site credit frequency
All Platinum Gold Silver
Prereq 1 Construction Activity Pollution Prevention Required Required Required Required
Credit 1 Site Selection 90.6% 100.0% 92.6% 87.3%
Credit 2 Development Density & Community Connectivity
44.4% 75.0% 44.4% 40.0%
Credit 3 Brownfield Redevelopment 17.9% 0.00% 16.7% 21.8% Credit 4.1 Alternative Transportation, Public
Transportation Access
57.3% 75.0% 55.6% 56.4%
Credit 4.2 Alternative Transportation, Bicycle Storage & Changing Rooms
84.6% 100.0% 88.9% 78.2%
Credit 4.3 Alternative Transportation, Low-Emitting & Fuel-Efficient Vehicles
79.5% 100.0% 77.8% 78.2%
Credit 4.4 Alternative Transportation, Parking Capacity 73.5% 87.5% 72.2% 72.7% Credit 5.1 Site Development, Protect or Restore Habitat 28.2% 62.5% 33.3% 18.2% Credit 5.2 Site Development, Maximize Open Space 70.1% 87.5% 68.5% 70.9% Credit 6.1 Storm water Design, Quantity Control 57.3% 87.5% 61.1% 49.1% Credit 6.2 Storm water Design, Quality Control 53.8% 75.0% 61.1% 43.6% Credit 7.1 Heat Island Effect, Non-Roof 47.0% 62.5% 50.0% 40.0% Credit 7.2 Heat Island Effect, Roof 70.1% 87.5% 74.1% 63.6% Credit 8 Light Pollution Reduction 48.7% 87.5% 57.4% 34.5%
Figure 04 presents the percentage of sustainable site credit selection by certification level. While most credits follow a common trend, the higher the certification level the more frequent the credits are achieved, credit SS 3, Brownfield redevelopment, shows a lower usage at higher certification levels.
7
Similarly credits SS 4.1, Alternative Transportation, Public Transportation Access, SS 4.3, Alternative Transportation, Low-Emitting & Fuel-Efficient Vehicles, SS 5.2, Site Development, Maximize Open Space, shows a slightly higher usage at the Silver certification level than at Gold projects.
Figure 04: Sustainable Site credits by certification level
As seen on Figure 05, sorted by ownership, most credits do not present a significant variation between public and private projects. While credit SS 2, Development Density & Community Connectivity has been achieved by 35.5% of all public projects, 45.7% of all private projects achieved the same credit. The difference becomes more significant at credits SS 3, Brownfield Redevelopment, and SS 4.3, Alternative Transportation, Low-Emitting & Fuel-Efficient Vehicles, which have been achieved 29% and 51.6% by public projects and 13% and 87% by all private projects.
Figure 05: Sustainable Site credits by ownership
100.0% 75.00% 0.00% 75.00% 100.00% 100.00% 87.50% 62.50% 87.50% 87.50% 75.00% 62.50% 87.50% 87.50% 0% 20% 40% 60% 80% 100% Credit 1 Credit 2 Credit 3 Credit 4.1 Credit 4.2 Credit 4.3 Credit 4.4 Credit 5.1 Credit 5.2 Credit 6.1 Credit 6.2 Credit 7.1 Credit 7.2 Credit 8 All Platinum Gold Silver 87 .1% 3 5 .5 % 2 9 .0 % 6 1 .3 % 87 .1% 5 1 .6 % 7 4 .2 % 2 9 .0 % 7 1 .0 % 5 8 .1 % 6 1 .3 % 4 8 .4 % 7 1 .0 % 5 1 .6 % 9 1 .3 % 4 5 .7 % 13 .0% 5 5 .4 % 84 .8% 87.0 % 7 2 .8 % 2 8 .3 % 6 8 .5 % 56 .5% 5 3 .3 % 4 6 .7 % 7 1 .7 % 4 7 .8 % 0% 10% 20% 30% 40% 50% 60% 70% 80% 90% 100% Credit 1 Credit 2 Credit 3 Credit 4.1 Credit 4.2 Credit 4.3 Credit 4.4 Credit 5.1 Credit 5.2 Credit 6.1 Credit 6.2 Credit 7.1 Credit 7.2 Credit 8 All Public All Private
8
VI.2 Water Efficiency – Credit frequency
The water efficiency chapter supports strategies to reduce the usage of potable water, reuse waste and grey waters and lower sewage volumes. The chapter consists out of 5 credits, 2 of which aim to reduce the water used for landscaping, one supports waste water treatment strategies and 2 support the overall building potable water consumption.
All Water efficiency credits follow the criteria, the higher the certification, the higher the credit usage and while WE credit 1.1, water efficient landscaping, 50% reduction (89.7%), WE 3.1 and WE 3.2, 20% and 30% of water use reduction (97.4% & 92.3%) are the most targeted ones, WE credit 2, innovative wastewater technologies (19.7%) is the least used in all certification levels.
Table 06: Water efficiency credit frequency
All Platinum Gold Silver
Credit 1.1 Water Efficient Landscaping, Reduce by 50% 89.7% 100.0% 96.3% 81.8% Credit 1.2 Water Efficient Landscaping, No Potable Use or
No Irrigation
63.2% 87.5% 68.5% 56.4%
Credit 2 Innovative Wastewater Technologies 19.7% 62.5% 18.5% 12.7% Credit 3.1 Water Use Reduction, 20% Reduction 97.4% 100.0% 98.1% 96.4% Credit 3.2 Water Use Reduction, 30% Reduction 92.3% 100.0% 98.1% 85.5%
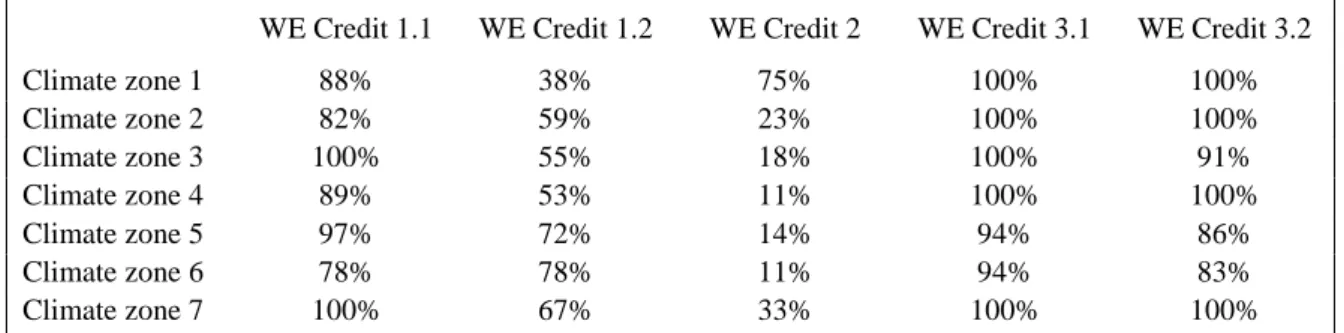
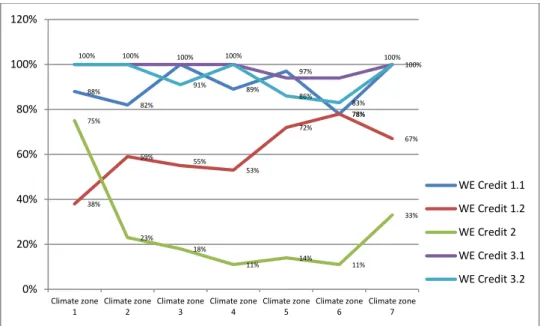
Sorted by ASHRAE climate zones (Table 07 and Figure 06) credit water efficiency 2, Innovative Wastewater Technologies is the least used by all zones expect for climate zone 1 (Hot dry and humid climate), where 3 out of 4 projects achieve this credit. Noteworthy is that credits 1.1, Water Efficient Landscaping, Reduce by 50%, 3.1 and 3.2, Water Use Reduction, 20% & 30% were frequently used in all climate zones.
Table 07: Water efficiency credit frequency by ASHRAE climate zones
WE Credit 1.1 WE Credit 1.2 WE Credit 2 WE Credit 3.1 WE Credit 3.2
Climate zone 1 88% 38% 75% 100% 100% Climate zone 2 82% 59% 23% 100% 100% Climate zone 3 100% 55% 18% 100% 91% Climate zone 4 89% 53% 11% 100% 100% Climate zone 5 97% 72% 14% 94% 86% Climate zone 6 78% 78% 11% 94% 83% Climate zone 7 100% 67% 33% 100% 100%
Figure 06, Water Efficiency credits by ASHRAE climate zones shows a higher use of credits WE 1.1, Water Efficient Landscaping, Reduce by 50%, WE 3.1 and WE 3.2, Water Use Reduction, 20% and 30%, at all climate zones, while credit WE 2, Innovative Wastewater Technologies, is the least used with the exception of projects within climate zone 1.
9
Figure 06: Water Efficiency credits by ASHRAE climate zones
VI. 3 Energy & Atmosphere – Credit frequency
LEED’s energy performance requirements are exemplified by two credits, the “Minimum Energy Performance” and the “Optimized Energy Performance” credit, both part of the Energy and Atmosphere section.
The “Minimum Energy Performance” credits prescribes all LEED projects, regardless of the certification level, to be designed in compliance of the mandatory provisions (Sections 5.4, 6.4, 7.4, 8.4, 9.4 and 10.4) of ASHRAE/IESNA Standard 90.1-20044 (without amendments); and the prescriptive requirements (Sections 5.5, 6.5, 7.5 and 9.5) or performance requirements (Section 11) of the same standard.
If the building design exceeds the mandatory provisions and prescriptive requirements of the ASHRAE/IESNA Standard 90.1-2004 it may achieve up to 10 additional points under the “Optimized Energy Performance” credit.
The analysis of the 117 public-and private-sector building projects shows that while 88.1% of the projects were able to achieve an average of 4.9 points under the Optimized Energy Performance credit, the remaining 11.9% were certified without exceeding the mandatory provisions and prescriptive requirements of the ASHRAE / IESNA Standard 90.1-2004. As seen on Figure 01, 86,32% of the projects in the sample achieved at least 2 additional points on the Optimized Energy Performance credit, 78,62% achieved 3 points, 68.37% 4 points, 51,28% achieved 5 additional points, 35,04% got 6 points, 26,49% 7 points, 22,22% 8 points, 14,52% 9 points and 8,54% received the full score of 10 points.
The Energy and Atmosphere section is composed of 3 prerequisites and 18 credits, which encourage higher building energy performance by promoting the reduction the amount of energy required and by using more benign forms of energy.
An average of 4.79 E&A Optimized Energy Performance credits are achieved by any LEED project; Platinum projects achieve an average of 8.88 E&A 1 credits, Gold projects 5.92 E&A 1 credits and Silver projects 3.09 E&A 1 credits.
88% 82% 100% 89% 97% 78% 100% 38% 59% 55% 53% 72% 78% 67% 75% 23% 18% 11% 14% 11% 33% 100% 100% 91% 100% 86% 83% 100% 0% 20% 40% 60% 80% 100% 120% Climate zone 1 Climate zone 2 Climate zone 3 Climate zone 4 Climate zone 5 Climate zone 6 Climate zone 7 WE Credit 1.1 WE Credit 1.2 WE Credit 2 WE Credit 3.1 WE Credit 3.2
10
The use of onsite renewable energy is significant low, an average of 0.38 E&A Onsite renewable credits (credits 2.1 to 2.3) are achieved by any LEED project; Platinum projects achieve 1.88 E&A 2 credits in average while Gold and Silver projects show a much lower usage of 0.4 and 0.145 credits in average.
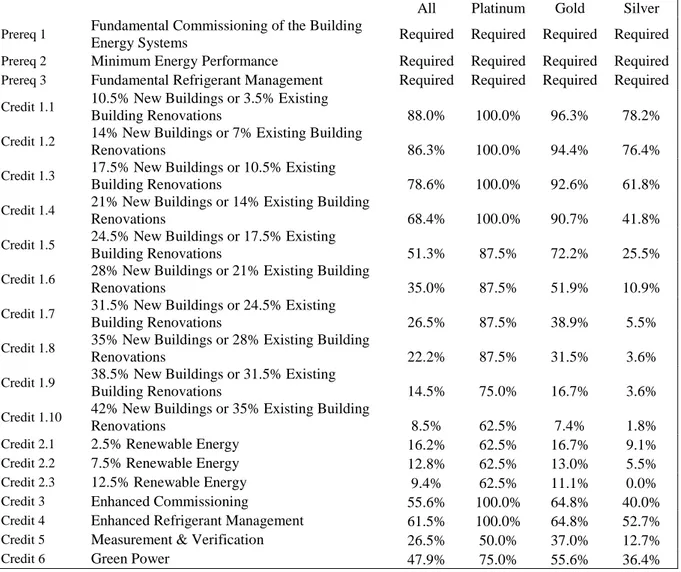
While 40% of the silver projects target Enhanced Commissioning, 64.8% of the Gold and 100% of Platinum projects target the same credit. A similar distribution is seen on the Enhanced Refrigerant Management credit, targeted by 100% of the Platinum credits, 64.8% of the Gold and 52.7% of the Silver credits (table 07).
Measurement and Verification (credit E&A 5) is one of the least used credits, with only 50% of all Platinum, 37% of all Gold and 12.7% of all Silver projects targeting it.
Green Power, credit E&A 6, has been targeted by 47.6% of all LEED projects, 75% of Platinum projects and 55.6% of the Gold projects have achieved this credit as well as 36.4% of the Silver ones.
Table 07: Energy & Atmosphere credit frequency
All Platinum Gold Silver
Prereq 1 Fundamental Commissioning of the Building
Energy Systems Required Required Required Required
Prereq 2 Minimum Energy Performance Required Required Required Required Prereq 3 Fundamental Refrigerant Management Required Required Required Required Credit 1.1 10.5% New Buildings or 3.5% Existing
Building Renovations 88.0% 100.0% 96.3% 78.2%
Credit 1.2 14% New Buildings or 7% Existing Building
Renovations 86.3% 100.0% 94.4% 76.4%
Credit 1.3 17.5% New Buildings or 10.5% Existing
Building Renovations 78.6% 100.0% 92.6% 61.8%
Credit 1.4 21% New Buildings or 14% Existing Building
Renovations 68.4% 100.0% 90.7% 41.8%
Credit 1.5 24.5% New Buildings or 17.5% Existing
Building Renovations 51.3% 87.5% 72.2% 25.5%
Credit 1.6 28% New Buildings or 21% Existing Building
Renovations 35.0% 87.5% 51.9% 10.9%
Credit 1.7 31.5% New Buildings or 24.5% Existing
Building Renovations 26.5% 87.5% 38.9% 5.5%
Credit 1.8 35% New Buildings or 28% Existing Building
Renovations 22.2% 87.5% 31.5% 3.6%
Credit 1.9 38.5% New Buildings or 31.5% Existing
Building Renovations 14.5% 75.0% 16.7% 3.6%
Credit 1.10 42% New Buildings or 35% Existing Building
Renovations 8.5% 62.5% 7.4% 1.8%
Credit 2.1 2.5% Renewable Energy 16.2% 62.5% 16.7% 9.1%
Credit 2.2 7.5% Renewable Energy 12.8% 62.5% 13.0% 5.5%
Credit 2.3 12.5% Renewable Energy 9.4% 62.5% 11.1% 0.0%
Credit 3 Enhanced Commissioning 55.6% 100.0% 64.8% 40.0% Credit 4 Enhanced Refrigerant Management 61.5% 100.0% 64.8% 52.7% Credit 5 Measurement & Verification 26.5% 50.0% 37.0% 12.7%
Credit 6 Green Power 47.9% 75.0% 55.6% 36.4%
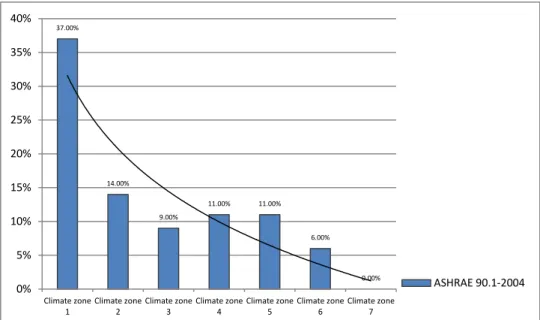
The data seems to indicate the existence of a trend; the warmer the climate zones the project is located in the higher the frequency the project is certified without exceeding the requirements of ASHRAE 90.1-2004. Figure 07 shows the percentage of projects, by climate
11
zone, that achieved a certification without achieving any E&A Optimized Energy Performance credit.
Figure 07: Percentage of projects, by climate zone, that did not exceeded ASHRAE 90.1-2004 requirements
In additional, while the highest energy performance was achieved on projects within climate zones 6 (22% achieved credit E&A 1.10) and 3 (18% achieved credit E&A 1.10), projects within extreme climate zones (climate zones 1 and 7) did not exceeded credit E&A 1.8 (Table 08 and Figure 08).
Table 08: Energy & Atmosphere credit frequency by climate zone E&A Credit 1.1 E&A Credit 1.2 E&A Credit 1.3 E&A Credit 1.4 E&A Credit 1.5 E&A Credit 1.6 E&A Credit 1.7 E&A Credit 1.8 E&A Credit 1.9 E&A Credit 1.10 Climate zone 1 63% 63% 50% 50% 38% 25% 25% 25% 0% 0% Climate zone 2 86% 86% 73% 55% 27% 5% 5% 5% 5% 5% Climate zone 3 91% 82% 82% 82% 73% 45% 27% 27% 27% 18% Climate zone 4 89% 89% 79% 79% 53% 37% 26% 21% 16% 11% Climate zone 5 89% 89% 83% 64% 50% 33% 22% 17% 11% 3% Climate zone 6 94% 89% 83% 78% 67% 67% 61% 56% 33% 22% Climate zone 7 100% 100% 100% 100% 100% 67% 33% 0% 0% 0% 37.00% 14.00% 9.00% 11.00% 11.00% 6.00% 0.00% 0% 5% 10% 15% 20% 25% 30% 35% 40% Climate zone 1 Climate zone 2 Climate zone 3 Climate zone 4 Climate zone 5 Climate zone 6 Climate zone 7 ASHRAE 90.1-2004
12
Figure 08: Percentage of E&A credit 1 to 1.10 achieved by climate zone
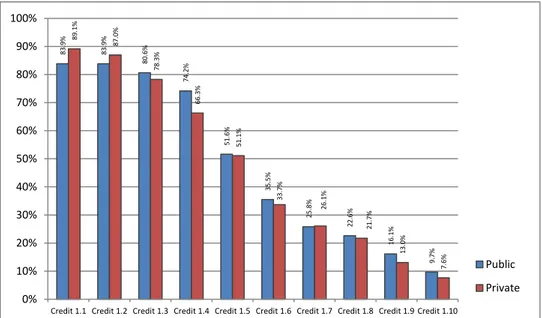
As seen on the charts below, while the buildings overall energy performance is not related the project ownership (Figure 09), there appears to be a tendency to reach higher energy performance at smaller projects (Figure 10).
Figure 09: Percentage of E&A credit 1 to 1.10 achieved by ownership
63% 63% 50% 50% 38% 25% 25% 25% 0% 0% 100% 100% 100% 100% 100% 67% 33% 0% 0% 0% 0% 20% 40% 60% 80% 100% 120% E&A Credit 1.1 E&A Credit 1.2 E&A Credit 1.3 E&A Credit 1.4 E&A Credit 1.5 E&A Credit 1.6 E&A Credit 1.7 E&A Credit 1.8 E&A Credit 1.9 E&A Credit 1.10 Climate zone 1 Climate zone 2 Climate zone 3 Climate zone 4 Climate zone 5 Climate zone 6 Climate zone 7 8 3 .9 % 8 3 .9 % 8 0 .6 % 7 4 .2 % 5 1 .6 % 3 5 .5 % 2 5 .8 % 2 2 .6 % 1 6 .1 % 9 .7 % 89 .1% 8 7 .0 % 7 8 .3 % 6 6 .3 % 5 1 .1 % 3 3 .7 % 26 .1% 2 1 .7 % 1 3 .0 % 7 .6 % 0% 10% 20% 30% 40% 50% 60% 70% 80% 90% 100%
Credit 1.1 Credit 1.2 Credit 1.3 Credit 1.4 Credit 1.5 Credit 1.6 Credit 1.7 Credit 1.8 Credit 1.9 Credit 1.10
Public Private
13
Figure 10: Percentage of E&A credit 1 to 1.10 achieved by project’s gross building area
VI. 4 Materials & Resources – Credit frequency
The Materials and Resources chapter supports the overall projects carbon footprint by promoting the use of environmentally responsible materials including regional, recycled or salvage materials and by encouraging designers to maintain and reuse existing building elements. The chapter includes one mandatory prerequisite and 13 credits.
Materials & Resources credits (Table 09, Figure 10) show a high frequency on the achievement of credits 5.1, Regional Materials, 10% Extracted, Processed & Manufactured Regionally (92.3%), credit 4.1, Recycled Content, 10% (post-consumer + ½ pre-consumer) (89.7%) and credit 2.1, Construction Waste Management, Divert 50% from Disposal (88.9%). The least used credits include credit 1.3, Building Reuse; Maintain 50% of Interior Non-Structural Elements (0.9%), credit 3.2, Material Reuse, 10% (6.0%) and credits 1.2 and 3.1, Building Reuse, Maintain 100% of Existing Walls, Floors & Roof and Material Reuse 5%, both achieved 7.7% of the times.
Sorted by certification level, Platinum projects have not targeted credits 1.2, Building Reuse, Maintain 100% of Existing Walls, Floors & Roof, 1.3, Building Reuse, Maintain 50% of Interior Non-Structural Elements and 3.2, Materials Reuse,10%: although 100% of these projects achieved credits 2.1 and 2.2, Construction Waste Management, Divert 50% and 100% from Disposal, as well as credits 4.1, Recycled Content, 10% (post-consumer + ½ pre-consumer), 5.1, Regional Materials, 10% Extracted, Processed & Manufactured Regionally and 5.2, Regional Materials, 20% Extracted, Processed & Manufactured Regionally.
Table 09: Materials and Resources credit frequency
All Platinum Gold Silver
Prereq 1 Storage & Collection of Recyclables Required Required Required Required
Credit 1.1 Building Reuse, Maintain 75% of Existing Walls,
Floors & Roof 16.2% 12.5% 13.0% 20.0%
Credit 1.2 Building Reuse, Maintain 100% of Existing
Walls, Floors & Roof 7.7% 0.0% 9.3% 7.3%
Credit 1.3 Building Reuse, Maintain 50% of Interior
Non-Structural Elements 0.9% 0.0% 1.9% 0.0% 100.0% 100.0% 83.3% 83.3% 50.0% 38.9% 38.9% 38.9% 38.9% 27.8% 0% 20% 40% 60% 80% 100% 120% Credit 1.1 Credit 1.2 Credit 1.3 Credit 1.4 Credit 1.5 Credit 1.6 Credit 1.7 Credit 1.8 Credit 1.9 Credit 1.10 < 10,000 10,001 - 50,000 50,001 - 120,000 > 120,000
14
Credit 2.1 Construction Waste Management, Divert 50%
from Disposal 88.9% 100.0% 87.0% 89.1%
Credit 2.2 Construction Waste Management, Divert 75%
from Disposal 71.8% 100.0% 75.9% 63.6%
Credit 3.1 Materials Reuse, 5% 7.7% 12.5% 7.4% 7.3%
Credit 3.2 Materials Reuse,10% 6.0% 0.0% 5.6% 7.3%
Credit 4.1 Recycled Content, 10% (post-consumer + ½
pre-consumer) 89.7% 100.0% 94.4% 83.6%
Credit 4.2 Recycled Content, 20% (post-consumer + ½
pre-consumer) 59.0% 25.0% 64.8% 58.2%
Credit 5.1 Regional Materials, 10% Extracted, Processed &
Manufactured Regionally 92.3% 100.0% 92.6% 90.9%
Credit 5.2 Regional Materials, 20% Extracted, Processed &
Manufactured Regionally 77.8% 100.0% 75.9% 76.4%
Credit 6 Rapidly Renewable Materials 12.0% 37.5% 3.7% 16.4%
Credit 7 Certified Wood 44.4% 75.0% 44.4% 40.0%
As seen on Table 10 and Figure 11, the usage of the following credits show a significant variation depending on the projects gross building area: credit 1.1, Building Reuse, Maintain 75% of Existing Walls, Floors & Roof, credit 1.2, Building Reuse, Maintain 100% of Existing Walls, Floors & Roof and credits 3.1 and 3.2, Material Reuse 5% and 10%.
Table 10: Materials and Resources credit frequency by projects gross building area (sqf) < 10,000 10,000 -
50,000
50,001 -
1200,000 > 120,000 Prereq 1 Storage & Collection of Recyclables Required Required Required Required Credit 1.1 Building Reuse, Maintain 75% of Existing Walls,
Floors & Roof 5.6% 21.7% 21.6% 8.7%
Credit 1.2 Building Reuse, Maintain 100% of Existing Walls,
Floors & Roof 0.0% 10.9% 10.8% 4.3%
Credit 1.3 Building Reuse, Maintain 50% of Interior
Non-Structural Elements 0.0% 0.0% 2.7% 4.3%
Credit 2.1 Construction Waste Management, Divert 50% from
Disposal 88.9% 87.0% 91.9% 91.3%
Credit 2.2 Construction Waste Management, Divert 75% from
Disposal 77.8% 69.6% 67.6% 73.9%
Credit 3.1 Materials Reuse, 5% 22.2% 8.7% 2.7% 0.0%
Credit 3.2 Materials Reuse,10% 16.7% 6.5% 2.7% 0.0%
Credit 4.1 Recycled Content, 10% (post-consumer + ½
pre-consumer) 72.2% 91.3% 94.6% 91.3%
Credit 4.2 Recycled Content, 20% (post-consumer + ½
pre-consumer) 55.6% 50.0% 73.0% 56.5%
Credit 5.1 Regional Materials, 10% Extracted, Processed &
Manufactured Regionally 94.4% 93.5% 89.2% 87.0%
Credit 5.2 Regional Materials, 20% Extracted, Processed &
Manufactured Regionally 88.9% 76.1% 70.3% 78.3%
Credit 6 Rapidly Renewable Materials 22.2% 8.7% 16.2% 0.0%
15
Figure 11: Materials & Resources credit frequency by project gross building area
VI.5 Indoor Environmental Quality – Credit frequency
The IEQ chapter aims to enhance the building’s occupant’s wellbeing by promoting manufacturing and construction practices that prevent IEQ problems from arising. Using higher ratios of filtered air, increasing ventilation rates, managing moistures and controlling the level of contaminants are some of the issues addressed by the chapter’s 13 credits and 2 prerequisite.
The sample shows that the most frequent credits achieved include credits 4.2, Low-Emitting Materials, Paints & Coatings (95.7%), 4.3, Low-Emitting Materials, Carpet Systems (94.9%), 4.1, Low-Emitting Materials, Adhesives & Sealants (94%) and 3.1, Construction IAQ Management Plan, During Construction (92.3%), while the least used credits are 6.2, Controllability of Systems, Thermal Comfort (41%), 8.1, Daylight & Views, Daylight 75% of Spaces (41.9%), credit 2, Increased Ventilation (43.6%) and credit 5, Indoor Chemical & Pollutant Source Control (47%).
Broken down by certification levels (Table 10 and Figure 11), there is a significant difference among the least targeted credits and the level of certification. While 100% of all Platinum projects achieve credit 6.2, Controllability of Systems, Thermal Comfort only 29.6% of all Gold and 43.6% of all Silver projects have achieved this credit. Credit 8.1, Daylight & Views, Daylight 75% of Spaces, is achieved by 75% of all Platinum projects, but only 33.3% and 45.5% of all Gold and silver projects respectively. There is also a significant difference on credit 2, increased ventilation, achieved by 87.5% of the platinum projects, but only by 50% and 30.9% of the gold and silver projects respectively.
Table 10: Indoor Environmental Quality credit frequency
All Platinum Gold Silver
Prereq 1 Minimum IAQ Performance Required Required Required Required
Prereq 2 Environmental Tobacco Smoke (ETS) Control Required Required Required Required
Credit 1 Outdoor Air Delivery Monitoring 56.4% 87.5% 61.1% 47.3%
Credit 2 Increased Ventilation 43.6% 87.5% 50.0% 30.9%
Credit 3.1 Construction IAQ Management Plan, During
Construction 92.3% 100.0% 94.4% 89.1% 21.6% 10.8% 2.7% 91.9% 67.6% 2.7% 2.7% 94.6% 73.0% 89.2% 70.3% 16.2% 51.4% 0% 10% 20% 30% 40% 50% 60% 70% 80% 90% 100% Credit 1.1 Credit 1.2 Credit 1.3 Credit 2.1 Credit 2.2 Credit 3.1 Credit 3.2 Credit 4.1 Credit 4.2 Credit 5.1 Credit 5.2 Credit 6 Credit 7 < 10,000 10,001 - 50,000 50,001 -120,000
16
Credit 3.2 Construction IAQ Management Plan, Before
Occupancy 54.7% 75.0% 63.0% 43.6%
Credit 4.1 Low-Emitting Materials, Adhesives & Sealants 94.0% 100.0% 94.4% 92.7% Credit 4.2 Low-Emitting Materials, Paints & Coatings 95.7% 100.0% 90.7% 100.0% Credit 4.3 Low-Emitting Materials, Carpet Systems 94.9% 100.0% 98.1% 90.9%
Credit 4.4 Low-Emitting Materials, Composite Wood &
Agrifiber Products 59.0% 87.5% 63.0% 50.9%
Credit 5 Indoor Chemical & Pollutant Source Control 47.0% 62.5% 63.0% 29.1% Credit 6.1 Controllability of Systems, Lighting 78.6% 100.0% 81.5% 72.7% Credit 6.2 Controllability of Systems, Thermal Comfort 41.0% 100.0% 29.6% 43.6%
Credit 7.1 Thermal Comfort, Design 76.1% 62.5% 79.6% 74.5%
Credit 7.2 Thermal Comfort, Verification 73.5% 75.0% 74.1% 72.7%
Credit 8.1 Daylight & Views, Daylight 75% of Spaces 41.9% 75.0% 33.3% 45.5% Credit 8.2 Daylight & Views, Views for 90% of Spaces 54.7% 87.5% 51.9% 52.7%
As seen on table 11 and figure 12, broken down by climate zone shows that projects in climate zone 1 (very hot) and 7 (very cold) target IEQ credit 1, Outdoor Air Delivery Monitoring, fewer times than projects in any other climate zone. One the other hand credit IEQ 2, increased ventilation is most often achieved by projects on climate zone 1 than in any other climate zone. Surprising is that IEQ credit 6.2, Controllability of Systems, Thermal Comfort is use more often in moderate climate zones (climate zone 3) than under extreme ambient conditions like climate zones 1, 2 or 7.
Table 11: Indoor Environmental Quality credit frequency by ASHRAE climate zones IEQ Credit 1 IEQ Credit 2 IEQ Credit 3.1 IEQ Credit 3.2 IEQ Credit 4.1 IEQ Credit 4.2 IEQ Credit 4.3 IEQ Credit 4.4 IEQ Credit 5 IEQ Credit 6.1 IEQ Credit 6.2 IEQ Credit 7.1 Climate zone 1 25% 88% 100% 75% 63% 100% 88% 50% 50% 25% 25% 75% Climate zone 2 55% 36% 91% 45% 91% 100% 95% 50% 32% 77% 32% 86% Climate zone 3 64% 64% 91% 64% 100% 100% 91% 64% 36% 82% 64% 73% Climate zone 4 79% 47% 95% 53% 89% 89% 100% 47% 58% 79% 16% 79% Climate zone 5 50% 33% 92% 53% 100% 92% 94% 69% 47% 81% 50% 69% Climate zone 6 67% 39% 89% 61% 100% 100% 94% 56% 56% 94% 56% 72% Climate zone 7 0% 33% 100% 33% 100% 100% 100% 100% 67% 100% 33% 100%
VI.6 HVAC Credits
This section analyses HVAC related credits and their use by ownership, climate zone, gross building area and building type. For purposes of simplicity the buildings HVAC system design are exemplified by 6 credits: E&A credit 4, Enhanced Refrigerant Management, IEQ credit 1, Outdoor Air Delivery Monitoring, IEQ credit 2, Increased Ventilation, IEQ Credit 3.1, Construction IAQ Management Plan, During Construction, Credit 6.2 Controllability of Systems, Thermal Comfort and IEQ Credit 7.1, Thermal Comfort, Design. Table 12 shows the frequency in which these credits have been used by ownership (public or private project), climate zone, gross building area and type of building.
Table 12: HVAC related credits frequency
E&A Credit 4 IEQ Credit 1 IEQ Credit 2 IEQ Credit 3.1 IEQ Credit 6.2 IEQ Credit 7.1
Public 64.5% 61.3% 25.8% 90.3% 45.2% 80.6%
Private 59.8% 57.6% 50.0% 92.4% 40.2% 75.0%
Climate zone 1 88% 25% 88% 100% 25% 75%
Climate zone 2 36% 55% 36% 91% 32% 86%
17 Climate zone 4 58% 79% 47% 95% 16% 79% Climate zone 5 64% 50% 33% 92% 50% 69% Climate zone 6 67% 67% 39% 89% 56% 72% Climate zone 7 67% 0% 33% 100% 33% 100% below 10,000 44.4% 50.0% 44.4% 94.4% 33.3% 66.7% 10,000 to 50,000 56.5% 54.3% 50.0% 89.1% 47.8% 78.3% 50,000 to 120,000 62.2% 70.3% 35.1% 94.6% 37.8% 75.7% above 120,000 87.0% 52.2% 39.1% 95.7% 30.4% 78.3% Assembly 50.0% 50.0% 0.0% 100.0% 50.0% 100.0% Commercial Offices 66.7% 64.8% 50.0% 96.3% 33.3% 81.5%
Finance & Comm 100.0% 100.0% 100.0% 0.0% 100.0% 100.0%
Health Care 100.0% 100.0% 100.0% 100.0% 50.0% 100.0%
Education 72.7% 36.4% 18.2% 90.9% 81.8% 54.5%
Industrial 100.0% 50.0% 75.0% 100.0% 0.0% 50.0%
Residential 83.3% 66.7% 66.7% 83.3% 100.0% 83.3%
Retail 25.0% 62.5% 50.0% 100.0% 12.5% 75.0%
VI.6.1 E&A Credit 4: Enhanced Refrigerant Management
Credit E&A 4, Enhanced Refrigerant Management can be achieved by either designing and operating the facility without mechanical cooling and refrigeration equipment or by selecting HVAC equipment with reduced refrigerant charge and increased equipment life in addition of implementing a service and maintenance program to prevent leakage of refrigerant to the atmosphere. As seen on Figure 12 this credit is more often used in public buildings (64.5%), located in climate zone 1 (88%), with an gross building are of above 120,000 sqf (87%) and intended for Finance and Communication (100%), Health Care (100%) or Industrial (100%) use.
Figure 12: E&A Credit 4, Enhanced Refrigerant Management, frequency
VI.6.2 IEQ Credit 1: Outdoor Air Delivery Monitoring
This credit requires providing capacity for ventilation system monitoring to help sustain occupant comfort and wellbeing by installing permanent monitoring systems that provide feedback on ventilation system performance to ensure that ventilation systems maintain design minimum ventilation requirements.
0.0% 20.0% 40.0% 60.0% 80.0% 100.0%Public Private Climate zone 1 Climate zone 2 Climate zone 3 Climate zone 4 Climate zone 5 Climate zone 6 Climate zone 7 below 10,000 10,000 to 50,000 50,000 to 120,000 above 120,000 Assembly Commercial Offices Finnance & Comm
Health Care Education Industrial Residential Retail Enhanced Refrigerant Management
18
As seen on Figure 13, this credit is most used by public buildings (61.3%), located in climate zone 4 (79%), with a gross building area between 50,000 and 120,000 sqf (70.3%) and intended for Finance and Communication(100%) or Health Care (100%) use.
Figure 13: IEQ Credit1, Outdoor Air Delivery Monitoring, frequency
VI.6.3 IEQ Credit 2: Increased Ventilation
To achieve this credit the ventilation system design has to exceed the minimum outdoor air ventilation rates as described by ASHRAE 62 standard by 30%. Design teams have to balance the impacts of ventilation rates on energy use and indoor air quality to optimize for energy efficiency and occupant health.
As seen on Figure 14, the IEQ credit 2 has most often been achieved by private buildings (50%), in climate zone 1 (88%), with a gross building area between 10,000 and 50,000 sqf (50%) and intended for Finance and Communication (100%) and Health Care (100%) use.
Figure 14: IEQ Credit 2, Increased Ventilation, frequency 0.0% 20.0% 40.0% 60.0% 80.0% 100.0% Public Private Climate zone 1 Climate zone 2 Climate zone 3 Climate zone 4 Climate zone 5 Climate zone 6 Climate zone 7 below 10,000 10,000 to 50,000 50,000 to 120,000 above 120,000 Assembly Commercial Offices Finnance & Comm
Health Care Education
Industrial Residential
Retail
Credit 1 Outdoor Air Delivery Monitoring 0.0% 20.0% 40.0% 60.0% 80.0% 100.0%Public Private Climate zone 1 Climate zone 2 Climate zone 3 Climate zone 4 Climate zone 5 Climate zone 6 Climate zone 7 below 10,000 10,000 to 50,000 50,000 to 120,000 above 120,000 Assembly Commercial Offices Finnance & Comm
Health Care Education
Industrial Residential
Retail
19
VI.6.4 IEQ Credit 3.1: Construction IAQ Management Plan, During Construction
IEQ Credit 3.1, Construction IAQ Management Plan, During Construction, intents to reduce indoor air quality problems resulting from the construction/renovation process in order to help sustain the comfort and well-being of construction workers and building occupants. In order to achieve this credits the project has to adopt an IAQ management plan to protect the HVAC system during construction, control pollutant sources and interrupt contamination pathways.
As seen of Figure 15, this credit is widely used by all types of projects within all climate zones, with the exception of Finance and Communication (0%) projects.
Figure 15: IEQ Credit 3.1, Construction IAQ Management Plan, During Construction, frequency
VI.6.5 IEQ Credit 6.2: Controllability of Systems, Thermal Comfort
This credit intents to provide a high level of thermal comfort system control to individual occupants or specific groups in multi-occupant spaces (i.e. classrooms or conference areas) to promote the productivity, comfort and well-being of building occupants.
To achieve this credit building and systems have to be designed with comfort controls to allow adjustments to suit individual needs or those of groups in shared spaces according to the recommendations of ASHRAE Standard 55-2004.
As seen on Figure 16, this credit has been most often used by public projects (45.2%), those located in climate zone 3 (64%), with a gross building area between 10,000 and 50,000 sqf (47.8%) and intended for Finance and Communication (100%) and Residential (100%) use.
0.0% 20.0% 40.0% 60.0% 80.0% 100.0% Public Private Climate zone 1 Climate zone 2 Climate zone 3 Climate zone 4 Climate zone 5 Climate zone 6 Climate zone 7 below 10,000 10,000 to 50,000 50,000 to 120,000 above 120,000 Assembly Commercial Offices Finnance & Comm Health Care Education Industrial Residential Retail
Credit 3.1 Construction IAQ Management Plan, During Construction
20
Figure 16: IEQ Credit 6.2, Controllability of Systems, Thermal Comfort, frequency
VI.6.6 IEQ Credit 7.1: Thermal Comfort, Design
The Thermal Comfort, Design credit requires the design of the HVAC systems and the building envelope to meet the requirements of ASHRAE Standard 55-2004, Thermal Comfort Conditions for Human Occupancy. While widely used, as seen on Figure 17, IEQ Credit 7.1 has been most often used by public projects (80.6%), in climate zone 7 (100%), on buildings with a gross building area between 10,000 and 50,000 sqf (78.3) and intended for Assembly (100%), Finance & Communication (100%) or Health Care (100%) use.
Figure 16: IEQ Credit 6.2, Controllability of Systems, Thermal Comfort, frequency
VI.6.7 HVAC credits - Correlations
While most of the credits denote a weak statistical correlation among each other, few cases present a moderate or even strong one (table 12). Explained in layman’s terms this means that if one of these credits is selected, more often than not, the other one is selected as well. Understanding the correlation between the credits has proven to be useful as they can indicate
0.0% 20.0% 40.0% 60.0% 80.0% 100.0% Public Private Climate zone 1 Climate zone 2 Climate zone 3 Climate zone 4 Climate zone 5 Climate zone 6 Climate zone 7 below 10,000 10,000 to 50,000 50,000 to 120,000 above 120,000 Assembly Commercial Offices Finnance & Comm
Health Care Education Industrial Residential Retail Credit 6.2 Controllability of Systems, Thermal Comfort
0.0% 20.0% 40.0% 60.0% 80.0% 100.0% Public Private Climate zone 1 Climate zone 2 Climate zone 3 Climate zone 4 Climate zone 5 Climate zone 6 Climate zone 7 below 10,000 10,000 to 50,000 50,000 to 120,000 above 120,000 Assembly Commercial Offices Finnance & Comm
Health Care Education
Industrial Residential
Retail
Credit 7.1 Thermal Comfort, Design
21
a predictive relationship that can be exploited in practice.
Table 12
Credit ID Credit title Correlation
IEQ Credit 1 Outdoor Air Delivery Monitoring
Moderate IEQ Credit 2 Increased Ventilation
IEQ Credit 7.1 Thermal Comfort, Design
Strong IEQ Credit 7.2 Thermal Comfort, Verification
VI.7 Energy performance: quantifying the energy savings
The ASHRAE/IESNA Standard 90.1-2004 draft was released in 2004 as the standard that would replace the 90.1-2001 version in 2007. The ASHRAE 90.1 standards are proposed as the commercial building energy performance reference that local, state or federal authorities may fully or partially mandate.
An analysis (Gowri, Halverson, Richman; 2007) showed that, compared to the city of New York building code, buildings constructed to Standard 90.1-2004 save a significant amount of energy for all building types and in all climate zones. Savings range from 2.6% to 9.7% in site energy, 5.8% to 11% in source energy, and 6.0% to 13% in energy cost.
Considering study sample as a representative for the LEED program and using a standard New York City building as a reference, the average site energy saving produced by LEED would vary between 24.95% and 30.43%, as seen on Figure 13. While Platinum projects generate between 39.67% - 44.07% in site energy savings, Gold certified buildings save between 29.37% to 34.52% and the analyzed Silver projects have generated savings in the range of 18.47% to 24.41%.
Figure 13: In site energy savings by certification level
Compared to ASHRAE 90.1-2004 the LEED program produces average energy savings of 22.88%; platinum projects generate energy average savings 37.94%, Gold projects 27.39% and silver projects 16.24% as seen of Figure 14.
24.95% 39.67% 29.37% 18.47% 30.43% 44.07% 34.52% 24.41% 0% 5% 10% 15% 20% 25% 30% 35% 40% 45% 50%
22
Figure 14: In site energy savings by certification level
VII. Conclusions
As of October 2010, 35,159 projects were registered at the US Green Building Council
database, 31,586 (89.84%) of these, located inside the United States.
The percentage of LEED certified projects remains relatively low; only 6,791 (19.31%)
have achieved a certification.
Most projects need between 2 and 2.5 years to certify.
Alone under the New Constructions system 16,337 projects, 11,974 (73.29%) of which
have been registered after January 1st, 2009, remain to be certified.
The most frequently used credits by chapter are:
Sustainable Sites: Credit 1 - Site Selection (90.6%)
Water Efficiency: Credit 3.1 - Water Use 20% reduction (97.4%),
Energy & Atmosphere: Credit 1.1 - 10.5%New Buildings or 3.5% Existing Building Renovations (88%)
Materials & Resources: Credit 5.1 – 10% of Regional Materials (92.3%)
Indoor Environmental Quality: Credit 4.1 – Low emitting materials, paints & coatings (95.7%)
The least used credits by chapter are:
Sustainable Sites: Credit 3 – Brownfield Redevelopment (17.9%)
Water Efficiency: Credit 2 – Innovative wastewater technologies (19.7%),
Energy & Atmosphere: Credit 1.10 - 42%New Buildings or 35% Existing Building Renovations (8.5%)
Materials & Resources: Credit 1.3 – Building Reuse, Maintain 50% of interior nonstructural elements (0.9%)
Indoor Environmental Quality: Credit 8.1 – Daylight &Views, daylight 75% of spaces (41.9%) 22.88% 37.94% 27.39% 16.24% 0% 5% 10% 15% 20% 25% 30% 35% 40% 45% 50%
23
While most of the credits denote a weak statistical correlation among each other, few
cases present a moderate and even strong one.
The energy savings identified within the scope of this study are significant, supporting the
decision of some governmental agencies to mandate LEED as a design tool for public and private buildings.
VIII. References
Bennett, A.K, Brown, M, Carlisle, N, Glickman, J, Foster, M & Sandler, K, 2004,
Transforming the Market for Sustainable Design: Effective Public Policies and Strategies,
Environmental Protection Agency, presented at the 2004 ACEEE Summer Study on Energy Efficiency in Buildings Pacific Grove, California August 22-27, 2004.
Berbel, J, Berglund, M, Dworak, T, Grandmougin, J, Kolberg, S, Kossida, M, Kyriazopoulou, I, Laaser, C, Montesinos, P, Rodríguez-Díaz, J.A, Strosser, P, Roussard, J, 2007, EU Water saving potential (Part 1 –Report), ENV.D.2/ETU/2007/0001R, Ecologic - Institute for International and European Environmental Policy.
Dietsche, T. 2003. U.S. Green Building Council Credit Tracking Spreadsheet. Washington, D.C.: USGBC.
Gowri, K, Halverson, M.A, Richman, E, 2007, Analysis of Energy Saving Impacts of
ASHRAE 90.1-2004 for the State of New York, Prepared for the U.S. Department of Energy
under Contract DE-AC05-76RL01830, Pacific Northwest National Laboratory Richland, Washington 99352.
Lauranson, R, Mudgal, S, 2009, Study on water performance of buildings
Final report, Reference: 070307/2008/520703/ETU/D2, European Commission.