DOCTORAL THESIS IN TECHNOLOGY AND HEALTH STOCKHOLM, SWEDEN 2017
A Novel Method to
Intelligently Mine Social
Media to Assess Consumer
Sentiment of
Pharmaceutical Drugs
Altug Akay
Abstract
This thesis focuses on the development of novel data mining techniques that convert user interactions in social media networks into readable data that would benefit users, companies, and governments. The readable data can either warn of dangerous side effects of pharmaceutical drugs or improve intervention strategies. A weighted model enabled us to represent user activity in the network, that allowed us to reflect user sentiment of a pharmaceutical drug and/or service. The result is an accurate representation of user sentiment. This approach, when modified for specific diseases, drugs, and services, can enable rapid user feedback that can be converted into rapid responses from consumers to industry and government to withdraw possibly dangerous drugs and services from the market or improve said drugs and services.
Our approach monitors social media networks in real-time, enabling government and industry to rapidly respond to consumer sentiment of pharmaceutical drugs and services.
Abstrakt
Denna avhandling fokuserar på utveckling av nya data mining som omvandlar användarinteraktioner i sociala medier nätverk i läsbara data som skulle gynna användare, företag och regeringar. De läsbara data kan antingen varna för farliga biverkningar av läkemedel eller förbättra interventionsstrategier. Ett vägt modell det möjligt för oss att representera användaraktivitet i nätverket, som tillät oss att reflektera användar känslan av ett läkemedel och / eller service. Resultatet är en exakt återgivning av användarens känsla. Detta tillvägagångssätt, när modifierats för specifika sjukdomar, droger och tjänster, kan möjliggöra snabb feedback från användarna som kan omvandlas till snabba svar från konsumenter till industrin och regeringen att dra tillbaka potentiellt farliga droger och tjänster från marknaden eller förbättra dessa läkemedel och tjänster.
Vår strategi övervakar sociala medier i realtid, vilket gör att regeringen och industrin att snabbt reagera på konsumenternas åsikter av läkemedel och tjänster.
Acknowledgements
I would like to express my sincere gratitude and appreciation for my advisor, Björn-Erik Erlandsson who was an excellent advisor and mentor, who understood, and appreciated my efforts, dedication, and ideas, and patiently guided me from the beginning of my doctoral education to the end.
I thank both Kaj Lindecratz and Hans Herbert for their valuable support, feedback, and patience. I thank Dr. Andrei Dragomir for his expertise, support, and patience as we worked long hours and during the weekends to produce, and publish, papers in high-impact journals in our field. I thank all of my colleagues and the friends that I made here. I learned from all of you and it has helped me to improve my outlook on many aspects of education and life.
I would finally like to thank my parents, who taught me perseverance, patience, and to openly accept challenges, who encouraged me to be different to make a greater impact in the world.
Abbreviations
BMN – Best Matching Neuron
GATE – General Architecture for Text Engineering HITS – Hyperlink-Induced Topic Search
MAO – Module Average Opinion
MCSD – Multi-Scale Community Detection MeSH – Medical Subject Heading
NLP – Natural Language Processing NLTK – Natural Language Tool Kit SOM – Self-Organizing Map
TF-IDF – Term Frequency-Inverse Document Frequency UAO – User Average Opinion
Table of Contents
Abstract ... 1 Acknowledgements ... 2 Abbreviations ... 3 Chapter I - Introduction ... 5 Thesis Outline ... 6 Chapter II - Aim ... 7 Chapter III – Publications and Conference Presentations ... 8 Chapter IV - Methods ... 9 Search ... 9 Mining and Preprocessing ... 9 Text Classification ... 10 Self-Organizing Maps ... 10 Network Analysis ... 11 Identifying Sub-graphs ... 14 Module Average Opinion and User Average Opinion ... 16 Information Brokers ... 18 Identification of Side Effects ... 18 Identification of Influential Users ... 19 Chapter V - Results ... 20 Chapter VI - Discussion ... 26 Chapter VII – Challenges and Limitations ... 28 Chapter VIII – Conclusion and Future Direction ... 30 References ... 31 Journal Paper I ... 35 Journal Paper II ... 44 Journal Paper III ... 54 Journal Paper IV ... 64Chapter I - Introduction
Social media networks enable people to connect and collaborate on a wide variety of topics. Healthcare-related networks have sprung up in recent decades on countless medical conditions. These networks have allowed patients to share their experiences and develop a sense of community [1-3]. The contents of this expanding data range from managing their medical conditions in their daily lives to expressing their views on medical products and services [4,5]. This can greatly benefit patients, healthcare workers, industry, and policymakers if intelligently mined, extracted, and analyzed.
Modeling an online social network requires using data and network analysis software, from which a model of the network can be developed. This model allows us to look at the two components of an online social media network: the nodes, which represent either individuals or organizations, and the edges, which connect the nodes based on different levels of friendship, kinship, interests, etc. amongst the nodes. The construction of a model allows us to visualizethe information [6-16].
The model of the network can also allow us to understand its internal dynamics. Such models can show how users can disseminate information amongst themselves. The models can also reveal how the edges of the network can either become stronger or weaker based on the disseminated information and the influence of certain nodes.
The ultimate goal of data mining is to create a matrix that can represent extracted information, from which it is possible to construct a representation of a network in its entirety. The node degree and other parameters can derive information about the depth (or importance) of certain entities (or topics) within the network. These entities, or communities, are clusters within the network. These clusters are found using specific algorithms.
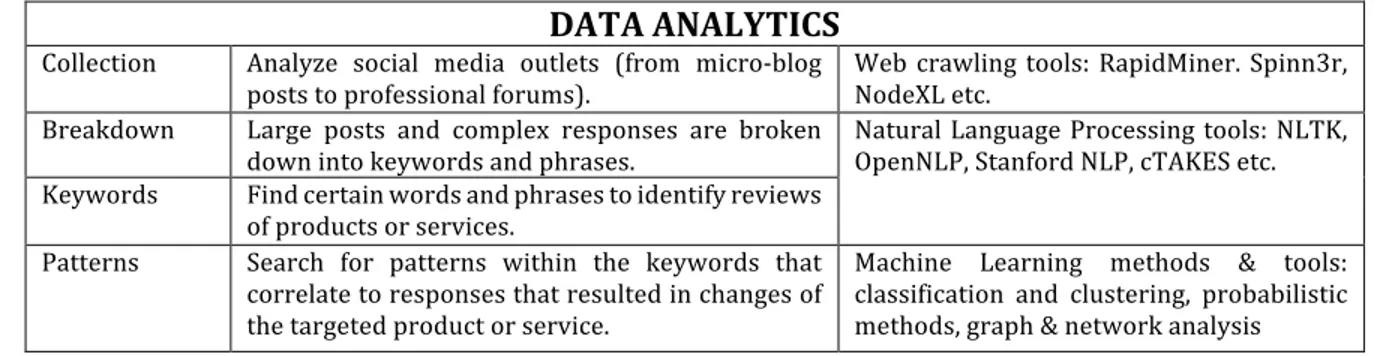
Table 1 shows the basic data mining and analysis method divided into four steps: collection, breakdown, keywords, and patterns. The first step is collecting the data from various social media networks, using tools like Rapidminer (www.rapidminer.com), Spinn3r (www.spinn3r.com), and NodeXL (http://nodexl.codeplex.com) accomplish this task. The second task is to breakdown the data to search for specific words and phrases on the topic of interest (i.e., research on diabetes focuses on insulin strips, etc.). This task requires a specific lexicon for the sought-after sickness and treatment. The third step is to search and identify keywords and phrases to link specific products and services. Advanced methods must also account for keyword placement within a context of a post. The last step is to discover patterns within the keywords, their connections to certain words and phrases, and converting the patterns into readable data (customer satisfaction/dissatisfaction of pharmaceutical drugs and services).
DATA ANALYTICS Collection Analyze social media outlets (from micro-blog
posts to professional forums). Web crawling tools: RapidMiner. Spinn3r, NodeXL etc. Breakdown Large posts and complex responses are broken
down into keywords and phrases. Natural Language Processing tools: NLTK, OpenNLP, Stanford NLP, cTAKES etc. Keywords Find certain words and phrases to identify reviews
of products or services.
Patterns Search for patterns within the keywords that correlate to responses that resulted in changes of the targeted product or service.
Machine Learning methods & tools: classification and clustering, probabilistic methods, graph & network analysis
Building on this principal approach, researchers have studied various topics to understand the consumers’ tendencies, and act on information based on social network data. A common characteristic of these approaches is first applying a natural language processing program that can extract relevant information. Big data complexity then becomes more manageable, allowing for further analyzing and modeling to extract pertinent data.
The health care sector can use this critical information by developing an action plan for improving or recalling products and services. Health care providers and pharmaceutical companies can evaluate the level of satisfaction (or dissatisfaction) of their services among patients. This data can also provide doctors feedback from their peers and patients to help improve treatment plans. Additionally, patients can evaluate, and leverage, other consumer knowledge prior to making crucial healthcare decisions.
The many challenges to this method are addressed below (under Challenges). We focus only on converting seemingly chaotic social media discussions into readable data by combining methods that we have developed and adding methods used by other researchers.
Thesis Outline
After a brief abstract, Chapter 1 provides an introduction to the topic, with the motivation and thesis outline. Chapter 2 provides the aim of the project. Chapter 3 provides a list of the published papers and conference presentations. Chapter 4 provides the methods used in the course of the study. Chapter 5 summarizes the results of the studies. Chapter 6 provides a discussion of the results. Chapter 7 addresses the limitations and challenges of this study. Chapter 8 address the conclusion and future direction of this work.
Chapter II - Aim
The aim of this thesis was to develop a novel data mining platform to decipher the consumer level of satisfaction of pharmaceutical drugs in a social media network. The research papers divided this aim into three steps:
Paper I: Develop an initial platform to ascertain consumer satisfaction of the Type II Diabetes drug Sitagliptin (trademark name Januvia). This initial platform focused on words.
Paper II: Refine the initial platform to ascertain consumer satisfaction of the oncology drug Erlotinib (trademark name Tarceva). This refined platform included tagged phrases and simple sentences in addition to discovering influential users
Paper III: Further refine the initial platform to ascertain consumer satisfaction of various anti-depressant drugs. This refined platform expanded to include the entire semantic context, in addition to tagged phrases, simple sentences, and influential users.
Paper IV: This paper presents an overview of the field and highlights its promises and challenges. The papers reflect the evolution of our methods and the advances we made in increasing the accuracy of our findings to ensure that consumer reactions to social reflect the real-world settings of the level of satisfaction of pharmaceutical drugs. The conference papers served as initial test cases for the novel data mining software and were excluded from the thesis.
Chapter III - Publications and Conference Presentations
Paper I - Akay, A., Dragomir, A., Erlandsson, B-E., “A novel data-mining approach leveraging social media to monitor consumer opinion of sitagliptin,” IEEE Journal of Biomedical and Health Informatics, vol. 19, Issue 1, Jan. 2015
Paper II - Akay, A., Dragomir, A., Erlandsson, B-E., “Network-Based Modeling and Intelligent Data Mining of Social Media for Improving Care,” IEEE Journal of Biomedical and Health Informatics, vol. 19, Issue 1, Jan. 2015
Paper III - Akay, A., Dragomir, A., Erlandsson, B-E., “Assessing anti-depressants using intelligent data monitoring and mining of online fora,” IEEE Journal of Biomedical and Health Informatics, vol. 20, Issue 4, Jul. 2016
Paper IV - Akay, A., Dragomir, A., Erlandsson, B-E., “Mining Social Media Big Data for Health,” IEEE Pulse, November/December 2015
Conference Presentation I - Akay, A., Dragomir, A., Erlandsson, B-E., “A novel data-mining approach leveraging social media to monitor and respond to outcomes of diabetes drugs and treatment,” Presented in Point-of-Care Healthcare Technologies (PHT), 2013, IEEE in Bangalore, India, 16-18 Jan. 2013, DOI: 10.1109/PHT.2013.6461335
Conference Presentation II - Akay, A., Dragomir, A., Erlandsson, B-E., “A novel data-mining platform leveraging social media to monitor outcomes of Januvia,” Presented in 2013 35TH Annual
International Conference of the IEEE Engineering in Medicine and Biology Society (EMBC) in Osaka, Japan, 16-18 July. 2013, DOI: 10.1109/EMBC.2013.6611289
Conference Presentation III - Akay, A., Dragomir, A., Erlandsson, B-E., “A Novel Data-Mining Platform to Monitor the Outcomes of Erlontinib (Tarceva) Using Social Media,” Presented in 2013 XIII Mediterranean Conference on Medical and Biological Engineering and Computing in Seville, Spain, DOI: 10.1007/978-3-319-00846-2_345
Chapter IV – Methods
Search
The first step was the consolidation of information on a specific disease. We perused through global health statistics on the most prevalent diseases currently affecting human populations. We then developed a list of current medications to combat such diseases. We then sought the most active social media networks dedicated to these diseases. We chose the following diseases based on our research on current global health statistics: Type-2 Diabetes [17-19], Lung Cancer [20-21], and Depression [22]. We then manually searched message boards to find the most discussed medications of these diseases (both the trade and drug names).
Mining and Preprocessing
The next step was to collect, process, and analyze the data from the social media networks using a modified data collection and processing tree within Rapidminer (www.rapidminer.com). Figure 1 is decision-making tree that represents our methodology. The data is initially uploaded into the first component (‘Read Excel’). The uploaded data is sent to the second component (‘Process Documents to Data’) and is filtered using several sub-components (‘Extract Content’, ’Tokenize’, ’Transform Cases’, ‘Filter Stopwords’, ‘Filter Tokens,’ respectively). These sub-components filter misspelled words, common stop words, etc., to ensure a uniform set of variables that can be measured. The result is final word list in the final component (‘Processed Data’), with each word containing a specific TF-IDF score.
Fig. 1. The processing tree in Rapidminer to ascertain the TF-IDF scores of words in the data
In the TF-IDF formula below, we assigned weights for every word found in the user posts:
where tf is the number of times a specific word (t) appears in the document (d) within in a specific text, n is the number of documents within the entire collection, and xt represents the number of
documents where t occurs. TF-IDF is a widely used standard frequency measure [23]. We used it since it reflects the importance of a word to a document within a corpus.
Text Classification
The words with the highest TF-IDF scores were located in the forum posts and were then tagged using Python (https://www.python.org) and the Natural Language Tool Kit (NLTK) toolkit (http://www.nltk.org) based on whether they reflected the negativity of a negative word and the positivity of a positive word based on context. For example, the term ‘I do not feel great’ resulted in the word ‘great’ being tagged as ‘great_n’ before it is returned to its specific position. Researchers used a similar approach in classifying words [24]. In Paper II, we went one step further and added a positive tag on negative words [20-22]. A sentence that states ‘No side effects so I am happy!’ resulted in the word ‘No’ being tagged as ‘No_p’ before it is returned to its specific position. These tagged words were then reclassified based on the context of the post.
The next step was to reduce the number of similar words. This was done both manually (checking the words using online dictionaries such as Merriam-Webster (http://www.merriam-webster.com/)) and automatically (synonym database software such as Thesaurus Synonym Database (http://www.language-databases.com/) and Google’s synonym search finder (using ‘~’ after a word). In Paper I, we finalized the wordlist using the method above [17-19]. In Paper II, we automatically browsed the user posts to look for side effects of Erlotinib [20-21]. To this goal we used the National Library of Medicine’s Medical Subject Heading (MeSH) (http://www.nlm.nih.gov/mesh/), which is a controlled vocabulary that consists of a hierarchy of descriptors and qualifiers that are used to annotate medical terms. A custom designed program was used to map words in the forum to the MeSH database. A list of words present in forum posts that were associated to treatment side effects was thus compiled. This was done by selecting the words simultaneously annotated with a specific list of qualifiers in MeSH (CI – chemically induced; CO – complications; DI – diagnosis; PA – pathology and PP – physiopathology). We then compared the full list of side effect words with the results that were fed into the Rapidminer processing tree: we kept the side effect words with the highest TF-IDF scores (ensuring that each word appeared at least ten times in the forum posts). In Paper III [22], we used the General Architecture for Text Engineering (GATE) (https://gate.ac.uk) software as a secondary toolkit for natural language processing. This allowed us to tag the terms in each post. We then combined the tagged terms of the NLTK and GATE with the National Institute of Health's Unified Medical Library System (UMLS) (https://www.nlm.nih.gov/research/umls/) and the Diagnostic and Statistical Manual of Mental Disorders (DSM) (http://www.dsm5.org), which allowed us to tag medical terms ranging from medications to side effects. We also used dictionaries such as Merriam-Webster (www.merriam-webster.com) and Thesaurus Synonym Database (www.language-databases.com) to reduce similar words in our databases, and manually compared the results by noting the same words in physical dictionaries. The end result was the compilation of wordlist with very strict criteria: each word that appeared less than ten times was also eliminated. This allowed us to achieve a uniform set of measurements while eliminating statistically insignificant outliers. Self-Organizing Maps
In Papers I and II, we used a self-organizing map (SOM) that uses a neural layer (that projects the input data) to represent an output space, with each neuron corresponding to a cluster with an attached weight vector. The values of the weight vectors reflect the content of the cluster they are attached to. The SOM presents the available data to the network, linking similar data
vectors to the same neurons. We used the self-organizing map (SOM) because of its visual benefits and high-level capabilities that greatly facilitated the high-dimensional data analysis [25].
The training process presents new input data to the network that determines the closest weight vector and assigns the data vector to the matching neuron: such neurons (and its neighbors) undergo an adaptation process to reflect their new value. The neurons farther from the changed neurons adapt their weight vectors by a smaller degree. The process repeats for all input vectors until all convergence criteria are met. The end-result is a two-dimensional map.
We took the modified wordlist and fed it into the SOM toolbox
(http://www.cis.hut.fi/projects/somtoolbox/) in Matlab
(https://www.mathworks.com/products/matlab.html) to see if specific vectors clustered together based on the specified words from the word list. We trained the SOM with different map sizes, and chose as internal validation measures the quantization and topographic errors. The quantization error is computed as the average distance between each input vector and its best matching neuron (BMN), and a measure of how good the trained map fits into the input data [25]. The topographic error considers the map structure and represents the accuracy of the map in preserving its topology. The topographic error value is calculated from the proportion of all data vectors for which the first and second BMNs are not adjacent for measuring topology preservation. The optimum map size was chosen based on the minimum values of the quantization and topographic errors. The word list vectors were mapped onto the SOM and emerging clusters were further examined for correlations with positive of negative variables of the word list vectors. Cluster groups containing three or fewer posts, and no words of interest, were eliminated. The word occurrences were counted in the remaining cluster groups.
We then visually identified subgroups within the map (‘positive words’ and ’negative words’) and ascertained which posts were gravitating towards which words and whether the map reflected consumer satisfaction (or dissatisfaction) towards the medications and treatments. Network Analysis
Our next step was to identify influential users within the social network. We used three different approaches. In Paper I [17-19], we built networks from forum posts and their replies. Networks consist of nodes and connections: they are either non-directional (a connection between two points without a direction) or directional (a connection with a point of origin to an end). A non-directional nodal degree measures the number of connections of a node whilst a directional nodal degree measures the number of connections from an original node and its destination(s). Researchers identified four different nodes within a network: Isolated (connects to no other nodes), Transmitter (connects to other nodes but does not receive them), Receptor (does not connect to other nodes but receives them), and Carrier (connects and receives connections). The network density measures the current number of (many) connections [26].
Directional networks divide the maximum number of connections with the number of arrowed connections as shown below:
where L is the number of connections and f is the total number of nodes.
use in social network analysis, and the ease with which to study, and model, user interactions and relationships. We used the directional network model because of the nature of the forum and its internal dynamics among the members. The approach we chose to build our network is described in Figure 2, which shows how each posting-reply pair is modeled.
Fig 2. The nodes represent users/posts and the edges represent information among users.
We started by creating nodes for posts containing direct replies (responses to previous posts in the forum) and added bi-directional edges connecting these nodes, as described in Figure 1. The reason we used bi-directional edges in such cases was to reflect the ensuing information transfer (from the initial poster to the replier and vice versa, based on the assumption that they both read the initial post and its reply). Following this, we added additional edges to the subsequent posts (coded in green in Figure 1). These edges are unidirectional, based on the realistic assumption that the subsequent posts continued to discuss the topic thread (initial post). We set a threshold of three to the number of subsequent posts that are considered as influenced by the initial post. This threshold was set based on our empirical observation of posting contents and their timing.
In Paper II [20-21], we built networks from forum posts and their replies, while accounting for content-based grouping of posts resulting from the existing forum threads. The network-based analysis is widely used in social network analysis based on its ability to both model and analyze inter-social dynamics. We devised a directional network model due to the nature of the forum under scrutiny (multiple threads with multiple thread initiators) and its internal dynamics among the members (members reply to thread initiators as well as to other users). Figure 3 describes the approach we chose to build our network, which shows how each posting-reply pair is modeled.
Fig 3. The thread model where nodes represent users/posts and the edges represent information transferred among users.
Based on the nature of the forum, all of the posters within each thread are context posters for the thread initiator (e.g. Node 1 is the thread initiator in Figure 3 and Nodes 2,3,4 and 5 in represent context posters). Thus, all of the posters receive an incoming edge from the thread initiator. Some context posters respond directly to another poster, using the forum option ‘Reply.’ We used bi-directional edges to reflect the ensuing information transfer from the poster to the replier and vice versa (in Figure 2 Node 5 is a direct replier to Node 4, as is Node 3 to Node 2). This user-interaction model allowed us to build a network that reflects faithfully the information content of the forum.
postings and replies were modeled into a large user-centric network. The modeling approach aimed at reflecting user interactions while simultaneously considering the posts’ semantic content. The nodes in our network correspond to forum users and connecting directed edges correspond to two different types of interactions: direct and context interactions. Direct interactions correspond to direct user-to-user replies using the forum’s ‘Reply’ option. These interactions were modeled with bi-directional edges connecting the two corresponding nodes. This allowed us to model the mutual exchange of information between a poster and a direct replier. Context interactions reflect users posting within a specific thread (threads are topic-specific, and thread semantic content is homogeneous). Therefore, uni-directional edges were used to connect thread initiators to all other users posting within a specific thread. This allowed us to model the information transfer from thread initiators to users posting within the respective thread.
Fig 4. The network model we considered: nodes represent users/posts and the edges represent information transferred among users.
In Figure 4, Node #1 is the thread initiator and as such there are directional edges linking this node to all other nodes within this specific thread. Node #5 is a direct reply to the thread initiator and as such it is linked with a bi-directional connection to the thread initiator. Similarly, Node #3 is directly replying to Node #2, reflected by the bi-directional edge linking the respective nodes.
We then added weights to the edges in our network by using semantic profiles corresponding to each forum post and the cluster centroids resulting from clustering the semantic profiles using the k-means method. Specifically, the weight of each edge connecting two nodes x and y in our network is computed taking into consideration the clusters to which their corresponding semantic profiles belong to, and the respective distance between these clusters’ centroids Cx and Cy: 𝑤 𝑥, 𝑦 = &' &'(&)∙ + ,- ./0' 1( 2/0) 1 (,1 0'/0) 1
Where ||·|| is a distance metric (the Euclidian distance in our study). Constants η1 and η2 are
introduced to provide additional confidence to the factors of the weight function. We chose η2 >
η1 to emphasize the distance between cluster centroids. This minimized potential noise issues that
may arise from semantic profiles. Similar network edge weighting strategies have been used in genetic network modeling [24]. rx and ry denote forum user ranks of users x and y, coded
numerically, and are reflective of users forum posting activity (with lower values corresponding to new users and higher values to experienced users). The approach we introduced was aimed at
adding more weight to edges connecting experienced users to beginners, thus reflecting the ensuing information transfer. In cases where two nodes (users) are connected by more than one interaction (forum reply), the weight of the corresponding inter-connecting edge is computed as the mean of the weights corresponding to each interaction.
Identifying Sub-graphs
In Paper I [17-19], our modeling framework has converted the forum posts into several large directional networks containing a number of densely connected units (or sub-networks) and unconnected nodes. We pruned the initial networks to identify strongly connected components (or information modules). A strongly connected component is defined for directed networks as a sub-network in which each two nodes u and v are connected to each other by at least two paths (along the connecting edges): one from u to v and one from v to u [26]. The algorithm we used for retrieving these strongly connected components employs a depth-first search approach [28]. Identifying strongly connected components ensures that information transfer within the sub-network is maximized.
In Paper II [20-21], we converted the forum posts into several large directional networks containing a number of densely connected units (or modules). These modules are more densely connected internally (within the unit) than externally (outside the unit). We chose a multi-scale method that uses local and global criteria for identifying the modules, while maximizing a partition quality measure called stability [29].
The stability measure considers the network as a Markov chain, with nodes representing states and edges being possible transitions among these states. Researchers have proposed an approach in which transition probabilities for a random walk of length t (t being the Markov time) enable multi-scale analysis [29]. With increasing scale t, larger and larger modules are found.
The stability of a walk of length t can be expressed as:
where At is the adjacency matrix, t is the length of the network, m is the number of edges, i and j
are nodes, di is node i’s (and j’s) strength, and 𝛿(i,j) function becomes one if one of the nodes
belong to the same network and zero if it doesn’t belong to any network. At is computed as follows
(in order to account for the random walk): At = D·M t, where M = D-1·A (D being the diagonal
matrix containing the degree vector giving for each node its degree) [29].
The method for identifying the optimal modules is based on alternating local and global criteria that expand modules by adding neighbor nodes, re-assigning nodes to different modules and merging significantly overlapping module until no further optimization is feasible. Several partitioning schemes were obtained pending on the range of scales employed by the method, with the optimal partitioning having the largest stability. We named the modules thus retrieved information modules.
In Paper III [22], we converted the forum posts as follows in Figure 5: A. Language Processing Block. First, the posts collected from the forum via Rapidminer are pre-processed using the NTLK Toolbox and GATE (Step A1) and transformed into a wordlist (Step A2). At this step,
Database and Merriam-Webster for synonyms matching. Based on the two wordlists, forum posts are transformed into numerical vectors containing word-frequency based TF-IDF scores, which are subsequently clustered using the k-means method. Additionally, a database consisting of all wordlist terms found in every post is created (step A3). B. Network Processing Block. In parallel, forum posts and replies are modeled as a weighted directed network (Step B1). Obtained network is further refined to identify communities/modules of highly interacting users, based on the MCSD method [29] (Step B2). Finally, the network modules are analyzed to identify statistically significant terms over-represented in modules, find influential users and highlight side effects intensively discussed within the modules, respectively (Step B3).
Fig. 5. The diagram describing the framework of our network-based analysis.
Finding groups of nodes that share similar properties is an important step in network analysis as identifying such modules can provide crucial information about the underlying structure of the network and its functioning [30]. These modules are more densely connected internally (within the unit) than externally (outside the unit). Additionally, identifying modules and their boundaries allows classification of individual nodes and the role they play in module control and stability, based on local topological properties. We chose a multi-scale method that uses local and global criteria for identifying the modules, while maximizing a partition quality measure called stability [30]. In the context of network partitioning, stability is used both as a quality measure for evaluating a partitioning scheme and as an optimization function [30,31]. Under our current framework for detecting network modules, the network is considered a Markov chain, where each node represents a state and each edge a possible state transition. Markov time is used as a resolution parameter when creating various partitions. The method starts with an initial number of modules equal to the number of nodes in the network and subsequently merges initial modules into larger ones. A greedy algorithm is used for optimizing stability [31]. Several partitioning schemes were obtained pending on the range of scales employed by the method, with the optimal partitioning having the largest stability. Identification of the modules entails the largest part of the computational cost of our approach, as the algorithm is implemented with a complexity
2
Module Average Opinion and User Average Opinion
In Paper I [17-19], we further refined the obtained information modules by enriching them with information from the posts via the corresponding word list vectors. At this step, we use the word lists’ TF-IDF scores to derive two measures characterizing user opinion. We first defined a global measure (characterizing the whole information module): the module average opinion (MAO) by examining the TF-IDF scores of all postings corresponding to the nodes within a specific module:
Where: is the sum of all TF-IDF scores corresponding to positive variables (words) of the word lists and for all users within the current module. The unit i is the node/post index. The unit j is the wordlist index (corresponding to positive variables of the word lists).
is the sum of all TF-IDF scores corresponding to negative variables (words) of the word lists and for all users within the current module. The unit i is the node/post index. The unit j is the wordlist index (corresponding to negative variables of the word lists).
is the total of both sums. The unit k represents the index running across all variables of the word list.
Similarly, we defined also a local measure charactering user opinion (specific to each node in the module), the user average opinion (UAO), by examining the TF-IDF scores of the post corresponding to the specific node:
Where 𝑆𝑢𝑚7( = 9∈;𝑥79 is the sum of all TF-IDF scores corresponding to positive variables (words) for the ith user’s word list and P is the set of indices denoting the positive variables of the word list.
𝑆𝑢𝑚7/ = 9∈<𝑥79 is the sum of all TF-IDF scores corresponding to negative variables (words) for the ith user’s word list and N is the set of indices denoting the negative variables of the word list.
𝑆𝑢𝑚=>> = ? 𝑥79
9@+ is the total of both sums. The unit j represents the index of the whole wordlist.
In Paper II [20-21], we then proceeded to refine the information modules through feeding them with the information obtained from the forum posts (using the wordlist vectors). We first aimed at identifying influential users within our networks. Influential users are users which broker most of
MAO = Sum+− Sum−
Sumall Sum+=
∑
∑
xij Sum−=∑
∑
xij Sumall= xik k=1 M∑
i=1 N∑
UAOi= Sumi+− Sumi−
modules. To this goal, we enriched the information modules obtained with the TF-IDF scores of the user posts corresponding to the users found in each module. The TF-IDF scores from the wordlist of positive and negative words were used to build two measurement forms. The global measure (pertaining to the whole information module) is represented by the module average opinion (MAO). It examined the TF-IDF scores of postings matching the nodes in a specific module:
is the total sum of the TF-IDF scores matching the positive words in the wordlist vectors within the module. The units i represent post index. The unit j represents the wordlist index (matching the positive words in the list).
is the total sum of the TF-IDF scores matching the negative words in the wordlist vectors within the module. The units i represent post index. The unit j represents the wordlist index (matching the negative words in the list).
is the sum of both of the above sums. The unit k is the index running across variables throughout the entire wordlist.
In Paper III [22], we then proceeded to find terms that are significantly over-represented within each of the modules found by a network-partitioning algorithm using a database containing the terms annotating each post and the hypergeometric enrichment test that is based on the hypergeometric distribution [32].
Hypergeometric testing can evaluate whether a particular set of terms is represented more than expected by chance within a population sample (in our case a module) when compared to the total population (in our case all the forum postings), given that the term set is sampled without replacement from the finite population of forum posts.
Once modules are detected, and based on the terms annotating all nodes of the respective module, we retrieve the total set of terms present within each module. Worth noting, when defining the set terms annotating a node, all posts of that specific node and their corresponding terms are considered. Subsequently, for each term in the module, we compute a probability as follows: if N denotes the population size of the forum (total number of posts) and we have a total of M posts annotated with that specific term, the probability of drawing by chance k or more posts annotated with the exact term within a module will be:
𝑝 = 1 − DE FGDHGE F H
I
7@J
Where n is the number of posts found in the module. We set a confidence level for each term at 99% (p-value<0.01 is considered significant). Consequently, at this step we found sets of terms that are significantly over-represented within each of the modules, being thus highly representative of module’s semantic content.
MAO =Sum+− Sum−
Sumall Sum+=
∑
∑
xij Sum−=∑
∑
xij Sumall= xik k=1 M ∑ i=1 N ∑Information Brokers
We first ranked individual nodes in terms of their total number of connecting edges (in and out-degree).
We then searched for nodes within each module that fulfilled the following criteria: 1. They are influential users (nodes with the largest degrees)
2. The UAO scores are within the MAO scores (both MAO > 0 and UAO > 0 or both MAO < 0 and UAO < 0).
We named the nodes fulfilling the above criteria information brokers, because they possess the highest number of connections in the strongly connected information modules.
Identification of Side Effects
In Paper II [20-21], we devised a strategy for identifying potential side effects occurring during the treatment and which user posts on the forum highlight. The TF-IDF scores within each module will thus directly reflect how frequent certain side effects are mentioned in module posts. Subsequently, a statistical test (such as the t-test for example) can be used to compare the values of the TF-IDF scores within the module to those of the overall forum population and identify variables (side-effects) that have significantly higher scores. Figure 6 presents a diagram that visually describes the steps in our network-based analysis.
Fig. 6. Diagram describing the framework of our network-based analysis. First, the posts collected from the forum via Rapidminer are pre-processed using the NTLK Toolbox (Step A1) and transformed into two wordlists (Step A2). For this step, direct mapping to the MeSH vocabulary is used to identify words representing side-effects Based on the two wordlists, forum posts are transformed into numerical vectors containing word-frequency based TF-IDF scores (step A3). In parallel, forum posts and replies are modeled as a directed network (Step B1). Obtained network is further refined to identify communities/modules of highly interacting users, based on the MCSD method. (Step B2). Finally, the two wordlist vectors datasets
Identification of Influential Users
In Paper III [22], we proceeded to identify influential users in the retrieved modules. To this goal we used the Hyperlink-Induced Topic Search algorithm (HITS), which is a method initially developed for web pages link analysis [33-34]. It retrieves, through mutual recursion, two numbers to a node: an authority and a hub score. A node has higher authority when it receives incoming edges from nodes with higher hub scores. A higher hub score occurs when a node has outgoing edges to many high authority nodes. The algorithm finds the authority and hub scores of each node in a module via a series of iterations consisting of two steps: authority update (during which each node’s authority score is computed as the sum of all hub scores of each node to which it is connected through incoming edges) and hub update (during which each node’s hub score is computed as the sum of the authority scores of each node to which is sends outgoing edges). In turn, the authority and hub score for each node is computed as follows: 1) initialize the nodes authority and hub scores to 1; 2) execute the authority update step; 3) execute the hub update rule; 4) normalize the values of the authority (hub) scores by dividing each authority (hub) score by square root of the sum of squares of all authority (hub) scores [33].
Information disseminates from Authoritative nodes. Hubs link to authoritative nodes and thus they broker information flow within the network. This approach for identifying influential users has the advantage of considering both the network’s structural properties, and the directionality of information flow.
Chapter V – Results
In Paper I [17-19], we depicted a graphical representation of the SOM of the positive and negative words group in the forum DiabetesDaily (https://www.diabetesdaily.com/forum/). Prior to the final SOM, a subset of the data was used for training the SOM. This was to ensure that SOM was trained to accurately model a sample set of the data prior to receiving the whole data set. To this end, thirty percent of the data were selected for training the SOM. We used a 13 x 13 map size with twenty-eight variables from the modified wordlist to ascertain the weight of the words corresponded to the opinion of the drug Sitagliptin (https://www.januvia.com). A criterion for selecting the variables was that each word should appear ten times and above. This allowed us to achieve a uniform set of measurements while eliminating statistically insignificant outliers.
The bulk of the user’s posts converged on four points of the map. We checked the correlation of the respective nodes with the values of their weight vectors corresponding to positive or negative words. This is how we defined the positive and negative areas of the map.
A picture begins to emerge of user opinion that is roughly divided with regards to satisfaction (or lack thereof) of the drug Sitagliptin. One source of negative opinion stems from the side effects of the drug. A review of the medical literature has confirmed the very same side effects that the users were discussing [35-38]. Other sources of negative opinion vary from user frustration of the drug costs to frustration at the medical community. Positive opinions mainly stemmed from satisfaction by users who switched to it based on recommendations from a physician. Figure 7 shows the SOM analysis that reflected on the rough division of user opinion of Sitagliptin on the forum, based on the reasons stated above.
Fig. 7 Results of the SOM analysis on posts from the DiabetesDaily forum. Top left panel shows the unified distance matrix in which several user clusters can be observed. The rest of the panels display individual word list variables values obtained after SOM map training.
The next step was to identify specific, influential users within the forum. On the DiabetesDaily forum, six users out of the 711 posters were identified as information brokers. The densities of these modules range from 0.25 to 0.55. These density values are within the observed density values interval (towards the upper limit), when compared to those generally noted in social networks, thus confirming our network modeling approach. These density values are relatively high when compared to those generally observed in social networks, thus confirming our approach [39-40]. They received, and connected to, other nodes in the network and their connections were
mostly informative, combining information from sources from the Internet and from personal experience with Sitagliptin. Their wisdom and experience regarding Sitagliptin was positively received and sought after by other members. These users were also active in answering questions that other users (from newcomers to long-time members) had concerning Sitagliptin. Their forum ‘behavior’ has confirmed to us that these users were the premier information brokers of the drugs Sitagliptin on the DiabetesDaily forum.
In Paper II [20-21], the unified matrix resulting from the SOM analysis for the wordlist vectors corresponding to the positive and negative terms from the message board The Cancer Forums (https://cancerforums.net). A subset consisting of 30% of the data was used for training the SOM. We used a 12 x 12 map size with 110 variables corresponding to the positive and negative terms to ascertain the weight of the words corresponded to the opinion of the drug Erlotinib. As mentioned in the Methods section, each word from the list appeared more than ten times. This achieved a uniform measurement set while eliminating statistically insignificant outliers.
Much of the user’s posts converged on three areas of the map. We checked the respective nodes’ correlation with their weight vectors’ values corresponding to positive or negative words to define the positive and negative areas of the map.
The user opinion of Erlotinib was overall satisfactory, with Table 2 summarizing the satisfaction/dissatisfaction below:
TABLE 2: USER OPINION OF ERLOTINIB
Satisfaction Dissatisfaction
70 percent 30 percent
BREAKDOWN OF USER OPINION
Fully Satisfied (23) Full Dissatisfaction (4) Satisfied Despite Side
Effects (37)
Dissatisfaction because of Side Effects (20) Satisfied Despite Costs (10) Dissatisfaction because of
Costs (6)
According to chart, and from our readings of both the user posts and the SOM, the most pressing concern from both camps was the side effects, which are extensively documented in the medical literature [41-46]. The costs of the drug were also another matter of concern (albeit limited). Figure 8 shows the final u-matrix of the posts from the forum.
Fig. 8 The U-Matrix of the posts from the Cancerforums.net forum.
We then proceeded to identify influential users. Our modeling approach yielded initially a single loosely connected network, linking all users within the forum. Subsequent module identification IIF yielded an optimal partitioning containing five densely connected module. We
varied our scale parameter within the interval t ∈ [0,2] in 0.1 increments. Varying the scale parameter resulted in a set of partitions ranging from modules based on single individual users (for scale parameter t = 0), to large modules (for values of t close to the upper limit of the interval). The optimal was obtained for t=1.
On the Cancerforums.net message board, ten users out of the 920 posts were identified as information brokers. Densities of the retrieved modules range from 0.2 to 0.6. These density values were within the observed density values interval (towards the upper limit), when compared to those generally noted in social networks, thus confirming our network modeling approach [39-40]. Further scrutinizing these users and their containing modules we confirmed their connections were the densest. A thorough reading of these ten users’ posts throughout the threads they started and participated in revealed that they were informative and actively interacting with users across many threads. Other members sought out these ten posters for their wisdom and experience. Their forum ‘behavior’ has confirmed to us that these users were the premier information brokers of the drugs Erlotinib on the Cancerforums.net forum.
In the last part of our analysis we investigated which modules were significantly involved in discussing specific side effects. Retrieved modules were enriched with the TF-IDF scores corresponding to the side-effect wordlist vectors. For each module and each side-effect scores sample, t-tests were performed to assess the significant difference between the in-module sample and the overall forum population scores. Rash and itching were identified as the side effect terms with significantly higher scores in Modules 1, 2 and 5 when compared to the overall scores population in the forum, as described in Table 3. This reflects the fact that users grouped within these modules repeatedly discussed these side effects in their posts. This was confirmed by subsequent scrutiny of the respective posts. A literature search confirmed that rash and itching are indeed two of the most common side-effects of Erlotinib with as much as 70% of the patients affected, as indicated by clinical studies [44-46].
TABLE 3: Side Effect Frequency and Location in Selected Modules
Module 1 (A) ‘rash’ (p-value <0.01) ‘itch’ (p-value <0.05) Module 2 (B) ‘rash’ (p-value <0.05) Module 5 (E) ‘rash’ (p-value <0.01)
In Paper III [22], we collected data from the most popular depression related message board: Depressionforums.org (http://www.depressionforums.org). A total of 7726 posts (posted between July 2004 and October 2014, with an average of ~2/day) were automatically downloaded and pre-processed using RapidMiner, NLTK and TAKE. Tokenized, filtered and tagged terms were then pruned using the synonyms databases and then mapped to the UMLS. This resulted in a list of 277 terms that passed a threshold of n>10 appearances in the posts and denoted side effects, drugs, as well as positive and negative terms. Our data was then transformed into a numerical matrix (7726 x 277) containing the TF-IDF scores for all forum posts. For the k-means analysis step, we used k=20 clusters for the initial rough clustering of the TF-IDF derived semantic profiles. This value was determined by finding the minimum value of the Davis-Bouldin index, which corresponds to an optimal clustering [47].
Our network modeling approach yielded an initial loosely connected network, linking all users within the forum. Subsequent module identification yielded an optimal network partitioning containing fourteen densely connected modules. We varied our scale parameter within the interval
modules containing single individual users (for scale parameter t = 0), to large modules (for values of t close to the upper limit of the interval). The optimal partition (maximizing the stability based quality measure) was obtained for t=1.
Once modules were identified, we further characterized the modules content using the term enrichment analysis. We defined a measure that allowed us to quantify the ratio of positive and negative terms that enrich the modules to provide estimate on the user’s general opinion within a module:
𝑟7 =LPM/LO
M/PO
Where pi is the number of positive terms enriching module i, pt is the total number of
positive terms in the wordlist. ni is the number of negative terms enriching module i, nt is the total
number of negative terms in the wordlist. Based on this measure, we characterized modules to express predominately positive mood/opinions when their corresponding ri measure was greater
than 0.5 and predominantly negative when ri < 0.5. Out of the 14 modules identified, 5 belong to
the positive class, while 6 modules belong to the negative class. The remaining 3 modules were not enriched with neither negative, nor positive terms. Interestingly, we observed that positive class modules had significantly higher average user ranks (3.62±0.19) than negative class modules (2.66±0.24), p<0.01 (Using Student’s t-test – FDR corrected). User ranks were numerically coded, ranging from 0 – corresponding to new users- to 13- corresponding to premium platinum members (highest ranked users). Forum rankings are based on users’ activity on the forum and the number of total postings.
We also observed significantly higher average node degrees, as well as weighted node degrees (p<0.01) in the positive class modules. This directly reflects the fact that users from positive class modules are on average connected to more users than those in negative class modules. Moreover, the fact that edges connecting users in positive class modules have higher weights on average, reflect the fact that posts in these modules are semantically more homogeneous.
Our analysis further revealed significantly enriched side effect terms (p<0.01) in three out of fourteen retrieved modules. Modules 1 and 5 were significantly enriched for side effect term anorgasmia. These two modules were also significantly enriched for drugs terms citalopram (Celexa), cyclobenzaprine (Flexeril), duloxetine (Cymbalta), lorazepam and mirtazapine (Module 1) and citalopram, chlorpromazine and venlor (Module 5). Module 8 was enriched for side effect hypertension as well as the drug term promethazine. Our results confirm clinical research findings, which previously reported anorgasmia as a common side effect of citalopram, cyclobenzaprine, duloxetine, and chlorpromazine [48-51]. Additionally, hypertension was reported as a side effect of promethazine [52].
These users were chosen based on their highest authority and hub scores within their modules. We carefully perused through these member’s posts to ascertain their importance within the network and to see whether our methods correctly identified them as influential users. These users were knowledgeable on topics ranging from anti-depressants to managing depression in their daily lives. Further reading has revealed that these users also actively post the latest clinical research on anti-depressants and engaging with debates with other long-time members and newcomers on research findings and whether such research matches real-life experiences in
day-to-day activities. Their contributions (from posting the latest news on depression and anti-depressants, to actively participating in discussions) have resulted in their repeated requests for consultations.
Table 4: Characteristics of modules belonging to positive and negative class
Module measures Positive Class Negative Class
Mean node degree *(p<0.01) 2.09±0.41 1.40±0.25 Mean weighted degree *(p<0.01) 14.19±3.49 8.05±2.92 Density 0.012±0.008 0.015±0.009 Modularity 0.57±0.09 0.44±0.26 Mean clustering coefficient 0.11±0.06 0.22±0.2 Mean user rank *(p<0.01) 3.6±0.19 2.66±0.44
We further proceeded to analyze the user modules detected by our approach and test the influence of the term appearances threshold on the results. To this goal, we reduced the number of features of our semantic profiles in two successive steps. First we raised the threshold on the number of terms appearances to n>15. This resulted in the removal of 10 terms, thus reducing the number of features in our wordlist to 267. In a second step, we further raised the threshold to n>30, obtaining a reduced wordlist with 240 features. We subsequently recomputed the network edges weights and ran the network module detection algorithm. The detected modules for the two new networks were compared against the modules of the original network, using a measure based on the Jaccard similarity index. Namely, newly retrieved modules were paired with their closest match in the original network, based on the user nodes overlap. Jaccard index was computed both in terms of modules’ nodes overlap as well as modules relevant terms overlap:
𝐽P = 𝐴P 𝐵P 𝐴P 𝐵P and
𝐽T = 𝐴T 𝐵T 𝐴T 𝐵T
where An and Bn are corresponding pairs of modules (nodes sets) and At and Bt are sets of relevant
terms within modules A and B, respectively. Worth noting, the 267-wordlist network produced the same number of modules (14) as the original set with significant overlaps in what concerns the node content. The 240-wordlist network produced 15 modules.
Figure 5 shows the Jaccard similarity indeces of the 267-wordlist modules compared to the modules of the original dataset (Fig. 5A) and those of the 240-wordlist modules compared to the original dataset (Fig. 5B), in terms of both nodes overlap and relevant terms overlap. As it can be noticed, the modules largely preserve their content, with indeces >0.9 for the network nodes, and >0.6 for module relevant terms, when comparing the 267-wordlist network to the original network. When comparing the 240-wordlist network to the original network, the indeces remained at values greater than 0.8, with the exception of Module 4. The reduced feature wordlist caused this module (originally consisting of 23 user nodes) to split into 2 separate modules of 16 and 7 user nodes. For comparison reason, the 16 nodes module was used, as it overlapped with >50% with Module 4 in the original network. Slightly lower values were obtained for relevant terms Jaccard indeces when comparing the 240-wordlist network to the original one, as some of the nodes module
re-enrichment analysis. For example, 24 of the 369 nodes of the original Module 1 were reassigned to other modules (mainly modules 2 and 7) in the 240-wordlist network. Due to this, the number of relevant terms significantly enriching Module 1 decreased from 26 to 22 (p-value raised above 0.05 for terms anxiety, prominent, cyclobenzaprine and mirtazapine). The most important difference was observed for Module 11, which had 10 of its 122 nodes re-assigned to other modules (mostly to Module 9) and subsequently, preserved 3 out of the 7 relevant terms it was enriched with ((p-value >0.05 for terms ramble, horrendous, duloxetine and cyclobenzaprine). Modules 3 and 4 were not significantly enriched with any term in the original network and preserved this characteristic also in the reduced wordlist networks. Additionally, it must be noted that in both the 267- and 240-wordlist network modules preserved their original class.
Chapter VI – Discussion
In Paper I [17-19], the goal was to transform the posts of a forum dedicated to diabetes mellitus type 2 into vectors to be able to intelligently mine consumer opinion of the drug Sitagliptin. The results open new opportunities, and challenges, into developing more comprehensive solutions in this area.
A mixed consensus on Sitagliptin depends on individual patient outcome to solutions. The nature of a social media platform can result in individuals with different outcomes, based on various individual factors and circumstances. Despite such factors, we were able to sift through the data and find positive and negative sentiment, which was later confirmed by research that emerged regarding sitagliptin’s effectiveness and side effects. Up-to-date information in future studies will provide a much clearer picture of user feedback on drugs and services.
In Paper II [20-21], we converted a forum focused on oncology into weighted vectors to measure consumer thoughts on the drug Erlotinib using positive and negative terms alongside another list containing the side effects. Our methods were able to investigate positive and negative sentiment on lung cancer treatment using the drug by mapping the large dimensional data onto a lower dimensional space using the SOM. Most of the user data was clustered to the area of the map linked to positive sentiment, thus reflecting the general positive view of the users. Subsequent network based modeling of the forum yielded interesting insights on the underlying information exchange among users. Modules of strongly interacting users were identified using a multi-scale community detection method. By overlaying these modules with content-based information in the form of word-frequency scores retrieved from user posts, we were able to identify information brokers which seem to play important roles in the shaping the information content of the forum. Additionally, we identified potential side effects consistently discussed by groups of users. Such an approach could be used to raise red flags in future clinical surveillance operations, as well as highlighting various other treatment related issues. The results have opened new possibilities into developing advanced solutions, as well as revealing challenges in developing such solutions.
The consensus on Erlotinib depends on individual patient experience. Social media, by its nature, will bring different individuals with different experiences and viewpoints. We sifted through the data to find positive and negative sentiment, which was later confirmed by research that emerged regarding Erlotinib’s effectiveness and side effects. Future studies will require more up-to-date information for a clearer picture of user feedback on drugs and services.
In Paper III [22], a forum focused on depression was transformed into a series of scored vectors to measure sentiment on drugs used to treat depression using positive and negative terms alongside with drug names and side effect terms identified from UMLS. Our methods sought out consumer sentiment on depression treatment using drugs by modeling the forum and the exchange of information between users through network based modeling and analysis. In order to extract the most salient and relevant text features we represented the posted information on the forum using term frequencies, one of the commonly used pre-processing steps in text mining approaches [52-54]. Subsequent network based modeling yielded interesting insights on the underlying information exchange among users. To this goal we proposed a novel metric for adding semantic content to the edges of the modeled network.
Our analytical methods were able to reveal the side effects of anti-depressants in greater detail. A search through the medical literature backed our analysis results, which associated specific side effects with major anti-depressants (duloxetine, citalopram, cyclobenzaprine,
The analysis has additionally revealed that predominately positive opinion modules contained users with significantly higher user ranks than negative modules. Perusing the posts has revealed that the extent of positive opinion linked to advanced ranks is directly tied to users managing and (in some cases) overcoming the more extremes bouts of depression, in addition to experience of the drug itself. These users shared their experiences with the whole forum, particularly to newcomers who were desperate for guidance and support.
Further, both the average node degree and weighted node degrees were significantly higher (thus reflecting more densely connected structures and especially better connected users) in the positive modules. This aspect highlights that users in these modules sought information through more sources and interacted more than their peers in negative modules. Perusing the posts that were connected with the larger weighted degrees has revealed a similarity in the choice of topics discussed. Further reading of the original posts and responses has revealed more comprehensive discussions of topics.
Chapter VII – Challenges and Limitations
Ideally, a model should represent a sample of different consumer feedback (satisfaction, experience, etc.) from which researchers can manipulate the data for different purposes. As more data is fed into the model, the complexity increases, requiring trade-offs depending on what researchers are looking for (special terms relating to an outbreak, specific side effects to different prescription drugs, etc.).
In reality, the nature of social media, ranging from specific vocabulary used amongst its members, to inconsistent content in posts, makes data analysis often difficult. Consequently, several methods have been developed and launched to solve technical challenges associated with gathering and analyzing data collected from social media. Researchers have developed tools including data mining by topic and assessing outliers based on either unusual side effects or misinformation.
In Paper IV [55], we discussed the problems stem from the chaotic nature of the social media platforms. The particular issue is analyzing the tone and content of the message without placing extra burdens on computational resources. This would require the development of lexical dictionaries that must be continuously updated to keep up with slang terms and terminology that is often found in these platforms. Measuring these terminologies would merge formal dictionaries (with medical lexical databases), common everyday formal language, and slang terms that would result in a clearer picture (for the data collection software) of the actual discussion amongst users. A deeper understanding of the conversations would allow the software to further gauge user moods based on their written text and would allow for more accurate interpretation of the user’s thoughts on various topics (the opinion of a prescription drug, severity of a side effect, etc.). Other combined methods would use several other dictionaries to tag specific terms to mark as either negative or positive, with additional tags to ensure that different words do not confuse the program as it goes about its analysis. Contextual cues that merge lexical dictionaries, slang terms, and repeated training of the program would also greatly help in formulating proper markings of the terms to avoid confusion: long-winded posts can be reduced to positive or negative statements.
The offline environment (relationships, socioeconomic status, physical environment) can provide valuable clues to ascertain how and why users became diagnosed with medical conditions and whether there are discrepancies with their required regime to protect their health. The offline behavior can also provide clues to the progression of an outbreak of disease. Acquiring these answers can come in the form of analyzing the user’s other social media accounts, and their web search history when combined with their health records. This can help avoid methodological and policy errors in addition to gain a clearer understanding of the context of the posts [56].
Observing this data requires the users to generate content themselves, which can be frustrating since some networks can go for weeks (or even months) without anyone stating anything of importance that researchers need. Sometimes the users themselves may or may not be aware that they are being monitored. They may change their behavior, which can frustrate research since the information they write can be misleading for fear of privacy concerns. Users may be concerned with how their online and offline data will be used, despite most of their online data being available in a public website. Researchers can alleviate these fears by ensuring that patients understand the nature of the research and providing them the option of withdrawing from the study. Further, researchers can take steps to ensure the anonymity of the users.
result in either underestimating or overestimating the spread of diseases. This can lead to mistakes at the policy level that can negatively affect the public. Health care organizations should be aware that while consumer feedback from social media networks can be helpful, the digital divide should also encourage them to seek other sources to confirm that information derived from offline sources matches information from the social media networks. Privacy concerns can be countered by guaranteeing user anonymity except in emergency cases (if he/she poses a health threat to the community).
There are no federal guidelines (in the United States) for the use and management of social media data, particularly within the pharmaceutical industry and their interaction with consumers. The closest guidelines available are from the Food and Drug Administration stating how pharmaceutical companies should respond to requests of off-label uses of their products. The lack of clear guidelines can result in companies facing legal problems based on misuse of data by social media users, resulting in the pharmaceutical industry being more risk-averse about using social media instead of trying to understand its nature. A clear set of guidelines can motivate the industry to pursue a deeper understanding of social media and how it can use it both for the benefit of consumers and the industry. A deeper understanding that comes with clear guidelines will result in more refined methods that can enhance data collection and analysis, resulting in better policies and actions that can bring positive benefits to consumers, the industry, and policy leaders at the national and international levels.