Energy efficiency improvements
by renovation actions
in Lagersberg and Råbergstorp, Stoke on Trent
and Allingsås
Erik Dahlquist, Iana Vassileva, Javier Campillo & Lukas Lundström
ENERGY EFFICIENCY
IMPROVEMENTS BY
RENOVATION ACTIONS
in Lagersberg and Råbergstorp, Stoke on Trent
and Allingsås
Studies in Sustainable Technology inbjuder lärare
och forskare att publicera resultat från forsknings- och utvecklingsarbeten. Det kan exempelvis handla om teoretiska frågeställningar, genomförda experiment, rapportering från samverkans- eller samproduktions-projekt samt från externa uppdrag.
Skriftserien omfattar forskningsrapporter, arbets-rapporter och studentarbets-rapporter. Forskningsarbets-rapporter är på en högre vetenskaplig nivå och ska därför granskas av behörig forskningsledare eller professor. Arbetsrapporter kan t.ex. utgöras av beskrivningar av delförsök och utredningar som kan ligga till grund för kommande paper eller forskningsrapporter. Student-rapporter kan t.ex. utgöras av examensarbeten med extern uppdragsgivare. Arbets- och studentrapporter ska seminariebehandlas före publicering.
Manuskript lämnas till redaktören, som ombesörjer språkgranskning samt övergripande granskning och redigering inför publicering. Varje författare är dock själv ytterst ansvarig för skriftens vetenskapliga kvalitet.
Studies in Sustainable Technology invites teachers
and researchers to publish results from research and development work. It can e.g. concern theoretical topics, carried out experiments, reports from coope-ration or coproduction projects, or from external assignments.
The publication series includes research, work and student reports. Research reports are at a higher scientific level and should therefore be examined by a research director or professor within the study’s research field. Work reports may e.g. consist of descriptions of pilot studies, or studies as a basis for future papers and research reports. Student reports may e.g. consist of master theses for external principals. Work and student reports shall undergo a seminar prior to publication.
Report scripts are to be submitted to the editor for proofreading and a final reviewing and editing process before publication. The author, though, is solely responsible for the scientific quality of the report.
S
TUDIES IN
S
USTAINABLE
T
ECHNOLOGY
Research Report: 2016:1
Title: Energy efficiency improvements by renovation actions Subtitle: in Lagersberg and Råbergstorp, Stoke on Trent and Allingsås Project: The Social Contract (Samhällskontraktet), Sustainable Societal
Development (Hållbar samhällsutveckling)
Authors: Erik Dahlquist, Iana Vassileva, Javier Campillo & Lukas Lundström ORCID iD: 0000-0002-7233-6916, 0000-0001-5277-4567, 0000-0003-1001-2489,
0000-0003-3530-0209
Keywords: Smart cities, energy efficient cities, renovation, buildings
Language: English
Photographs: Erik Dahlquist, Iana Vassileva, Hans Eek
ISBN: 978-91-7485-243-1
PDF edition: http://urn.kb.se/resolve?urn=urn:nbn:se:mdh:diva-29467 Copy Editor: Mikael Gustafsson, mikael.gustafsson@mdh.se
Publisher: Mälardalen University
Print: Arkitektkopia AB
Mälardalens högskola
Akademin för ekonomi, samhälle och teknik Box 883
721 23 Västerås www.mdh.se
Mälardalen University
School of Business, Society and Engineering P.O. Box 883
SE-721 23 Västerås Sweden
www.mdh.se © Copyright Mälardalen University and the authors, 2016.
Energy efficiency improvements by renovation actions
Contents
LIST OF FIGURES ... 4 LIST OF TABLES ... 5 PREFACE... 7 ACKNOWLEDGEMENTS ... 8 ABSTRACT ... 91 INTRODUCTION OF THE PROJECT AND RELATED ACTIVITIES ... 11
1.1 Area description ... 11
2 BACKGROUND, AND THE RESEARCH GROUP’S PREVIOUS EXPERIENCE... 13
3 RESULTS FROM INFORMATION ACTIVITIES ON BEHAVIOR WITH RESPECT TO ENERGY USE ... 16
3.1 Advertising, increasing awareness, behavior aspects… ... 16
3.2 Electricity measurement units and consumption data ... 17
3.3 Energy saving strategies by information through displays ... 19
3.4 Consumption trends after saving measures ... 20
4 RENOVATION OF APARTMENTS AND RESULTS FROM ACTIONS ... 22
4.1 Lagersberg ... 22
4.2 Råbergstorp ... 23
4.3 Passive house renovation in Allingsås ... 26
4.4 Stoke on Trent ... 27
4.5 Comparison between the different renovation actions ... 28
5 OTHER MEASURES ASIDE OF BUILDING RENOVATION FOR ENERGY IMPROVEMENT ... 30
6 CONCLUSIONS ... 33
7 OTHER RESULTS AND PUBLICATIONS ... 35
Energy efficiency improvements by renovation actions
4 Erik Dahlquist, Iana Vassileva, Javier Campillo & Lukas Lundström
List of figures
Figure 1. Dashboard presenting electricity consumption and other type of information ... 18 Figure 2. Average monthly electricity consumption trends of households with average
consumption higher than 3,8 kWh/m2 ... 19
Figure 3. Average monthly consumption of apartments with high consumption... 21 Figure 4. After renovation with new surface coating and addition of 5 cm insulation
respectively, and the individual plantation for each family ... 23 Figure 5. Houses before painting (above) and while painting after refurbishing the cracked
plaster (below) ... 25 Figure 6. Brick wall at Brogården in Allingsås before the renovation, and as new insulation
elements were mounted ... 26 Figure 7. Renovation of houses in Stoke on Trent ... 27 Figure 8. Local sorting of waste, to enhance recovery and reuse of materials ... 30 Figure 9. Complementing a three wheeled electric bike with a coverage (student work at
MDH) ... 31 Figure 10.Crops and vegetables grown in the city (an example from Gothenburg) ... 32
Energy efficiency improvements by renovation actions
List of tables
Table 1. Main household groups locations, survey response rates and type of feedback provided. ... 13 Table 2. Specific energy use in kWh/m2, Atemp, before and after the renovation at Lagersberg,
Lagrådsgatan 10–12 ... 22 Table 3. District heating consumption as kWh/m2 in Råbergstorp building groups 202–207
... 24 Table 4. Investment costs and energy savings by renovations ... 28 Table 5. Pay-back time (PBT) as years respectively as a function of life expectancy of the
Energy efficiency improvements by renovation actions
Preface
This report is built on work performed in the The Social Contract’s Sustainable Societal Development program and PLEEC, EU FP7 Smart City project on Planning of energy efficient cities. We hope the material presented can be useful for cities when they plan both future renovation activities as well as other energy efficiency actions.
Västerås in March 2016.
Energy efficiency improvements by renovation actions
8 Erik Dahlquist, Iana Vassileva, Javier Campillo & Lukas Lundström
Acknowledgements
We thank the cities Eskilstuna and Västerås as well as the European Commision and Eskilstuna Energi & Miljö, Kommunfastighet, Pagoden/Victoria Park and Passive House Center in Allingsås for the very important support in the evaluations made.
Energy efficiency improvements by renovation actions
Abstract
This report covers evaluation of some renovation projects and compares energy saving effects versus renovation costs.
It can be seen that advanced renovation to passive house standard is significantly more expensive than “normal” renovation, but also gives significant improvement by a 62 % reduction of total energy and 85 % reduction in heat demand. The cost associated with the renovation is somewhere in the range of 130–570 €/m2, depending on how the total renovation
costs are split between energy and other aspects. Probably somewhere in-between is most correct. This can be compared to mostly better heat control by measuring temperature in every third apartment and controlling heat supply to keep a constant temperature. This gives the possibility to have a significantly lower set point, 21 ºC instead of 24 ºC as earlier. Together with some other actions, 34 % energy savings were achieved at a cost of 28 €/m2. Also
renovations with significantly more actions were evaluated, where the cost also is in-between. From this we can conclude that with more advanced and costly renovations we can achieve very strong reductions, which may be feasible if the renovation demand is high anyhow, while cheap and low cost actions can be good enough for quite good buildings.
Also behavior with respect to energy use was evaluated. We here can see that the use is very different in different apartments depending on behavior. Energy information actions were giving positive effects on energy demand for the majority of investigated tenants, while approximately 25 % did not reduce or even increased their consumption.
Energy efficiency improvements by renovation actions
1
Introduction of the project and related activities
The Social Contract (Samhällskontraktet) is an agreement on in-depth cooperation between the Municipality of Eskilstuna, Västerås City, the County Council of Sörmland, the County Council of Västmanland and Mälardalen University. An area of cooperation is Sustainable Societal Development (Hållbar samhällsutveckling), which is focused by addressing e.g. how to develop energy efficient living areas. In accordance to that focus, this study has been made to compare the cost versus effect of different energy improvement actions.
The project has been executed in close cooperation with the Planning of Energy Efficient Cities project (PLEEC). It is also an EU project with the focus on investigating of how energy efficiency improvements can be achieved in cities through technical actions. Examples of these are renovation of buildings, behavior change with respect to how the users use energy, and organizational aspects like how the cities make and implement energy efficiency improvement plans. Thus, this report covers the crossover between the two projects.
The project is addressing two main issues:
Changes in households’ ways of using energy and creating energy awareness; carrying out comparisons between different methods for changing behavior; and also gathering experience regarding the use of climate smart, technical solutions and other tools for energy savings. This also addresses social and cultural sustainability.
Comparing the result of different energy improvement activities performed by Kommunfastighet and Pagoden (now Victoria Park).
The project is connected to ongoing city development projects in Lagersberg, Råbergstorp and Stenby (LaRS) in Eskilstuna and Bäckby in Västerås.
1.1
Area description
The buildings located in the areas of Eskilstuna (Lagerberg, Stenby and Råbergstorp), from the so-called Million Programme, were built during 1964–1975 according to the political strategy to build one million households in ten years.
A total of 450 households live in the Lagersberg area, and the number is approximately the same in Råbergstorp and Stenby. The municipality (Eskilstuna kommun) together with the buildings’ owner (Eskilstuna Kommunfastigheter) have started projects in order to improve the area in different aspects, e.g. outdoor environment (parks and recreational areas, recycling, etc.) and building improvements (improved insulation, indoor changes, energy efficient windows, etc.). Focus on interactions between people living in the area has also being given:
Energy efficiency improvements by renovation actions
12 Erik Dahlquist, Iana Vassileva, Javier Campillo & Lukas Lundström
cooking related activities, different courses targeting the younger groups of the population, growing ecologic food, etc.
In Råbergstorp, Pagoden (acquired by Victoria Park in 2014) has been focusing on improvements of the buildings by increased temperature control in the apartments, improving the plaster by removing cracks and adding new plaster, but also by repainting the buildings with paint from Thermogaia (Thermogaia paint has not been compared to other types of paint in the project). Also the ventilation has been improved with heat pumps recovering heat from outgoing air in some of the buildings.
In Lagersberg, the refurbishment has been more advanced by adding 5 cm insulation to the outer shell, replacing two glass windows by either one extra glass or by upgrading to modern three-glass windows.
In Stenby, many of the houses are single apartments as detached houses. Here evaluation of actions has not been performed yet, but is planned for the future.
The main objective is to improve the areas and avoid the frequent situation of tenants moving out of the area to more attractive ones. The different improvements carried out or planned for the areas include different aspects, such as the refurbishment of the buildings (insulation, new windows, etc.) and the apartments’ indoor environment (new kitchen equipment, etc.). The common areas, such as parks and recreations areas, are also included in the plan for improvement.
This report describes activities, experiences and resulting energy efficiency improvements by measurement and behavioral changes, which is part of the Sustainable Societal Development program.
Energy efficiency improvements by renovation actions
2
Background, and the research group’s previous
experience
The research group has previous experience from projects targeting domestic energy consumption reduction (both in houses and apartments) through different measures (increasing awareness, different pricing schemes, and energy visualization).
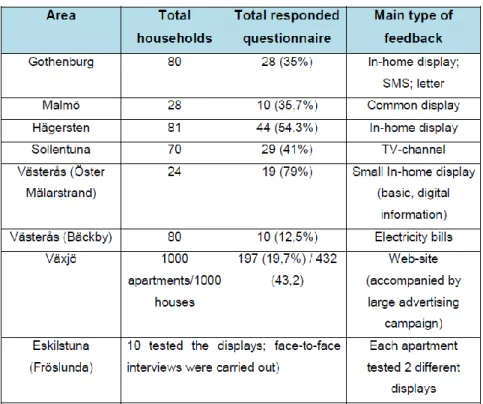
Table 1 includes the most relevant examples of household groups, the tools used for collecting information, response rates and the tools used for providing energy consumption feedback in each case. In general, so far the most common methods used to collect consumers’ information and estimate impacts on consumption trends, have been questionnaires (although even face-to-face interviews were carried out in some cases) and analysis of large sets of consumption data (from yearly to hourly intervals).
Table 1. Main household groups locations, survey response rates and type of feedback provided.
Energy efficiency improvements by renovation actions
14 Erik Dahlquist, Iana Vassileva, Javier Campillo & Lukas Lundström
The main conclusions from all these previous studies show a generally low interest among consumers living in low-income areas (e.g. Bäckby) regarding energy related issues, making the target group in Lagersberg susceptible to this problem.
The effectiveness of the different visualization methods was tested by analyzing energy consumption patterns before and after the installation of the tools. In the case of Växjö, all consumers were provided with a website showing current (daily) and past (previous months/years) consumption in different easy-to-follow graphic outlining, energy costs, outside temperature, and energy saving tips. A large advertising campaign accompanied the launching of the site, including newspapers, electricity bills, cinemas, etc. One of the main disadvantages found was the lack of disaggregated consumption for the different household appliances. Consumers that visited the website reached savings of 18 % in apartments, and 12 % in houses (Vassileva et al., 2012). Additionally, the savings in those households were continuously decreasing from year to year, with respect to the year before the introduction of the website. It is therefore important to collect consumption data for a several years period after the introduction of any kind of visualization feedback or energy awareness campaign.
In the case of Fröslunda (area close to Lagersberg), two different displays (the so called “engineers display”, developed by Mälardalen University, and the “Aware clock”, developed by the Interactive Institute) were tested simultaneously in the different households. Although the opinions and preferences varied, mainly based on the consumers’ age (generally, older people had difficulties to understand and to learn from them), the majority of consumers that tested the displays mainly appreciated the option where current consumption was shown in an easily comprehensible real-time fashion (Bartusch, 2008). This kind of display was used by the consumers to learn about the energy consumption of different appliances in the household. Some of the participants even decided to purchase new, more energy efficient appliances, due to the consumption level displayed. However, since no other information or data was provided, the consumers lost interest in the displays soon after learning their home appliances’ consumption.
It is important that prior to any campaign or strategy targeting energy efficiency, households’ energy consumption trends are analyzed in order to establish the saving potential (Vassileva et al., 2013). The implementation of an energy saving campaign/strategy might have the opposite effect when applied to households where consumption levels are already low.
This was one of the reasons used to explain the changes in consumption that occurred in Bäckby, Västerås (Vassileva, 2013). In that area of the city, consumption was reduced the first months after the implementation of the individual payment for electricity (which was included in the monthly rent until that moment), but started increasing in the months that followed (reaching consumption levels 20 % higher compared to previous periods). Consumers might have realized that their consumption is not very high and that it is economically affordable, and therefore decided to not make any effort towards energy savings.
The results from the common display in Malmö, showing the buildings’ hot water consumption, did not have the expected saving impact, which was explained by the fact that no other information was displayed to keep the consumers interested. If, for instance, traffic information and supermarket food-offers were included, it probably would have made the households to pay more attention to it. Also, displaying the hot water consumption of the whole building is not sufficient to catch the tenants’ attention to make them connect their activities to their own consumption (e.g. blaming the neighbors for the high consumption was the easiest solution many consumers were seeing) (Campillo et al., 2015).
On the other hand, studies show that one of the most successful ways of persuading people to reduce their energy consumption (and for a long-lasting period of time) is to compare it to
Energy efficiency improvements by renovation actions
their neighbors’, to more efficient homes in the area, or other comparisons besides displaying how much they have saved/increased.
In order to fulfill the previously mentioned recommendations, an essential part to be carried out before the development of an energy consumption feedback is to analyze the consumers’ preferences, or at least some of their characteristics. The age of the occupants, their income and energy related interest are some of the main determinants of how consumers prefer receiving feedback on their consumption (Vassileva et al., 2011).
Based on the results obtained in our previous research projects and results presented in the literature, the following described activities were carried out in the project.
Energy efficiency improvements by renovation actions
16 Erik Dahlquist, Iana Vassileva, Javier Campillo & Lukas Lundström
3
Results from information activities on behavior with
respect to energy use
3.1
Advertising, increasing awareness, behavior aspects…
The energy efficiency and related activities of the project have been advertised in different ways.
In the first stages of the project, about 40 of the households attended a meeting-workshop organized to discuss and present the main actions that would be carried out targeting the improvement of the area, buildings and indoor environment, and energy issues.
The attendees were divided voluntarily – according to their interests – into different groups depending on different topics (waste recycling, outdoor environment, household energy consumption, etc.). Each group discussed with one or more experts in the specific areas. The energy consumption group leaders were representatives from MDH (Iana Vassileva and Javier Campillo) and an energy advisor from Eskilstuna kommun. From the total, only three people decided to join that group. The main concerns the tenants had were regarding their bills (in the area electricity consumption used to be included in the rent).
In the beginning of 2013, the people living in Lagersberg were invited to a workshop where only energy topics were discussed (together with an energy advisor from Eskilstuna kommun). About 15 people attended and saving tips related to hot water and electricity were given to the attendees. A brochure with more specific information can be seen in Appendix I.
After the summer (in August, 2013), an advertisement offering the possibility to “borrow a researcher” from Mälardalen University, that would visit the interested households and help them save energy and money, was published in a few places accessible to the tenants. An example can be found published on the Eskilstuna kommunfastigheter’s website:
Låna en forskare – använd elen smart! Mälardalens Högskola forskar kring hur vi använder el i våra hem och just nu med fokus på Lagersberg. Vill Du testa om du kan sänka din elförbrukning med hjälp av en forskare? Passa på!
(http://www.kfast.se/TOPPMENY/Stadsdelsnytt/Lagersberg-2)
No responses were received from the target group, suggesting again the low personal interest in reducing energy consumption.
Energy efficiency improvements by renovation actions
3.2
Electricity measurement units and consumption data
One of the tasks carried out in relation to the “Planning for Energy Efficient Cities”, the FP7 project, was to perform a market research with the aim of finding the best electricity metering solutions that could be installed in the households to show detailed information about their consumption (disaggregated by the main consuming appliances). Based on the research and economic viability, one of the most suitable products suggested has the following characteristics:
Egauge is an electric energy and power meter that can measure up to 12 circuits on up to 3 phases (120V−480V, 50−60Hz) and provides web-access for remote monitoring and configuration.
Can measure up to 12 individual electric circuits, allowing the measurement of several appliances/group of appliances. Embedded web server, giving the possibility to follow the households’ consumption patterns remotely and prepare specific energy saving tips based on the analysis of the energy consumption values and daily activities.
Real time information (1 sample/sec) Integrated Datalogger
Historical data for 2 years+
Allows Mathematical Calculations to be performed directly on the device Allows for group meter monitoring
Can measure additional variables (e.g. temperature) (http://www.egauge.net/)
Other measuring devices were taken into consideration, e.g www.efergy.com. However, they did not offer remote and online access to the consumers’ real-time consumption. Some international companies were also contacted, e.g. http://www.esdgd.com, but they did not provide us with English instructions/characteristics of the product.
The Egauge electricity metering unit has been installed in several households (not located in Lagersberg) in order to use the data for creating different ways of visualization and also to learn more about everyday routines and daily use of appliances. The types of households that used the meter include apartments with district heating and houses with electric heating.
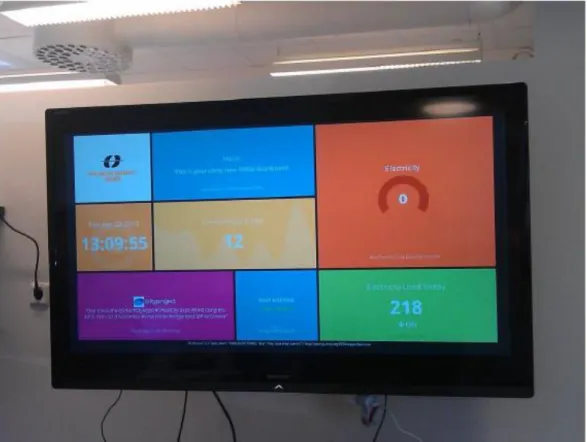
Results from previous research done at Mälardalen University regarding the best ways of providing energy consumption feedback (Campillo et al., 2015) and information allowed us to create as a proof of concept, an easy-to-understand dashboard connected to a large TV display where not only electricity consumption was displayed but also weather information, energy saving tips, etc. (see figure 1). The first functional prototype was presented to Kfast and while it was recognized as a valuable tool, security issues regarding the location of the equipment and acquisition cost arose and have limited its implementation for the moment.
Energy efficiency improvements by renovation actions
18 Erik Dahlquist, Iana Vassileva, Javier Campillo & Lukas Lundström
Figure 1. Dashboard presenting electricity consumption and other type of information
Photo: Iana Vassileva
To detect consumers with highest energy saving potential, historical electricity consumption data for all households in Lagersberg was collected from Eskilstuna Energi & Miljö. In order to do so, and due to privacy issues, the first step was to send out letters to all households asking the tenants for permission to use their data. Only three persons contacted us saying they did not want their data to be included in the study. The main reason for that was the fact that they were moving out of the area and could not therefore participate in the other project activities. Monthly electricity consumption data for the years 2011 and 2012 was collected, and thoroughly analyzed. Consumption trends were established for all households and the results were compared to average values for Swedish households. A total of 18 households with average yearly consumption values higher than 5 500 kWh/year were identified and therefore selected as the main target group for applying energy awareness campaigns and activities.
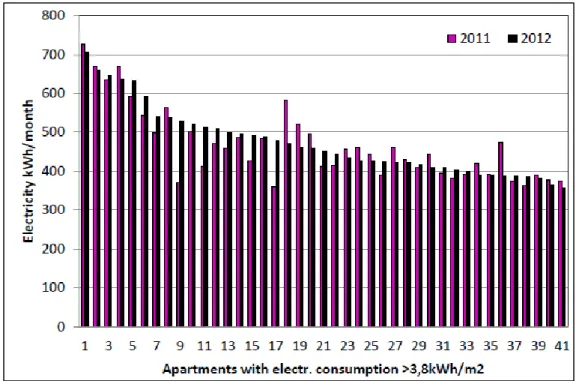
In order to determine the electricity consumption trends, the average monthly consumption of apartments with consumption higher than 3,8 kWh/m2 was analyzed and can be observed
Energy efficiency improvements by renovation actions
Figure 2. Average monthly electricity consumption trends of households with average consumption higher than 3,8 kWh/m2
From figure 2 it can be concluded that for most of the apartments, the consumption patterns follow the same tendencies for the two years period (2011 and 2012). This is an indicator that the high consumption levels reached by the consumers are a trend and not simply isolated events.
3.3
Energy saving strategies by information through displays
The consumers living in the Lagersbeg area are a challenging group, due to many factors including language barriers, lifestyles, very low income, etc.
Special brochures containing energy saving tips, with actions easy to implement, have been recently delivered to all households in Lagersberg, as part of the energy consumption awareness campaign carried out by the public housing Allmännyttan (http://www.allmannyttan.se/ energispartips-som-lista/).
However, in order to analyze the impact of such campaigns, the expected changes in the consumption patterns have to be evaluated. In the beginning of 2014, electricity consumption values for year 2013 will be requested from Eskilstuna Energi & Miljö and analyzed. In case no changes have been detected, future energy saving strategies could include, for instance, the use of “Energy Saving Kits”.
The "Energy Saving Kit" is considered as a tool to evaluate the actual impact on energy consumption reduction of adopting of simple technologies available for everyone, making them very suitable for the Lagersberg area, since one of the specific characteristics of the area is the low income of most of the population.
The idea of using such starter kits would be to evaluate if simple and low-cost technologies – like more efficient lighting, power bars, etc. – could achieve significant energy consumption reduction by the tenants so that the results can be recommended for future applications in
Energy efficiency improvements by renovation actions
20 Erik Dahlquist, Iana Vassileva, Javier Campillo & Lukas Lundström
similar areas. They could also constitute an important measure that utilities could include in their plans for improvement of company-customer relationships and/or could also deploy this type of campaign in a larger scale. Special focus should be paid on the high consumers where the energy savings potential is higher.
The "Energy Saving Kit" strategy has been used in other countries, some of the projects being:
http://www.earthtechling.com/2013/09/see-the-light-with-this-all-in-one-energy-efficiency-toolkit/
http://www.toolsofchange.com/en/case-studies/detail/7
Given the previous results that the research group have obtained in similar projects, a measurement evaluation was carried out in 2014 regarding the real impact of the awareness campaigns in the area of Lagersberg; together with other energy saving measures (e.g. building facilities improvement-insulation, etc.) in order to duplicate the most effective ones in other areas.
Currently, there is a plan under discussion to install monitors in the common areas of some of the buildings in Lagersberg (at the entrance of the buildings) that will display the electricity consumption per floor and compared to the other floors of the building, and also comparing the consumption levels to similar buildings/families. In that way the awareness of the consumers will probably increase and create a competitive spirit. Other types of information – such as traffic in the areas, bus schedule, and temperature etc. – will also be shown.
An improved design for presenting disaggregated consumption information (presenting the appliance-specific feedback) in the monthly bill sent to the consumers in the area is also currently under way.
3.4
Consumption trends after saving measures
By analyzing the changes occurred in the electricity consumption, it is possible to see the impact of the awareness measures. Changes that occurred in the district heating or hot water consumption are difficult to attribute to the awareness activities, since they could be attributed to the more energy efficient windows, thermostats, or to the solar thermal system installed in some of the buildings where these apartments are.
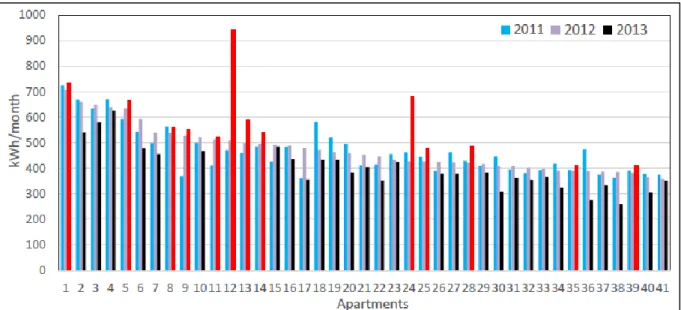
Therefore, one year after the measures carried out in the Lagersberg neighborhood, the electricity consumption of the 41 apartments was evaluated considering high consumers (figure 2), in order to find changes that might be caused by the awareness campaigns. Figure 3 presents the average monthly consumption for the 3-year period, being 2013 the year where changes in the consumption patterns were expected.
Energy efficiency improvements by renovation actions
Figure 3. Average monthly consumption of apartments with high consumption
From the 41 apartments, 13 increased their consumption in comparison to 2011–2012 levels (red bars). All the rest of the apartments reduced their consumption and this reduction could be explained by the general awareness created among the tenants.
However, the majority of the apartments that had the highest consumption during the period 2011–2012 were also the ones who increased their consumption during 2013.
Special focus should be paid to the tenants who maintained their electricity consumption high despite all measures, energy saving tips, etc.
Energy efficiency improvements by renovation actions
22 Erik Dahlquist, Iana Vassileva, Javier Campillo & Lukas Lundström
4
Renovation of apartments and results from actions
4.1
Lagersberg
During 2013, Kommunfastighet made major renovations of apartments in Lagersberg. The houses were renovated with 5 cm extra insulation added to the facade, extra insulation in the attic, addition of energy glass to about half of the windows and new energy efficient windows to the other half, the existing mechanical heat recovery ventilation system was improved, solar hot water panels, temperature control and metering of individual hot water consumption in each apartment, and plaster outside the extra insulation. The effect was predicted to 18 kWh/m2,y at Atemp. The cost for plastering was 665 kr/Atemp including scaffolding, insulation,
6.4 % development costs and VAT. Or put as cost per square meter facade: roughly 1 700 kr/m2. The cost for only insulation, excluding scaffolding and plastering, was about 60
kr/Atemp.
In table 2, we see the measured energy use for Lagersberg project phase 1 before renovation and the corresponding values after the renovation. The weather normalization and division of district heating into space heating, hot water consumption and hot water circulations losses were calculated with the energy signature method. For the two substations UC229 and UC232, with five apartment houses, the energy reduction as energy performance was from 168 to 98 kWh/Atemp, approximately 42 % (excluding household electricity).
Table 2. Specific energy use in kWh/m2, Atemp, before and after the
renovation at Lagersberg, Lagrådsgatan 10–12
Before renovation After renovation UC229 UC232 UC229 UC232
Hot water 31 33 30 16
Space heating 106 108 44 63
Building electricity 22 18 16 15
Household electricity 28 28 28 28
Total 187 187 118 122
There may be differences between different time periods, and by selecting different periods the outcome can give quite different results, as seen here.
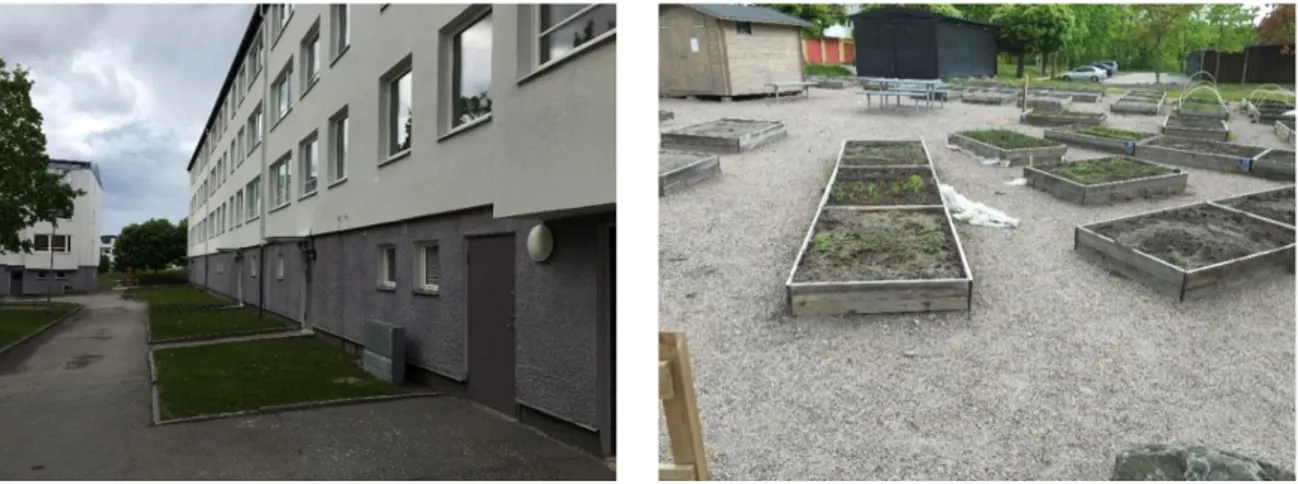
In figure 4, we see the buildings after renovation with new painting and with individual plantations for all tenants.
Energy efficiency improvements by renovation actions
Figure 4. After renovation with new surface coating and addition of 5 cm insulation respectively, and the individual plantation for each family
Photo: Erik Dahlquist
4.2
Råbergstorp
In the neighboring area Råbergstorp, similar houses as in Lagersberg have been renovated, but in a different way. Pagoden has buildings at several sites in Eskilstuna. There is a total of ca 3 500 apartments. In reality, the time after renovation is too short for long term evaluation, but at least we have one season available.
In 2010, Pagoden (later acquired by Victoria Park) started their renovations by adding fluffy glass wool in the attics. This gave a heat demand reduction by some 4–5 %. Thereafter temperature sensors were installed in each third apartment. The district heating system was refurbished so that the heat was distributed and measured for just a few houses, instead of the whole area as earlier. At the same time, the heat distribution was controlled for each house to keep the temperature at 21 ºC, compared to set point 24 ºC before. The variation of actions
between the different houses makes it difficult to clearly conclude the effect of automated temperature control (end of 2011–beginning of 2012) in comparison to other actions made, like refurbishing the plaster and repainting (202 in October 2014, 203–204 in June 2015). Still, due to measurements in each third apartment, the temperature control was improved and the decreased temperature gave significant energy savings. This was done for all buildings in Eskilstuna owned by Pagoden. Exhaust air heat pumps were installed in some buildings during 2012–2013.
Four of the houses in Råbergstorp (group 202, Domaregatan 12 (8, 10, 12, 14)) were renovated by refurbishing plaster and painting with Thermogaia paint in October 2013. The total number of apartments is 77 and the living area is 7 889 m2. Reference measurements have
been made since then. In summer 2014 (June–July) another two building groups (203 with 5 469 m2 living area and 204 with 5 882 m2 living area) were refurbished in the same manner.
The district heat consumption before and after these actions has been monitored and can be seen in table 3 below.
Energy efficiency improvements by renovation actions
24 Erik Dahlquist, Iana Vassileva, Javier Campillo & Lukas Lundström
Table 3. District heating consumption as kWh/m2
in Råbergstorp building groups 202–207
Difference 2012–2014 (%) Heating consumption (kWh/m2, year) Living area (m2) 2012 2013 2014 202 27,2 209 168 153 7 889 203 21,8 196 156 154 5 469 204 16,2 140 130 117 5 882 205 22,9 192 153 148 4 246 206 20,0 229 183 183 6 831 207 22,4 203 162 157 8 101
What we can see here is a significant reduction in energy consumption from 2012 to 2014, due to all different energy conservation measures. But it is not possible to separate the effects of different actions from each other. The change in district heating consumption after refurbishment of external walls is about a 14 % reduction in building group 202, while building group 203 shows a 14 % increase, and 204 shows a 2 % decrease. The effect from surface refurbishment is so small or non-existing that it is not possible to separate it, as the occurring variation between different buildings and periods are much larger. With higher resolution on consumption and indoor temperature data, it would be possible to separate between effects from temperature control, heat pumps and improved insulation levels of external walls. But such a small effect as 0–3 % that can be expected from drier walls, would not be detectable even with higher resolution.
Energy efficiency improvements by renovation actions
Figure 5. Houses before painting (above) and while painting after refurbishing the cracked plaster (below)
Photo: Erik Dahlquist
In a study in Botkyrka, houses also painted with acrylate paint were studied in parallel to Thermogaia paint (Kristiansson, 2014). A theoretical calculation of the effect of reduced moisture content in the light concrete wall should give an increased insulation effect of some 3 %.
In Molnar et al. (2014), an aerated concrete building in Gothenburg was investigated. A possible 3 % decrease in energy consumption was reported from drying out wet aerated concrete walls. These calculations where based on moisture measurements and simulation with WUFI. Exposed facades in Gothenburg (driving rain zone 4) are subjected to about 270 kg of driving rain per m2 facade and year. The sheltered buildings of Råbergstorp in Eskilstuna
(driving rain zone 2) can be expected to be exposed to about 100 kg/m2 per year (Elmarsson
& Nevander, 2008). The facades of the buildings in Råbergstorp were in bad condition before refurbishment, but as they are situated in driving rain zone 2 and sheltered a 3 % decrease in energy consumption, it can be seen as a maximum of energy savings potential from drying out wet walls. Most likely, the energy savings from refurbishing the facades are less than 3 %, and the contribution from Thermogaia painting is non-existing or so small that it is irrelevant. But it shows how difficult evaluations can be, since some houses show high savings while others increased their consumption! On the other hand, we should remember that the paint is giving a nice surface, which is important from a renovation perspective!
The cost for the actions by Pagoden has been approximately 2 300 kr/apartment for the increased control including temperature sensors installed in 1 000 out of 3 500 apartments – which means ca 30 kr/m2 living area. To this comes ca 2 Mkr for the four houses painted, with
7 889 m2 living area and ca 3 000 m2 wall area excl. windows. This gives ca 433 kr/m2 wall area
Energy efficiency improvements by renovation actions
26 Erik Dahlquist, Iana Vassileva, Javier Campillo & Lukas Lundström
in the cost: washing, mechanical removing of lose plaster, filling in cracks and adding plaster to replace lose plaster, painting with primer and two layers of Thermogaia paint.
Pagoden was sold to Victoria Park, who took over the operations from January 2015. We will proceed following the energy saving actions in the buildings.
4.3
Passive house renovation in Allingsås
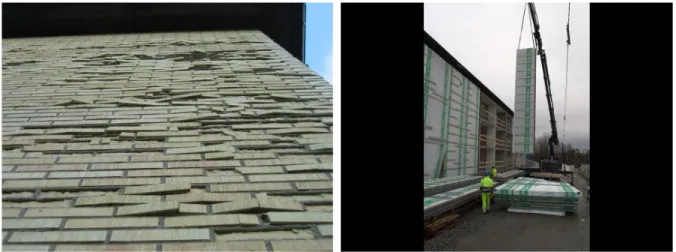
In Allingsås, a city on the Swedish west coast, houses from the 1950–60s were renovated to passive house standard. This included adding 45 cm insulation and enhancement to three glass windows with argon between two glasses, and also a thin silver layer. The U-value then increased from 1.2 to 0.8 compared to “normal” three glass windows. Some of the houses also were renovated by removing all previous surface material and putting up 3-storage elements with insulation (45 cm). Windows and ventilation channels were mounted with high precision as pre-prepared elements, which reduced the renovation time from 9 months to 4 months.
The ventilation has also new heat exchangers, giving 88 % heat recovery compared to “normal standard” 80 %. Due to this, the heat supply to the houses is very minor and all through the ventilation air. By not needing the normal heat distribution system, savings in installation cost were some 2 000 € per apartment. In return, good precision was demanded in mounting the wall elements with the ventilation channels. In figure 6 we see the brick wall before the total renovation.
Figure 6. Brick wall at Brogården in Allingsås before the renovation, and as new insulation elements were mounted
Photo: Hans Eek
The houses have been given handicap adaptation, meaning elevators. The garden was refreshed, waste management improved, new washing machines were installed, stairs and entrances were renovated, and some other actions were also performed. Altogether the cost was some 120 000 € per apartment, but only approximately 10 000 €/apartment was due to the improvements in the energy shell. This according to Hans Eek, architect for the area and technical leader for Allingsås Passive House Center.
In the last houses renovated, the insulation was decreased to 30 cm cellular plastic of polystyrene but with graphite inclusion, which reduces radiation between cell elements in the sheet. Each element is, as mentioned, three stores high (some 10 meters) while 2–2.5 m wide. The sizes are slightly different as the houses were having different dimensions. Each apartment
Energy efficiency improvements by renovation actions
has a 75 m2 living area. The heat demand per apartment has decreased from 116 to 19 kWh/m2
per year. For the total household, household electricity + heat and hotwater demand was reduced from 220 to 86 kWh/m2 per year after the renovation, according to the first
preliminary figures. Like Lagersberg and Råbergstorp, the renovations were done during the last few years.
In comparison, the normal building cost for a completely new building today is approximately 200 000 € for an apartment of this size, i.e. some 75 m2. The renovation cost
was as mentioned 120 000 €, from which some 10 000 € were related to the improved energy shell. This gives a pay-back time for the energy savings alone of slightly less than 10 years, according to Hans Eek’s calculations.
4.4
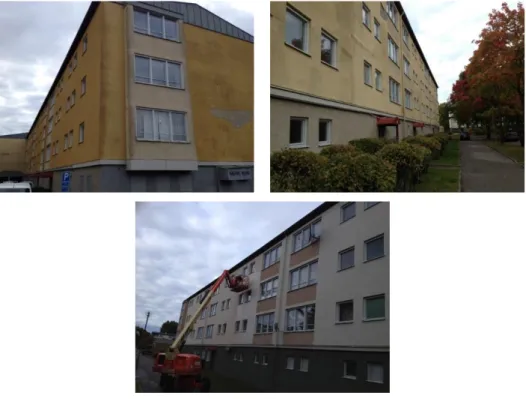
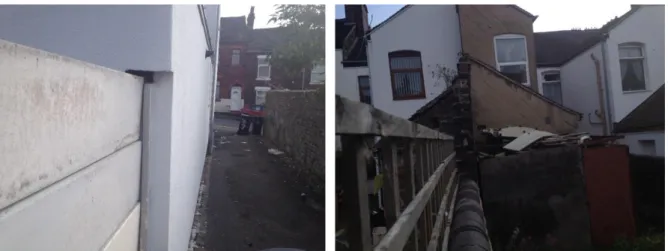
Stoke on Trent
In Stoke on Trent, many houses with two apartments in each have been retrofitted. The driving force for the investments is to reduce CO2 emission where governmental funds are available
to support. Stoke on Trent city apartments are around 24 000. First priority has been to enhance houses with cavity walls, which are filled with plastic ”bubbles” to enhance insulation. The cavity can be from a few centimeters up to more than 10 cm. For houses with single brick walls, 90 mm EPS plastic insulation is added and with a plaster cover (see figure 8). Also, windows are replaced by three glasses. The cost for this is some 8 000–10 000 £/apartment. 70 % of the cost is for the extra insulation. The area of each apartment is approximately 78– 85 m2, so the cost is 120–140 €/m2. The goal is to save more than 50 % energy, but we have
no data on real effect yet.
Figure 7. Renovation of houses in Stoke on Trent
Photo: Erik Dahlquist
For older houses, sometimes there is insulation on the inside to give a nice facade towards the street, while on the outside towards the back of the house. On a number of houses also 6–8 solar PV panels (1.8 kW) have been installed to supply house-hold electricity and for surplus distribution to the grid. Originally at a price of 43 c/kWh, but since then it has decreased to 13 c/kWh, as so many PV systems have been installed. Each household could choose if they wanted to participate in the renovation or not. Thus, we could have a situation like in figure 8, where two houses were improved but one household in-between was not.
Energy efficiency improvements by renovation actions
28 Erik Dahlquist, Iana Vassileva, Javier Campillo & Lukas Lundström
4.5
Comparison between the different renovation actions
As have been pointed out several times, the figures for the energy savings still are quite preliminary as it is just a little more than one year since the renovation. Moreover, by measuring several years, different factors will level out. For the costs, we have tried to include only direct energy affecting expenses. In passive house calculations, there are no costs for outer finishing included, while these are in reality included for Lagersberg and Råbergstorp.
From the data in table 4, we can see that the cost for different renovation actions can be quite different in relation to the effect. E.g. increased control of the temperature can save quite a lot of energy to a relatively low cost, while accepting a lower indoor temperature as long as the tenants feel comfortable. If we can find that temperature level, the “over shoot” in temperature can be avoided and instead we could constantly keep a temperature like 20 or 21 ºC, thereby saving energy. Without temperature control, the temperature was varying between 18–29 ºC, depending on out-door conditions. The problem with poor control is that we set a higher overall goal temperature, e.g. 24 ºC, just in case to be sure that the coldest apartment still will not have below 20–21 ºC – leading to some other apartments becoming too hot.
Another measure is to avoid leakage of air through “open channels” (like around windows) or conduction through “cold bridges” (like areas with poor insulation or bad constructions). In table 4 we have tried to calculate costs as €/m2 living area.
Table 4. Investment costs and energy savings by renovations
Area Investment (€/m2) (kWh/mSavings 2,y) Allingsås, passive house standard 133–570 62–85% Lagersberg, advanced renovation 65 56,5% Råbergstorp, control + paint 28 34% Stoke on Trent 130 56%
For the Brogården project in Allingsås, the figure 133 €/m2 is according to Hans Eek, while
the figure 570 €/m2 is given in the report by Karin Byman and Sara Jernelius (2012). For Stoke
on Trent, the renovation cost 120–140 €/m2 is of the same order of magnitude as in Allingsås,
while savings in the same range as in Lagersberg, according to the cost figures we have. If we look at what pay-back time we would get – assuming we start with 200 kWh/m2,y and
the energy cost 0.05 and 0.07 €/kWh respectively – in relation to probable life expectancy of the action made, we will get figures like in table 5.
Energy efficiency improvements by renovation actions
Table 5. Pay-back time (PBT) as years respectively as a function of life expectancy of the action made
Energy cost 0.05 and 0.07 €/kWh respectively have been assumed
Area Saved energy
(kWh/m2,y) Saved costs (€/m2,y) (years) PBT Life expectancy (years) expectancy PBT/life
0.05 0.07 0.05 0.07 0.05 0.07 Allingsås 1 168 8.4 11.8 15.8 11.3 50 32% 23% Allingsås 2 168 8.4 11.8 68 48 50 136% 96% Lagersberg 113 5.7 7.9 11.5 8.2 30 38% 27% Råbergstorp 68 3.4 4.8 8.2 5.8 20 41% 29% Stoke on Trent 112 5.6 7.8 23 16.7 30 77% 56%
For Allingsås we have made two alternatives, depending on the different cost figures we have got from different evaluators, including different costs as being energy related. From the table we can see that if the buildings have very poor standard and need a total renovation, it may still be economic as the life expectancy of the renovation will be long and demand a high capital investment. If we do not need more than a minor renovation, the type made in Råbergstorp may be enough, thus quite a small capital investment and easy to recover without needing to increase the monthly rent, as the pay-back time is quite short. By mapping the apartments and buildings after present standard, the renovation need can be grouped and a renovation plan made, where the capital available can be used in an efficient way. Every year, some minor renovations can be made in parallel to heavy renovations for some of the buildings in need of it.
Energy efficiency improvements by renovation actions
30 Erik Dahlquist, Iana Vassileva, Javier Campillo & Lukas Lundström
5
Other measures aside of building renovation for
energy improvement
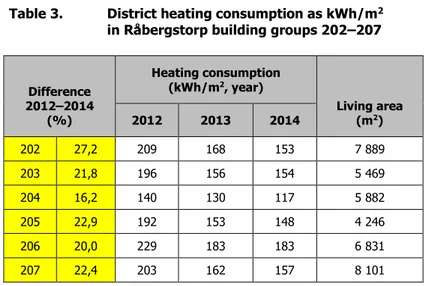
We have also looked somewhat into other aspects like transportation, waste management and local production of electric power. Also local production of vegetables and other crops is interesting to introduce, as it gives a more living environment. Concerning transportation, there is a potential for affordable electric vehicles, as well as how to open up building areas. Waste sorting in different ways is also important for a sustainable city. Figures 8–10 represent examples of practices targeting the citizens’ participation and awareness.
Figure 8. Local sorting of waste, to enhance recovery and reuse of materials
Photo: Erik Dahlquist
In a sustainable society we need to recycle and reuse as much material as possible, since resources are limited and therefore crucially important for future generations. In figure 8, we see waste separation in apartment areas, where different types of waste are sorted into different vessels, which are then sent to recycling. This is now very common in most Swedish cities, and more than 99 % of the waste was principally recycled or reused in Sweden 2013. An activity
Energy efficiency improvements by renovation actions
that can be performed in local building areas is to discuss how to sort different types of waste to get cleaner fractions.
Figure 9. Complementing a three wheeled electric bike with a coverage (student work at MDH)
Photo: Erik Dahlquist
In figure 9, we see how students at MDH are covering an electric three wheeled bike with a combined plexi-glass and soft plastic cover, to protect the driver from rain and snow. It has a Lithium-ion battery, principally lasting for a 40 km ride, whereafter the pedals may be used, making it a hybrid bike. The battery can easily be brought inside the apartment for charging, and the weight is only approximately two kg. The total cost is in the range of 9 000–15 000 kr for the bike, the coverage included.
Energy efficiency improvements by renovation actions
32 Erik Dahlquist, Iana Vassileva, Javier Campillo & Lukas Lundström
Figure 10. Crops and vegetables grown in the city (an example from Gothenburg)
Photo: Erik Dahlquist
Figure 10 shows an example from growing crops in the city. By doing this, young people can get an understanding about how we produce food, which has to some extent been forgotten as most people now are living in cities. This can give opportunities for common activities strengthening the relation between neighbors and generations, which is important from a social perspective.
Energy efficiency improvements by renovation actions
6
Conclusions
Buildings with uneven and high indoor temperatures can save a significant amount of energy by improved temperature control, as this allows for lower average indoor temperatures. And this to a relatively small investment cost. To further improve buildings energy performance, investment heavy measures like insulation of external walls, new windows and heat recovery ventilation need to be realized. Earlier studies have shown that Aerated concrete buildings can achieve small additional energy savings from drying out wet facades by additional insulation. It is very unlikely to achieve a similar affect by just painting the walls with products like Thermogaia. The possible effect is too small to be significantly detectable from monthly metered data. The product should be tested under controlled circumstances.
Concerning information activities and the effect of these, we can see that different people react differently. In some cases the effect is significant to reduce energy use, but in other cases the effect seems to be even the opposite, or at least not giving a reduction.
Still the passive house’s extra cost is relatively small in relation to the overall renovation cost, and with a life time perspective it should be economic as energy is saved long term. Something that has not been addressed, as far as we know, is the risks associated with possible fires if using large amounts of PUR-plastic for the insulation. What happens with channels inside the insulation if hot gases are passed through from a fire? Even Rockwool, mineral based insulation, may cause unexpected problems if hot gases are passed from one apartment to another. The control system should include special precautions for this.
From the data presented, by measuring monthly heat and hot water consumption before and after different actions, we can see significant deviations from one house to another, and also from one month to another. These differences can be related to different behavior, like using hot water differently, or that some people open windows and thereby increase heat demand. Another cause can be poor control. In one case, the heat pumps were running when it was 25 ºC outdoors, because the heat pump supplier said the heat pumps would suffer if they were stopped. In other cases, the measurements can be unreliable due to drift in sensors. Losses in supply pipes are sometimes included on the bill, sometimes not (depending on where measurement is done). At some position in relation to the improvement of controlling temperature by measuring in every third apartment, the meters also were moved closer to the actual buildings, and it is not clear how much of the reduced heat that was due to not measuring losses up-front after this. Data available can possibly also be used for e.g. on-line monitoring of the performance of substations. If we measure the heat consumption as a function of out-door temperature, it should be possible to get a separation between heat-demand for space heating compared to other factors. From this, different type of actions may be proposed – both technical and behavior ones.
Energy efficiency improvements by renovation actions
34 Erik Dahlquist, Iana Vassileva, Javier Campillo & Lukas Lundström
From a planning perspective, it should thus be proposed that a city or real estate owner should make an overall long term plan for their buildings. Some buildings have a relatively good standard and there is district heating installed. Then one of the simpler renovations may be the best for all parts. On one hand, buildings with a need for total renovation should probably benefit from applying “passive house standard”, as the additional cost is not so significant in relation to the overall cost. On the other hand, this will give a strong effect on the benefits of having district heating and possibly this needs a supply at lower temperature to be economic, as the demand is low and the losses otherwise too high. For the PLEEC project it should be interesting to make a plan where different areas are characterized with respect to standard and need for overall renovation, and calculations made with respect to total energy demand as well as a split between heat and electric power.
For sensitive buildings, from a cultural heritage perspective, some of the renovation methods can be utilized, such as increased temperature control, while others are not possible, such as adding an extra insulation layer on the outside.
It would be interesting to study more personal information about how energy use could be reduced to those consuming most energy.
It also is needed more long term follow-ups of procedures for energy reduction actions. If relatively simple and cheap actions can be as good as more expensive, it is very important for the building operators and tenants, as costs are transferred to the latter in one way or another.
Energy efficiency improvements by renovation actions
7
Other results and publications
Campillo, J., Dahlquist, E., & Späth, R. (2015). Smart Homes as Integrated Living Environments. In Yan, J. (Ed.) Handbook of Clean Energy Systems: Volume 4 - Intelligent Energy Systems. John Wiley & Sons. ISBN: 9781118991978.
Campillo J., Vassileva, I., Dahlquist, E., Lundström, L., & Thygesen, R (2015). Building Renovations and Distributed Generation for Sustainable Urban Planning: Implications for Future Energy Distribution Networks. Submitted to Journal of Settlements and Spatial Planning, http://jssp.reviste.ubbcluj.ro, Nov. 2015.
Campillo J, Dahlquist, E., & Vassileva, I. (2015). Technology capacity assessment tool for developing city action plans to increase energy efficiency in mid-sized cities in Europe. Paper ID: CUE2015-153. Low
carbon Cities and urban energy systems, CUE 2015, Nov. 15–17, 2015, Fuzhou, China.
Dahlquist, E., Campillo J., Vassileva I., & Lundström, L. (2016). Energy efficiency improvements by renovation
actions : in Lagersberg and Råbergstorp, Stoke on Trent and Allingsås. SiST research report 2016:1, Mälardalen
University. ISBN: 978-91-7485-243-1.
Dahlquist, E., & Fell, T. (2015). Smart cities. In Yan, J. (Ed.) Handbook of Clean Energy Systems: Volume 4 -
Intelligent Energy Systems. John Wiley & Sons. ISBN: 9781118991978.
Dahlquist, E., & Wallin, F. (2015). Energy efficiency of municipal energy systems – An introduction. In Yan, J. (Ed.) Handbook of Clean Energy Systems: Volume 4 - Intelligent Energy Systems. John Wiley & Sons. ISBN: 9781118991978.
Vassileva, I., & Campillo, J. (2014). Eskilstuna (Sweden) as an example of a smart city from an energy efficiency perspective. (Panel speaker) World Renewable Energy Congress; London, UK, August 2014. Vassileva, I., & Campillo, J. (2014). Increasing energy efficiency in low-income households through targeting
awareness and behavioral change. Renewable Energy, 67, pp. 59–63.
Vassileva, I., Dalquist, E., & Campillo, J. (2014). Increasing energy efficiency in low-income Swedish households through targeting awareness and behavior. Research paper presented in the World Renewable
Energy Congress, Perth, Australia; 14–18 July, 2014. The paper includes results from different low-income
households in Sweden and their similarities and differences when it comes to behavior, preferences and consumption patterns.
Vassileva, I., Dahlquist, E., & Campillo, J. (2015). The citizens role in energy smart city development. Low
carbon Cities and urban energy systems, CUE 2015, Nov. 15–17, 2015, Fuzhou, China.
Vassileva, I., Thygesen, R., Campillo, J., & Schwede, S. (2015). From goals to action: the efforts for increasing energy efficiency and integration of renewable sources in Eskilstuna, Sweden. Resources, 4, pp. 548–565. doi:10.3390/resources4030548.
Energy efficiency improvements by renovation actions
36 Erik Dahlquist, Iana Vassileva, Javier Campillo & Lukas Lundström
References
Bartusch, C. (2008). Visualisering av elanvändning i flerbostadshus. Delrapport inom ELAN Etapp III. Elforsk report 08:18.
Byman, K., & Jernelius, S. (2012). Economy at renovations including energy improvements. Ekonomi vid ombyggnader
med energisatsningar. Final report. ÅF Infrastructure AB.
Campillo, J., Dahlquist, E., & Vassileva, I. (To be published 2016). Building Renovation and Retrofitting Actions for Improving Energy Efficiency and Attractiveness of Old City Areas. Journal of Settlements
and Spatial Planning.
Eek, H. (2015). Oral information about Brogården project, Passive House Center in Allingsås.
Elmarsson, B., & Nevander, L.E. (2009). Fukthandbok. Praktik och teori (3rd ed.). Mölnlycke: Svensk Byggtjänst.
Kristiansson, J. (2014). Uppföljning av energianvändning och fuktkvot efter fasadmålning med Termoskydd. Branta
Backen 7–15 och 17–29, Storvreten. ÅF report.
Levin, P., & Karlsson, C. (2015). Demonstrationsprojekt för energieffektivisering i befintliga flerbostadshus. Slutrapport
för Lagersbergs renoveringsetapp 1. The Rekorderlig Renovering project. Kommunfastigheter in Eskilstuna
and BeBo.
Molnar, M., Jönsson, J., Sandin, K., & Capener, C. (2013). Energieffektivisering av miljonprogrammets flerbostadshus
genom beständiga tilläggsisoleringssystem. Slutrapport 2013. Report TVBK-3064. Lunds University, Division
of Structural Engineering. Lund.
Vassileva, I. (2013). Characterization of household energy consumption in Sweden. Energy savings potential and feedback
approaches. Dissertations No. 129, Mälardalen University. ISBN: 978-91-7485-077-2.
Vassileva, I., Dahlquist, E., Wallin, F., & Campillo, J. (2013). Energy consumption feedback devices’ impact evaluation on energy use. Applied Energy, 106, pp. 314–320.
Vassileva, I., Odlare, M., Wallin, F., & Dahlquist, E. (2012). The impact of consumers’ feedback preferences on domestic electricity consumption. Applied Energy, 93, pp. 575–582.
Vassileva, I., Wallin, F., Ding, Y., Beigl, M., & Dahlquist, E. (2011). Household indicators for developing innovative feedback technologies. In proceedings of the Innovative Smart Grid technologies Europe; 2011, IEE
PES International Conference and Exhibition on Innovative Smart Grid Technologies – Europe, pp. 1–7. Doi:
Energy efficiency improvements by renovation actions
Studies in Sustainable Technology vid Mälardalens högskola
Förteckningen nedan tar upp rapporter som har publicerats inom ramen för skriftserien Studies in Sustainable Technology (SiST).
Studies in Sustainable Technology at Mälardalen University
In the list below are the reports that have been published in the series of publications called Studies in Sustainable Technology (SiST). ___________________
2016:1 Dahlquist, E., Vassileva, I., Campillo, J. & Lundström, L. Energy efficiency improvements by
renovation actions: in Lagersberg and Råbergstorp, Stoke on Trent and Allingsås.
Forskningsrapport/Research report. Språk/Language: engelska/English.
2014:4 Zakirov, A. & Zakirov, T. Fire risk assessment of a single-exit metro station: Evacuation, fire and rescue
perspective. Studentrapport/Student report. Språk/Language: engelska/English.
2014:3 Kumm, M., Palmkvist, K. & Palm, A. Värmekamera vid brand under mark: Ett utbildningsmaterial
för räddningstjänsten. Arbetsrapport/Work report. Språk/Language: svenska/Swedish.
2014:2 Palm, A. Taktik och ledning vid brand i undermarksanläggningar: Analys av fullskaleförsök och tre
verkliga händelser. Forskninsgrapport/Research report. Språk/Language: svenska/Swedish.
2014:1 Kumm, M., Palm, A., Palmkvist, K. & Ingason, H. Räddningsinsats i tunnelmiljö: Fullskaleförsök i
Tistbrottet, Sala. Forskningsrapport/Research report. Språk/Language: svenska/Swedish.
2013:5 Kumm, M., Lönnermark, A. & Zakirov, A. Indikatorer för att bedöma räddningstjänstens
insatsförmåga: – med hänsyn till de lokala förhållandena. Arbetsrapport/Work report.
Språk/Language: svenska/Swedish.
2013:4 Kumm, M. Räddningsinsatser i kärntekniska anläggningar under mark: En kunskapsöversikt inför
byggandet av ett svenskt slutförvar för kärnbränsle. Arbetsrapport/Work report. Språk/Language:
svenska/Swedish.
2013:3 Hansen, R. Investigation on fire causes and fire behaviour: Vehicle fires in underground mines in Sweden
1988–2010. Arbetsrapport/Work report. Projekt/Project: BARBARA. Språk/Language:
engelska/English.
2013:2 Hansen, R. & Ingason, H. Full-scale fire experiments with mining vehicles in an underground mine. Forskningsrapport/Research report. Projekt/Project: BARBARA. Språk/Language: engelska/English.
2013:1 Kumm, M., Lönnermark, A. & Palmkvist, K. Användande av mobila fläktar vid bränder i tunnlar:
En sammanställning av försök och erfarenheter 2002 till 2013. Forskningsrapport/Research report.
Projekt/Project: METRO. Språk/Language: svenska/Swedish. (Work in progress.) 2012:9 Andersson, A. & Carlson, E-S. Structures in underground facilities: Analysis of a concrete column’s
capacity to withstand extraordinary fire loads. Studentrapport/Student report. Projekt/Project:
METRO. Språk/Language: engelska/English.
2012:8 Ingason, H., Kumm, M., Nilsson, D. et al. The METRO project. Final report. Forskningsrapport/Research report. Projekt/Project: METRO. Språk/Language: engelska/English.
Energy efficiency improvements by renovation actions
38 Erik Dahlquist, Iana Vassileva, Javier Campillo & Lukas Lundström
2012:7 Kumm, M. & Palm, A. Technical equipment as tactic resources at fires in mass transport systems. Arbetsrapport/Work report. Projekt/Project: METRO. Språk/Language: engelska/English. (Work in progress.)
2012:6 Meyer, G. & Berglund, R. Hazard of broken commuter train windows due to explosion: Window
explosion tests within the METRO project. Forskningsrapport/Research report. Projekt/Project:
METRO. Språk/Language: engelska/English.
2012:5 Åkerstedt, R. & Kumm, M. Learning from incidents and accidents in mass transport stystems: A study
of learning processes in the Stocholm metro. Arbetsrapport/Work report. Projekt/Project: METRO.
Språk/Language: engelska/English. (Work in progress.)
2012:4 Nyman, H. & Meyer, G. METRO – WP4: CFD-simulations of a single exit underground station. Forskningsrapport/Research report. Projekt/Project: METRO. Språk/Language: engelska/English.
2012:3 Kumm, M. & Palm, A. Fire and rescue services moving speed in mass transport systems. Forskningsrapport/Research report. Projekt/Project: METRO. Språk/Language: engelska/English. (Work in progress.)
2012:2 Kumm, M. & Palm, A. Full scale tests in the Brunsberg tunnel from a fire and rescue perspective. Forskningsrapport/Research report. Projekt/Project: METRO. Språk/Language: engelska/English. (Work in progress.)
2012:1 Meyer, G., Berglund, R., Lönnermark, A. & Kumm, M. Full scale commuter train explosion tests. Forskningsrapport/Research report. Projekt/Project: METRO. Språk/Language:
engelska/English. (Work in progress.)
2011:3 Bartusch, C. Visualisering av elanvändning i flerbostadshus: Slutrapport inom ELAN Etapp III. Forskningsrapport/Research report. Språk/Language: svenska/Swedish.
2011:2 Bartusch, C. Visualisering av elanvändning i flerbostadshus: Delrapport inom ELAN Etapp III. Forskningsrapport/Research Report. Språk/Language: svenska/Swedish.
2011:1 Meyer, G. & Janzon, B. Fire and explosion tests in underground structures: A literature review of
performed tests and an introduction to common modelling in finite element codes.
Forskningsrapport/Research report. Projekt/Project: METRO. Språk/Language: engelska/English.
2010:11 Kumm, M. Rescue Operations during Construction of Tunnels: A study of the fire rescue services
possibilities and their inter-action with the tunnel constructor. Forskningsrapport/Research report.
Projekt/Project: Tunnelbyggaren. Språk/Language: engelska och svenska/English and Swedish.
2010:10 Kumm, M. Rekommendationer gällande brand och utrymning i besöksgruvor. Forsknings-rapport/Research report. Projekt/Project: Gruvan. Språk/Language: svenska/Swedish. 2010:9 Hansen, R. Final recommendations – GRUVAN project. Forskningsrapport/Research report.
Projekt/Project: Gruvan. Språk/Language: engelska/English.
2010:8 Hansen, R. & Ingason, H. Model scale fire experiments in a model tunnel with wooden pallets at varying
distances. Forskningsrapport/Research report. Projekt/Project: Gruvan. Språk/Language: