ISSN 0347-6049
V'I/meddelande
669A 1992
Classification of road surfaces with respect to traffic noise by using the trailer method
Jerzy A. Ejfsmont
Technical University of Gdansk
Vag-och Traffik Statens vag- och trafikinstitut (VTI) * 581 01 LinkGping swedish Road and Traffic Research institute * $-581 01 Linkoping Sweden
ISSIV 0347-5049
V meddelande
A
1992
Classi cation of road surfaces with respect to
traffic noise by using the trailer method
Jerzy A. Ejsmont
Technical University of Gdan sk
f, Statens vég- och trafikinstitut {VT/l ° 581 07 Linkdping Swedish Road and Traffic Research Institute 0 8-587 01 Linkb ping Sweden
Publisher? Publication: VTI MEDDELANDE 669A Published: Project code:
_ 1992 52338-1
WIS]! and . Project:
' affic esearclrlnstrwte
Measuring method for comparison of traf c
Swedish Road and Traffic Research Institute 0 3-581 01 Linkb ping Sweden noise on different road surfaces
Author: Sponsor:
Jerzy A. Ejsmont Swedish Road and Traf c Research Institute Swedish National Road Administration
Tit/e:
Classi cation ofroad surfaces with respect to traf c noise by using the trailer method
Abstract (ba ckground,aims, methods, results) max 200 words:
In order to limit road traf c noise it is necessary to reduce all major sources of this noise. Up to now, all noise emission limits have been based on procedures where the vehicles accelerate from a low speed. This method highlights the noise emitted from the power-train units ofthe vehicles. To obtain any further noise reduction it is necessary to introduce also limits for tire/road noise and noise in uences by road surfaces (simply speaking to eliminate tires and surfaces which are excessively noisy). As an important step in this direction, there is a work item of the Intemational Organisation for Standardisation (ISO) which is focused on measurement methods for comparison ofnoise on different road surfaces. One of the methods considered by the group working on this subject is the trailer method which is reviewed in this report
Nine trailers used for tire/road noise measurements havebeen reveiwed. Two ofthem have been used for testing of truck tires and the remaining seven have been intended for passenger car tires. All of them would be possible to use also for testing road surfaces. The review includes the most important technical data ofthe trailers as well as the microphone positions used during the measurements.
One of the most important factors that must be considered before the trailer method can be recommended for evaluation of the road surface in uence on traf c noise is its relation to other measuring methods, especially to the statistical pass-by method. In the latter method, peak pass-by levels of vehicles in actual traf c are recorded together with data about vehicle type and speed, the results of which are then averaged to obtain noise levels typical of each vehicle type and speed. This method is probably the closest one can come to actual road-side listening conditions.
The comparison of the results presented in the report shows that the trailer method correlates well with the statistical pass-by method ifdrainage pavements are excluded. If drainage pavements are included then the trailer method underestimates their noise reduction in comparison to the pass-by method. However, iftires for use with the trailer method are selectd in an appropriate way, then the underestimations have a systematic character, so it is probably possible to correct the results to some degree.
Keywords:
ISSN: Language: No. of pages: 62
PREFACE
The author of this report is Dr. Jerzy A. Ejsmont from the Technical University of Gdansk, Poland. It has been produced while he was a guest researcher at the Swedish Road and Traffic Research Institute (VTI) in 1991. The work is part of a long-term co-operation between VTI and the Technical University of Gdansk in the subject of tire/road noise and this particular report has been sponsored by VTI. However, it has been produced as a result of demands within the project "Matmetod for jéimfdrelse av trafikbuller pa olika vagytor" (Project No. 52338-1) sponsored by the Swedish Road Administration.
The report has been reviewed by the following persons at VTI: * Dr. Ulf Sandberg
Mrs. Karin Nilsson * Mrs. Meiying Dong
The author alone is responsible for the information and views given here. We believe that the information presented in the following will be of great value for development and selection of proper measuring methods and equipment in the subject of road traffic noise.
Ulf Sandberg
ACKNOWLEDGEMENT
The author is very grateful to Dr. Ulf Sandberg who has contributed valuably to the work and has supplemented the report to a great extent and to Mrs. Karin Nilsson who has typed and corrected it.
Also the courtesy of those who have contributed materials about the trailers is greatly appreciated.
Jerzy A. Ejsmont
CONTENTS N
9
9
w
N d .p. 4.1 4.2 4.3 4.4 4.5 4.6 4.7 4.8 4.9 SUMMARY SAMMANFATTNING INTRODUCTION PURPOSETHE MAJOR MEASURING METHODS General
Tire/road noise measurements by the trailer method REVIEW OF TRAILERS USED FOR TIRE/ROAD NOISE MEASUREMENTS
Trailer for truck tires at General Motors (GM) Trailer for truck tires at the Swedish Road and Traffic Research Institute (VTl)
Trailer for passenger car tires at the University of Géttingen (UG) and the University of Berlin (UB) Trailer for passenger car tires at the Politechnika Gdanska, Technical University of Gdansk (TUG) Trailer for passenger car tires owned by the For-schungsinstitut fiJr Kraftfahrwesen und Fahrzeug-motoren (FKFS) in Stuttgart
Trailer for passenger car tires owned by Technische
Uberwachungsverein (TUV), Munich
Trailer for passenger car tires owned by the Institut fiir Verkehrsplanung, Transporttechnik, Strassen und Eissenbahnbau of ETH in Zurich
Trailer for passenger car tires owned by the Institut fijr Verkehrsplanung und Baubetrieb, at RWTH in Aachen
Trailer owned by the Slovenska vysoka skola technicka (SVST), Bratislava
VTI MEDDELANDE 669A
Page 10 1O
1O
14 141O
MICROPHONE POSITIONIS) The GM Trailer
The VTI Trailer The UG/UB Trailer The TUG Trailer The FKFS Trailer The ETH Trailer The RWTH Trailer The SVST Trailer BACKGROUND NOISE
Background noise of the GM Trailer Background noise of the VTI Trailer Background noise of the UG Trailer Background noise of the TUG Trailer General recommendations
REFERENCE TIRES General
Reference tires proposed in the French-German Procedure
Tires used in the UG/UB trailer Tires used in the TUG trailer
CORRELATION BETWEEN THE TRAILER AND THE PASS-BY METHODS
CONCLUSIONS
REFERENCES
VTI MEDDELANDE 669A
16
17
17
18
21
22
22
24
24
25
26
26
29
32
36
37
37
37
38
38
4O
51
52Classification of road surfaces with respect to traffic noise by using the trailer method
by Jerzy A. Ejsmont
Technical University of Gdansk
ul. Majakowskiego 11/12
PL-80952 Gdansk, Poland
SUMMARY
In order to limit road traffic noise it is necessary to reduce all major sources of this noise. Up to now, all noise emission limits have been based on procedures where the vehicles accelerate from a low speed. This method highlights the noise emitted from the power-train units of the vehicles.
To obtain any further noise reduction it is necessary to introduce also limits for tire/road noise and noise influenced by road surfaces (simply speaking to eliminate tires and surfaces which are excessively noisy). As an important step in this direction, there is a work item of the International Organisation for Standardisation (ISO) which is focused on measurement methods for comparison of noise on different road surfaces. One of the methods considered by the group working on this subject is the trailer method which is reviewed in this report.
Nine trailers used for tire/road noise measurements have beenreviewed. Two of them have been used for testing of truck tires and the remaining seven have been intended for passenger car tires. All of them would be possible to use also for testing road surfaces. The review includes the most important technical data of the trailers as well as the microphone positions used during the measurements.
For four trailers, data about background noise (measurements or estimations) are presented. It seems that in all four cases the background noise influence on the measurements may be neglected or it is possible to apply certain corrections.
One of the most important factors that must be considered before the trailer method can be recommended for evaluation of the road surface influence on traffic noise is its relation to other measuring methods, especially to the statistical pass-by method. In the latter method, peak pass-by levels of vehicles in actual traffic are recorded together with data about vehicle type and speed, the results of which are then averaged to obtain noise levels typical of each vehicle type and speed. This method is probably the closest one can come to actual road-side listening conditions.
The comparison of the results presented in the report shows that the trailer method correlates well with the statistical pass by method if drainage pavements are excluded. if drainage pavements are included then the trailer method underestimates their noise reduction in comparison to the pass-by method. However, if tires for use with the trailer method are selected in an appropriate way, then the underestimations have a systematic character, so it is probably possible to correct the results to some degree.
Klassificering av vagytor med avseende p5 trafikbuller genom anvéindning av matvagnsmetoden
av Jerzy A. Ejsmont
Tekniska hogskolan i Gdansk ul. Majakowskiego 11/12 PL-80952 Gdansk, Polen
SAM MAN FATTNING
For att kunna begransa vagtrafikbuller ar det nodvandigt att minska bulleremissionen frén alla enskilda bullerkallor. Till dags dato har alla bulleremissionsgranser baserats pa matprocedurer dér fordonen accelererar maximalt frén en tamligen lag hastighet. Denna metod accentuerar bullret som emitteras fran fordonens kraftproducerande enheter, sasom motor, avgas, luftinsug mm.
For att erhélla ytterligare bullerreduktion, ar det nddvandigt att infdra aven granser for buller fran bildéck (dvs att undvika dack och vagbelaggningar som ar exceptionellt bullriga). Som ett resultat harav pégér ett arbete inom den lnternationella Standardiseringsorganisationen (ISO) vilket ar fokuserat pa matmetoder for jamforelse av buller pé olika végbelaggningar. Nér en sédan métmetod finns tillganglig ar det mojligt att klassificera vagbelaggningar med avseende pa hur mycket de paverkar végtrafikbullret och darmed att favorisera de Iagbullrande belaggningarna och undvika de bullriga. Med tanke pa den europeiska integrationen ar det nodvandigt att en sadan klassificering blir internationellt Iikformig. En av metoderna som overvags av den grupp som arbetar med detta amne ar slapvagnsmetoden vilken narmare undersoks i denna rapport. Nio matvagnar som har anvants for dack/vagbanebullermatningar har undersokts. Tvé av dem har anvants for provning av lastbilsdéck och de aterstéende sju har varit avsedda for personbilsdack. Samtliga skulle aven kunna anvandas for undersokning av vagytor. Foreliggande meddelande beskriver matvagnarnas viktigaste tekniska data inklusive de mikrofon-positioner som anvants under matningarna.
Data om bakgrundsbullermétningar eller ~berakningar har presenterats for fyra matvagnar. Det tycks som om man i alla fyra fallen kan bortse fran bakgrundsbullerpaverkan pa matningarna eller att det ar mojligt att gora vissa korrektioner for att undvika sédan paverkan.
En av de viktigaste faktorerna som méste beaktas innan matvagnsmeto-den kan rekommenderas for berakning av vagbanepéverkan pa trafikbuller
IV
5r dess fdrhéllande till andra matmetoder, speciellt till den statistiska fdr-bifartsmetoden. l den senare metoden registreras de maximala bullernivaer som fordon i verklig trafik ger vid fdrbifart, tillsammans med hastighetsdata och information om fordonstyp. Dérefter beréiknas medelvardet av dessa matningar fdr att ge typiska bullernivéer fdr varje fordonstyp och hastighet. Denna metod ar troligen det narmaste man kan komma den verkliga hdrupplevelsen vid en vég.
Jamfdrelsen av resultaten som presenteras i rapporten visar att mat-.vagnsmetoden korrelerar bra med den statistiska fdrbifartsmetoden om dranerande végbelaggningar ej tas med. Om dranerande vagbelaggningar inkluderas undervarderar métvagnsmetoden deras bullerreduktion jamfdrt med om fdrbifartsmet'oden anvands. Om emellertid vissa dack utvaljes fdr métvagnsmetoden, ar undervarderingarna av systematisk karaktér, varfdr det fdrmodligen ar mdjligt att korrigera resultaten i négon man.
1 INTRODUCTION
Limitation of road traffic noise at the source has been achieved by requiring new vehicles to comply with certain noise emission limits. These have been based entirely on a measuring procedure where the vehicles accelerate from a low speed on a test track past microphones located at both sides of the track. This method highlights the noise emitted from the power-train units of the vehicle, i.e. from the engine, exhaust, transmission and air intake. It means that vehicles have been optimized for twenty years for low power-unit noise, whereas tire/road noise has been left aside. As a result, tire/road noise now dominates road traffic noise in practically all situations where traffic runs without stops, provided that the vehicle fleet meets the noise limits set up in the industrialized countries during the last decade.
In order to limit road traffic noise at the source further, it is necessary to supplement the vehicle power-unit noise reductions with:
* limits for noise from tires
* limits for noise generation as influenced by road surfaces.
As a first step towards the latter, a new work item has been initiated by the Swedish Road and Traffic Research Institute (VTI), now accepted by the International Organization for Standardization (ISO). This work item is called "Measuring Method for Comparing Noise on Different Road Surfaces" and has been assigned to the group ISO/TC 43/SC 1/WG 33. In this work, a method will be selected and developed in order to enable the comparison of tire/road noise emission properties of road surfaces. The W6 33 has, so far, held two meetings at which candidate methods have been identified and tentatively evaluated.
This report presents a review which may constitute a background for determining the pros and cons of one of the major candidate methods, namely the trailer method.
2 PURPOSE
The purpose with this document is to provide a review of various noise measuring trailers and to discuss the characteristics of the trailer method. This could hopefully be a background for decisions within the ISO/TC 43/ SC 1/WG 33 as well as give the reader in general a review of the subject.
3 THE MAJOR MEASURING METHODS
3.1 General
The task of the ISO/TC 43/SC 1/WG 33 is to prepare methodls) of evaluating road surface properties with respect to traffic noise. Four major candidate methods have been identified:
* The Statistical Pass-by Method (SPB) * The French-German Procedure
* The Trailer Method
* The Trailer Method supplemented with Sound Absorption Measurement
In particular, WG 33 has considered "The Statistical Pass-by Method" as being interesting. This method relies on measuring the peak noise levels of normal vehicles in actual traffic passing-by a road side microphone with simultaneous recording of vehicle speed and type. Afterwards, simple statistics can be applied in order to assign noise values to the road for certain speeds and vehicle types.
Unfortunately, there are certain disadvantages with the pass-by method. First of all, the results depend on the vehicles and tires in use at that particular time. Passing vehicles are classified by the observers but there is usually no way to obtain any information about tires. Furthermore, it is inappropriate to compare the obtained results between places where the traffic composition (types and conditions of vehicles) is significantly different or different types of tires are used. There is for example a difference in the vehicle fleet and tires used in certain parts of Europe, not to mention Africa. In some countries, like Sweden, it is common practice to use alternatively summer and winter tires (the last ones mostly with studs) that complicate the matter even more. Also, the time factor must not be neglected, as vehicles and tires are subject to continuous changes.
The French-German Method, resulting from an earlier bilateral co-operation, could also be called the Controlled Pass-by Method (CPB) and is somewhat similar to the SP8 method but relies on certain vehicles equipped with certain tire types, in contrast to the random vehicles in actual traffic used in the SP8 method. The Trailer Method (TRL) is based on running one or more selected tires on the road surfaces in question by help of a trailer in which the test tire is mounted. One or more microphones are then positioned very close to the test tire.
The Trailer Method has the disadvantage of not apprOpriately taking into account the sound absorption of porous road surfaces. Therefore, it was considered to supplement this method with a measurement of the road surface sound absorption.
It seems at the moment, that the most appropriate method is the Statistical Pass-By Method in which noise is measured on vehicles in actual traffic. The Statistical Pass-By Method accounts for both tire/road noise and power-train noise. Also conditions of short-distance sound propagation are realistic for this method.
3.2 Tire/road noise measurements by the trailer method
It seems reasonable to consider an alternative method that may provide a better long-term stability. As the trailer method makes it possible to control at least one important factor namely the tires - and to eliminate vehicle influence, it should be considered as a second major method for evaluation of road surfaces according to noise generation.
Tires used during trailer measurements may be preserved at least for ten years to make possible long-term comparisons of road surfaces. Some reference tires (specified by PIARC and ASTM) are manufactured and available for years according to the same specifications.
The trailer method is also very well suited for fast and inexpensive measurements, also in places where no other method can be used (during road building or rebuilding).
The statistical pass-by method averages the results over a big population of vehicles and tires but gives no averaging regarding the position on the road; i.e. the very spoton the road where the measurements take place must be representative. The trailer method, on the other hand, provides averaging over the desired distance on the road.
The trailer method has two important disadvantages in comparison to the pass-by method. First, it accounts only for tire/road noise and all other noise sources are neglected. lf drainage pavements are included in the test program, there could be a significant influence of the surface on power-train noise which is not recorded in the trailer method. Another problem is that the effect on traffic noise is not the same as the effect on tire/road noise.
On drainage pavements the absorption provided by the road may significantly reduce the propagation over the surface, between source and observer, of noise which is generated by the vehicle. This propagation effect cannot be measured with a "near-field" microphone such as in the trailer method. The second disadvantage is thus that the trailer method is relatively insensitive to the sound absorption of the surface, even regarding tire/road noise, due to the short propagation path from source to microphone. It is, however, sensitive to the influence of road surface porosity on generation mechanisms like air-pumping and pipe resonances.
4
Generally, the trailer method underestimates the benefits coming from porous surfaces, but does not miss them totally. It is possible, that the results obtained by the trailer method may be corrected for the absorption properties of the surfaces to provide a better correlation with the pass-by method.
4
REVIEW
OF
TRAILERS
USED
FOR
TIRE/ROAD
NOISE
MEASUREMENTS
According to this author's knowledge two trailers capable of running truck tires and at least seven trailers for passenger car tires have been developed and used for tire/road noise measurements.
4.1 Trailer for truck tires at General Motors (GM), USA
A single-wheel trailer for tire/road noise measurements was built by General Motors in the early seventies. According to the information obtained by this author the trailer has not been used for several years. The trailer is shown in Fig. 1 and discussed in detail in Ref. [1].
The trailer places the test tire at a distance of 12.2 m behind the rear axle of a towing truck. Removable weights mounted on the trailer beam load the tire from 11.7 kN to 22.2 kN. The test unit was designed for speeds up to 113 km/h.
The trailer structure consists of a single square tube, providing a minimum surface for sound reflections. The suspension system allows a vertical motion of the wheel with respect to the trailer frame and employs an air spring and commercial shock absorbers.
The towing vehicle that was used during the reported measurements was a GMC 6500 Series truck with 5.54 m wheelbase. The outer of the dual tires were removed from each side of the rear axle. An acoustical enclosure was employed to reduce the noise from the remaining two tires and from the differential gear housing.
It was calculated that the noise from the test tire alone measured on a radius of 3.66 m from the tire would be at least 6 dB greater than the background noise from the towing vehicle, assuming a 5 dB insertion loss for the acoustic enclosure over the rear tires of the towing vehicle.
The trailer did not include any means of driving the test tire. It operates under conditions almost identical with those existing for tires on the non-driven axles of trucks and semitrailers.
s from General Motors [1] E19, Trailer for truck tire
Due to its unique construction the trailer was used not only for measurements with a "moving" microphone but also to simulate pass-by. In this case, the far-field radiation was recorded using a semi-circular array of stationary microphones at the roadside as shown in Fig. 2. The array obtains what might be considered a "snapshot" of the radiated tire noise as the test tire passes through the center of the array.
Fig. 2 An array of microphones for a passby measurement with the GM trailer [1]
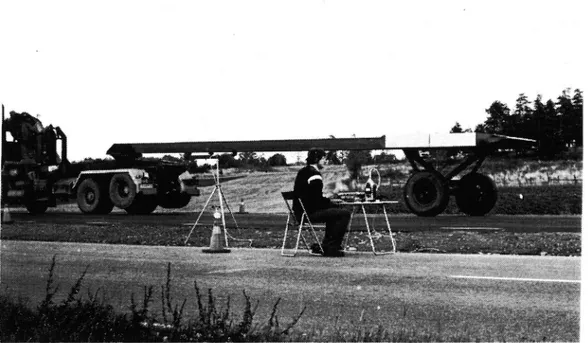
4.2 Trailer for truck tires at the Swedish Road and Traffic Research Institute (VTI), Sweden
The trailer that is shown in Fig. 3 was built in the early eighties [2]. (Despite the figure, this trailer is used only for near-field measurements, see the cover figure and the microphone position in Fig. 15). It features a one-axle device with two tires, one of which is the test object, towed via a 10 m long beam by an (almost) arbitrary truck. The load package is very compact, and is situated approximately 1 m above the axle.
Technical data of the trailer are listed below:
Max. length 12 m
Max. width (excl. microphone arm) 2.9 m
Min. load on test tire 9 kN
Max. load on test tire 32 kN
Max. speed (measurements) 90 km/h
Max. speed (transport) 20 km/h
Tire sizes: From 8.25-20 to 12.00-22
Manoeuvrability 7.9 m road width around 90°
street corner.
Fig. 3 Trailer for truck tires from the Swedish Road and Traffic Research Institute. See also the cover figure.
4.3 Trailer for passenger car tires at the University of Gdttingen (U6) and the University of Berlin (UB)
This trailer was initially used by The Third Physical Institute of the University of Gdttingen and later transferred to the University of Berlin where some of its elements were redesigned.
The version used in Gottingen is shown in Fig. 4. To obtain a transverse stability the trailer uses two supporting wheels positioned on both sides of the measuring wheel, but outside the enclosure. To reduce background noise, the extra supporting wheels are equipped with narrow and smooth motorcycle tires.
Since the trailer has no inherent resistance to longitudinal tilt, the towing vehicle must provide a stabilization of the trailer in the vertical, longitudinal plane. To stabilize the trailer properly, it is required that the towing vehicle has a system to trim its rear suspension to the height of the towing hook on the trailer. All vertical movements of the towing car are transmitted to the trailer and result in relative changes of the clearance between the ground and the edges of the enclosure. The measuring wheel is supported on a pneumatic element that is loaded by means of gravitation.
In recent years this trailer has been used very extensively by the University of Berlin to survey noise characteristics of roads in Central Europe, mainly in Germany. Then a PIARC tire with a straight rib pattern has been used almost exclusively as the test tire.
g._e Trailer from the University of Gdttingen/University of Berlin
4.4 Trailer for passenger car tires at the Politechnika Gdanska,
Technical University of Gdari'sk (TUG), Poland
In 1979 a first version of this trailer was built at the Technical University of Gdansk, Poland [3]. The trailer was modified in 1989. The modified version is shown in Fig. 5. The trailer has three wheels which provide stability in all directions. Two front wheels are self-steering and secure the right position of the trailer. The test wheel is enclosed in a semi-anechoic chamber. The test wheel is mounted directly to the frame, without a flexible suspension. The steel loads are contained in baskets
outside the chamber that have independent suspensions to reduce the
dynamic forces acting on the measuring wheel. The ground clearance under the lower edge of the chamber may be adjusted in the range 20 -50 mm. The chamber is manufactured with a composite material and aluminum pipes. The inner part of the enclosure is covered with polyurethane foam. The outer surface of the foam is formed to a regular pyramid pattern. This provides sound absorption in order to prevent sound reflections from influencing the measurements at the microphone positions. The standing waves and other reflections due to the chamber are negligible for frequencies over 250 Hz.
W h a m -a f) (:u'ex: 6.. 51'v19» 4.\ v 1 . (;}'\\\~\: ((
Fi . Trailer from the Technical University of Gdar isk. a - trailer on the road, b - trailer placed on the road wheel facility at the laboratory of TUG
10
The trailer can accommodate wheels of different dimensions starting from 135R12 and up to 225R15. The load may be adjusted in the range 2.4 to 5.0 kN. Max. speed of the trailer is rated at 130 km/h. If necessary, the trailer may be operated by one person only (the driver) but it is recommended to be operated by two persons.
Intensive measurements with multiple wheel changes per day are possible with this trailer. To make the operations more easy, the towing vehicle is equipped with a specially designed speedometer that constantly shows to the driver the difference between preselected and actual speed as well as average speed during the measurements.
The trailer must be driven very carefully in curves and on roads of bad quality.
4.5 Trailer for passenger car tires owned by the Forschungsinstitut fiir Kraftfahrwesen und Fahrzeugmotoren (FKFS) in Stuttgart, Germany This trailer was built in 1975. It has one wheel only, that means it is directly coupled with a cardan joint to the towing car [4]. The measuring wheel is encapsulated by a rather big enclosure. A schematic view of the trailer is presented in Fig. 6 while Fig. 7 shows an actual view.
4.6 Trailer for passenger car tires owned by Technische Uber-wachungsverein (TUV), Munich, Germany
Like the FKFS trailer, this one is of a single wheel construction. The measuring wheel is covered by a rather compact enclosure. The enclosure is lined with sound absorbing material. The trailer is shown in Fig. 8.
4.7 Trailer for passenger car tires owned by the Institut fiir Verkehrsplanung, Transporttechnik, Strassen und Eisenbahnbau of ETH in Zurich, Switzerland
This trailer is also of a single wheel construction similar to the FKFS trailer [4]. A schematic view of the ETH trailer (ETH = Eidgendssische Technische Hochschule) is shown in Fig. 9 and an actual view in Fig. 10.
11
1 Magnetband 7 Scnalldamofende Auskleidung
2 Pegelschretber 8 Vorscnalldamofer mlt
3 Nechseirlcnter Verkleldung
u Mikrofon mlt Nlndschirm 9 Schalidammende Scnurze
S Digitalzahier fUr Messraddrehzahi 10 Doooelwandlger Abgasschlauch
6 Messrad (175 R 14) ll Zusatzschaildamofer
Radlast des Messrades FGR = 3000 N
RelfenluftUDerdruck DU = 2,0 bar
Fig. 6 Trailer at FKFS, Stuttgart [4]
Fig. 7 Inner view of the trailer at FKFS, Stuttgart
12
Fig. 8
Trailer at TUV
MESSANHANGER
@CD 1 Messrad
2 Messmikrophone iix montierl
3 PCM Prozessor
4 Videorekorder (in Verbindung mit dem PCM Prozessor als lnlormationsspeicher) 5 A-Filier
6 Pegelschreiber
Fig. 9 Trailer at ETH [4]
Fig. 10 Trailer at ETH, Zurich
VTI MEDDELANDE 669A
13
ZUGFAHRZEUG
3
7 KopihOrer
8 Mikrophon (Ur Kommemare (Audiospur des Videorekorders)
9 Speisegerai und
Mikrophon-Vorverstarker
10 schalldampiende Scharze 11 Speziaiauspuii
12 entdrOhnle wande mil
14
4.8 Trailer for passenger car tires owned by the Institut fiir Verkehrsplanung und Baubetrieb, at RWTH in Aachen, Germany The RWTH trailer [4] has two wheels and both of them are placed inside an enclosure (RWTH Rheinish-Westfélische Technische Hochschule). Each wheel has its own microphone. A schematic view of the trailer is shown in Fig. 11.
4.9 Trailer owned by the Slovenska vysoka skola technicka (SVST), Bratislava, Czechoslovakia
As many other trailers, this one has a single test wheel covered with an enclosure. This trailer which was built in 1990 at the SVST is very compact. A schematic view is shown in Fig. 12 and an actual view in Fig. 13.
Mlkroghon Oreh20hlgeber 717..
l
27:: I=g= :.
i {mmFig. 11 Trailer at RWTH, Aachen [4]
:5. :l'
I
\3
/
-r
K L____//
73-,»
E5
__JL
mlkrofon 4059 1972 6031Fig. 12 Trailer at SVST, Bratislava
VTI MEDDELANDE 669A
1 . i
i
Fig. 13 Trailer at SVST, Bratislava
16
5
MICROPHONE POSITIONlS)
Due to the dimensions of the existing trailers the microphones used during the measurements are positioned in the "near field", usually 0.2 -0.5 m from the tire footprint. According to the author's knowledge most of the researchers have experimented with different microphone positions. Often the final microphone position has been chosen to provide the best correlation with coast-by measurements or to obtain a high S/N ratio.
For many tires the noise level may depend somewhat on the side of the tire where the microphone is positioned since noise emission is not always symmetrical. Occasionally, also the direction of test tire rotation may be important. It is, therefore, strongly recommended to measure the noise on both sides of the tire. It must be noted that turning the tire around is not equal to measurements on both sides because the angle of
grooves entering and leaving the contact area in the shoulder region is not changed by turning the tire around! Some trailers may use microphones mounted on both sides of the tire within very similar and symmetrical acoustical environments (e.g. the TUG and RWTH trailers) while in other cases only one side of the tire is suitable for microphone mounting (e.g. the SVST trailer).
The reported microphone positions for different trailers are given below.
751!» y!)
__L
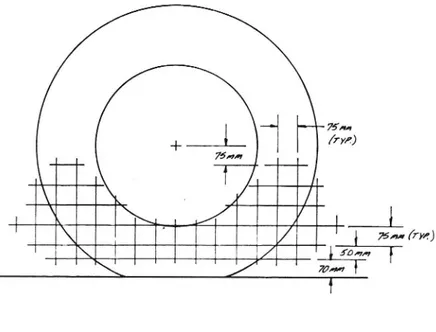
J izin 75»: (rye) 70mFig. 14 Acoustic intensity measurement point grid system utilized in the GM trailer
17
5.1 The GM Trailer
According to [5 and 6] the measurements have been performed with a 60 point array of acoustic intensity probe positions in an imaginary, flat, vertical grid displaced 100 mm from the tire sidewall (see Fig. 14 on the previous page).
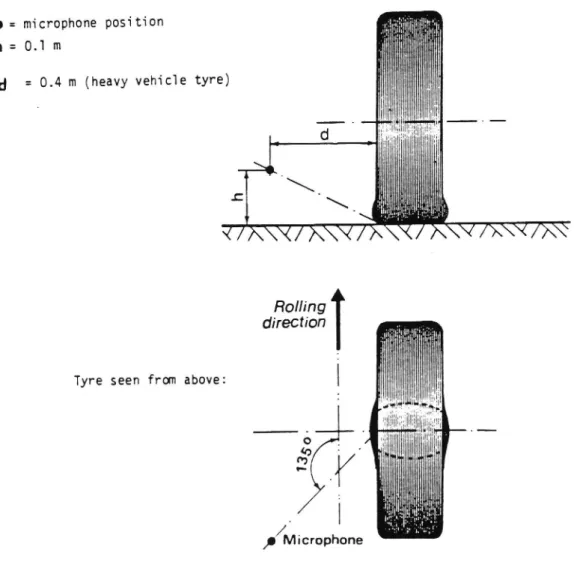
5.2 The VTl Trailer
The microphone position during the measurements was based on measurement techniques specified in a proposal for an ECE regulation for tire/road noise (Ref. 12). It is shown in Fig. 15.
O = microphone position h = 0.1 m 3 O i iI".
-. IaziiLi "l l '9?
'y:; in! it
d = 0.4 m (heavy vehicie tyre)
I!
!i
lE !A d
W
a.
I
J \-
\= .
i::§:-f'!3!1 i35T/A\\(/>\\\(/>\ '
V/X\\</>\\\
Rolling ' ect'ondlf I a;'i invilill lu!rim
a ' '
Tyre seen from above: I in
'
- . HiéiilliF'illliitilWii; Ii _ o . ' .II In . (0 . I 1 .m. l..
I ll'lliililsillli
/ . " E: 2'; s2"aé';l' ; MicrophoneFig. 15 Microphone positions for measurements with the VTI trailer
18
5.3 The UG/UB TrailerDuring the measurements performed by the UG, sixteen microphones were used at the same time [7]. They are marked in Fig. 16. Prof. Ronneberger at UG has investigated optimal microphone positions and which combinations of them can provide best correlation with coast-by measurements. A so-called "linear model" (shown in Fig.
developed. The results are presented in Fig. 18. He has also investigated17) was
Fig. 1§ Microphone positions used in the U6 trailer [7]
4 5 0 3
E50/.
.\02
\
7(0/
91
BO - -Oe -+
US) * 9(5) + L(3) * 9(3) =ch+E
Fig. 17 Principle of the "linear model" [7] .
(ch = level measured by the coast by method)
19
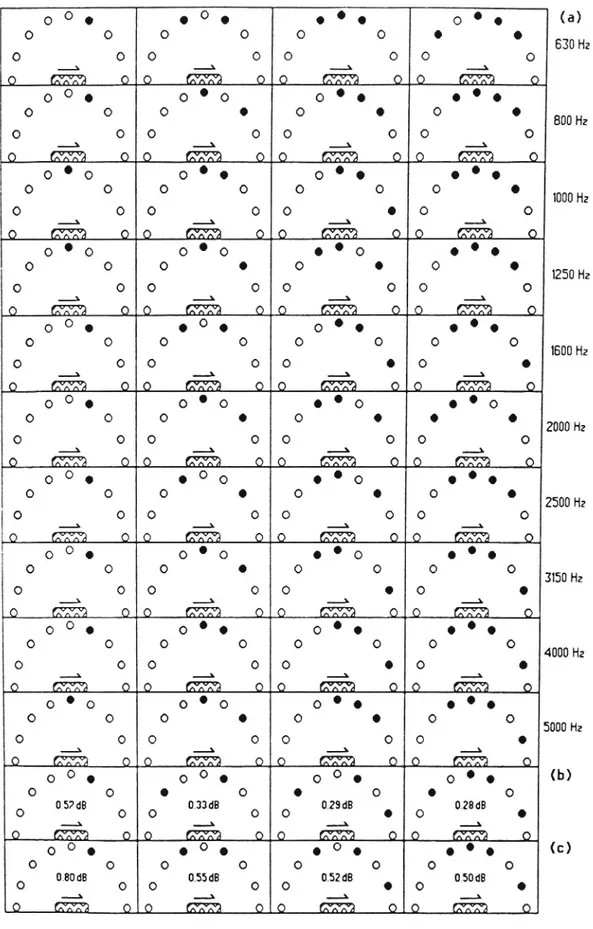
Fig. 1g Optimal microphone combinations for the U6 trailer. (a) For each third octave band
(b) For optimum fit of the A-weighted level (0) For optimum spectrum fit
VTI MEDDELANDE 669A
0 O o o O o 0 ° 0 o 0 o (a) o o o o o o o o 630H2 o o o o o o o o ) -\ __\ __X o m o 0 mm o 0 mm o 0 mm o o O o 0 ° 0 0 ° 0 0 ° 0 o o o o o o
O
O
800Hz
o o o o o o o o .__X ..__} .__ _...l 0 min? 0 D m 0 O m 0 O m _0 0 ° 0 o o 0 ° 0 0 ° 0 o o o o o oO
o
lOOOHz
o o o o o o o o . 3 _.\ ___ __X0 Man 0 0 Man 0 0 Man 9 0 Man 0
0 ° 0
0 ° 0
0 ° 0
0 ° 0
o o o o oO
o
o
1250Hz
o o o o o o o o ___3 . § . § _\o 0 o
o o o
0 ° 0
0 ° 0
o o o o o o oO
mom
0 o o o o o o o .._.\ X \ _._l O 633:? Q 0 m 0 m 0 m 0o 0 o
0 ° 0
0 ° 0
0 ° 0
o o o o o o oo
ZOOOHz
o o o o o o o .__8 . .3 .3 3 O (T151533 Q Q m 0 Q m 0 O m 0 o O o o O o 0 ° 0 o o o o o o o o o o ZSDUHz o o o o o o o o __} . .X _ 3 _l (ETTA? Q Q m 0 Q m 0 Q @332 Q o O o 0 ° 0 0 ° 0 0 ° 0 o o o o o o o o 3150Hz o o o o o o o _._\ .__§ 3 ._\ mm o 9 Man o 0 Man O o m oo O o
0 ° 0
0 ° 0
0 ° 0
o o o o o o o o 4000H2 o o o o o o o o _ _ 3 § .__3 Q m 0 Q m Q Q m 0 m 0o
o
0 ° 0
0 ° 0
o
o
o o o o o o o o 5000Hz o o o o o o o o _.3 _._.} ..__$ .._X m D O m 0 O m Q Q m 0 o O o o O o o 0 o o o (b) o o o o o o o o 0 0.5700 0.3300 0.2900 . 0.2000 8 .8 .___X 3 D m D m 0 Q m J) O m 0 o O o o 0 o o 0 o 0 ° 0 (C) o o o 0 0.0000 0.5500 0.5200 0.5000 . _X ___3 3 _ l O m 0 Q m 0 Q m D Q m 020
the correlation between A-weighted sound pressure levels measured at single microphone positions with the total sound power averaged over all microphone positions [8]. He found that the correlation coefficient R varies strongly at most measuring points as a function of the road surface, but a stable maximum of R is usually found at 135 deg. (Fig.
19).
When the trailer was transferred to the UB, the microphone positions were changed. Instead of using sixteen microphones only three were employed, placed in positions marked in Fig. 20, [4].
FF 7 1 1 safety walk I 0.9 » conCrete \\ . 0.8 F replica asp f t to ta l so un d ne we r . Idistinctness of tires ca rr el at io n co ef fi ci en t 3 I l 1 I ._ 1.0 F distinctness of 3 :2 roads 0.9 r q tires 0.8 r -si ng le di re ct io n so un d pr es s. li ne 4 1.2 " 1 tires l e p e of regr es s. 0.8 h at roads J #1 J J 1 0° 45° 90° 135° 180°
front side back
Fig. 19 Correlation coefficients and averaged slopes of regression lines according to Ronneberger's investigation [8]
21 ud d ? Fohrtrichlung
Schollcbsorbierende Auskleidung SlUtzrdd Fohrzeugrdhmen
Rohmen mil Mikrofonhcllerungen Mikrofon mil Positionskennzeichnung
Fig. 29 Microphone positions used in the UB trailer
5.4 The TUG Trailer
In its early years of use, only one microphone was utilized and it was placed at position 2 in Fig. 21. However, after an extensive comparison of the results with the results of coast-by measurements, another microphone position was chosen. It is marked as position 7 in Fig. 21. It provides better correlation with far-field measurements, especially for the medium frequency range of the spectra. In some cases also a position 3 has been used.
Since 1989, microphones are placed on both sides of the tire in cases where tires are compared but only a left-side microphone is used if road surfaces are compared. The reason is, of course, that some tires may give an unsymmetrical noise generation. This should be of no importance when classifying road surfaces.
22
O = microphone position h = 0.1 m
d = 0.2 m (passenger car tyre)
mini;will: 1"
1' ' ill
l:_ d W '!' , 1 1L . \ . g I, .C \ . Milli}, hi 1 . ,_ L 43.421515 l'*5:.-.;.
Y7?\\\(/?\\\Z/>\ '
Rolling direction
3Ju i'l- Igllllilr'will :
; l l
.
l
Tyre seen from above: I l 1
Li"! I ,!inf??? W
l
'lh _..'l. llllllllll
l
ll
-o. . . . . _ _ _ . _ .
.
I
/Microphone 0'.Fig. 21 Microphone positions used in the TUG trailer
5.5 The FKFS Trailer
The microphone position is marked in Fig. 22. 5.6 The ETH Trailer
Two microphone positions which are marked in Fig. 23 were used. VTI MEDDELANDE 669A
23
ReHen-Auleuf PIIHH'H S; Mikrnnhov. H 11' "'W " IIKIU HHHiM Microphone positions used in the ETH trailer [4]
24
5.7 The RWTH Trailer
The trailer is equipped with two measuring wheels and each wheel has its separate microphone, the position of which is marked in Fig. 11.
5.8 The SVST Trailer
The microphone is mounted according to the proposal for an ECE tire/road noise regulation, see Ref. 12, at the position marked in Fig. 24.
e = microphone position h = 0.1 m
d = 0.2 m (passenger car tyre)
A i . :iz ' .: illil,. ll
fl
\ s,
I 5 l .i
\ "3:11.1511:will
0 A\\</ 7\\\(
'
\v DAY/N
Rolling direction 5.1ii'j'l ilglihili"'5m , z ' '-Tyre seen from above: I
;'
.
1w '.
niiéliixéillsfulfil
l 7m»It1ll}!
z . 1 . l:sllli
iii!
"'3'?0 ..to . r , h /M i crophone
Fig. 24 Microphone position used in the SVST trailer
25
6
BACKGROUND NOISE
The background noise during trailer measurements is caused by several sources. The following main components should be considered:
* Air-flow noise, depending on vehicle and wind speeds. For a trailer without any enclosure around the microphonels) and the measuring wheel, this noise is mainly generated due to the air-flow around the microphone(sl. For a trailer with an enclosure its lower edge could itself be responsible for the extra noise. The ground clearance of the enclosure could also give a "leakage" of air-flow norse.
* Noise generated by supporting wheels. if the trailer is equipped with extra wheels to make it stable or to support the enclosure, they could contribute to the background noise depending on their distance to microphonels) and wind screens.
* Vibration-induced noise produced by the trailer body due to road and tire excitation.
* Noise generated by the suspension of the trailer.
* Noise produced by the bearings of the measuring wheel.
* Noise generated by the towing vehicle (engine, exhaust, tires). * Extra noise of various origin (e.g., incidental contact between the
enclosure and the road surface, passing vehicles, horns and so on). In case of such noises certain actions should be taken by the instrument operator.
Most of the noise components mentioned above are mainly dependent on the speed, so it seems reasonable to estimate the background noise as a function of the trailer speed.
There are two major methods for background noise measurement. One is the lifted or "removed wheel principle" where the measuring wheel is raised from its normal position, after which the "desired" noise disappears and the background remains. The other method is the "quiet tire/road combination" where the most quiet tires and the most quiet road surfaces are utilized even if they are of extreme and abnormal construction. When the trailer is run with such a tire/road combination (the supporting wheels, if there are any, are run on a normal surface) the measured noise is an upper limit to the background noise, as some noise of the measuring wheel inevitably remains.
26
6.1 Background noise of the GM trailer
In the GM trailer the most important sources of background noise seem to be the air-flow around the microphone and the noise coming from the towing truck.
The sound levels from the test tire alone and from the tires on the trailer were calculated based on the assumption that the test tire is as noisy as each tire of the towing vehicle and that the sound level decreases by 6 dB for each doubling of distance. The difference (arithmetic) between these levels is shown in Fig. 25. Locations "a" to "h" represent possible microphone positions. Three values for each point correspond to situations where there is no enclosure for the towing vehicle wheels and where the enclosure has either 5 dB or 10 dB insertion loss. The enclosures are presented in Fig. 26.
To minimize aerodynamic noise generated by the trailer a streamlined fiberglass cover was added to the rear of the trailer, smoothing the flow over the loading weights, the suspension components, and the brake actuating components.
6.2 Background noise of the VTI trailer
Theoretical and practical analyses of the potential noise sources have been made and compared to the noise from the test tire on the trailer, anticipating a microphone position 1 m outside the test tire and 0.1 -0.2 m above the ground. The practical analyses include a test of towing-vehicle and microphone background noise (power unit, tires and aerodynamic sources) as a function of position behind the vehicle. Signal-to-noise ratio, considering the noise from a pattern-less steel radial tire as the test object at 1 m distance, and total microphone noise 10 m behind the towing vehicle rear axle as "noise", was found to be better than 10 dB over the important frequency range (see Fig. 27). The contribution from the test trailer itself reduces this ratio to approximately 6 - 8 dB, at worst, which is considered sufficient.
27
40- 5.54 m >i< 12.20 m (18.2 ft.) (40 ft.) LOCATION OF TRUCK TIRESC
L-§]
-+ - -8_ l
l
C):
r1251
1.83 m
L
.
L--.)
(6 ft.)
Wf
EC
f
1)-3.3 1) 3.3
mm
2) 6.3 ~\l3e
3) 1.7\ 3) 7.8
m\~ e(25 ft.)
\i
/
' LOCATION OF TEST TIRE 3.66 m 6.10 (12 ft.) v (20 ft.) é 8% OJ 1)7.4
1) 4.4/2) 9.9 ,2) 6.8
3) 11.2 / 3) 8.0
1) 5.7
: .4K )2.1
2) 8
Key:
3
_
i) 47
3) 9.8
1) No enclosure
~57
3) 6.0
2) Enclosure over rear tires
with a SdB insertion loss
3l Enclosure over rear tires with a 10 dB insertion loss
15.24 m 1) -3.2
(50 ft.)
/
2) _0.9
t
-
9
3) +0.1
Fig. 2
VTI MEDDELANDE 669A
J
5
28
E_ig._2§ Enclosures of rear wheels of a truck used to tow the GM trailer ' [1] 20 dB 1 0 dB 0 dB 12,5 20 25 40 50 so 100 160 200 315 400 6:10 000 12501500 25003150 5000 5300 10000 15 31,5 53 125 250 500 1000 2000 4000 8000 FREKVENS [Hz]
Fig. 27 Signal-to-noise ratio of the VTI trailer in the microphone position 10 m behind the rear axle of the towing vehicle, provided the concerned test object is a smooth steel radial tire at 1 m distance [2]
29
6.3 Background noise of the U6 trailer
Background noise of the UG trailer was measured by the "removed wheel principle" as well as using quiet tire/road combinations.
The U6 trailer has two supporting wheels which are used during normal measurements and which, together with the towing hook, support the trailer even when the measuring wheel is removed. The supporting wheels are covered with the enclosure to separate the microphones from their rolling noise. It must be mentioned that the distance from a supporting wheel to the nearest microphone is similar to the distance between microphones and the measured tire, so the screening is extremely important.
During the "removed wheel" background noise measurements, the trailer was equipped with 16 microphones positioned circularly around the center of the tire/road contact patch. However, the measuring wheel was removed from the trailer. The tests were performed on asphalt concrete and cement concrete surfaces on the Contidrom (Continental Road Test Facility).
The results obtained during the measurements were calculated as A weighted sound power levels re. 10 12 W. It was observed that the background noise power levels measured by microphones positioned on both sides of the measuring wheel (90° and 270°) were 5 to 7 dB(A) higher than for the position in front of (0°) and behind (180°) the wheel. It was probably caused by noise generated by the supporting wheels. Figure 28 shows the signal-to-noise ratio as a function of microphone location at speeds 40, 60 and 120 km/h on an asphalt concrete surface and when using a non-patterned smooth tire.
Frequency spectra show that it is possible to separate three areas of different S/N ratios. Below 400 Hz the signal-to noise ratio is very low (0 - 5 dB). In the medium frequency range (400 - 4000 Hz) it increases to 10 - 15 dB and later decreases again to 8 - 10 dB. In the low frequency range, the high background noise is most probably caused by a flow of air inside the chamber and by structural vibrations. For higher frequencies the noise is produced mainly by the supporting wheels.
Measurements of the background noise by the "quiet tire/road combination" principle were conducted in 1985 (see Fig. 29): [9]. Four quiet surfaces and three tires were used. They are listed below:
3O
* Tire with smooth tread, dimension 1758R14
* Tire Michelin XMS, 175$R14
* Tire Continental T5740 M +S, 17SSR14 Surfaces
Dense felt (like an inexpensive floor carpet) Grinding paper (Carborundum 320)
Smooth aluminum plate
Ventilated surface "ADP" designed especially for this experiment [9] (like a sound absorbing panel)
*
*
*
*
The microphone position used during the experiment was 100 mm above the ground, 200 mm distance from the tire sidewall and in a position 135° relative to the rolling direction. The results calculated in octave bands are summarized in Fig. 30.
A conclusion is that the signal-to-noise ratio is sufficient at least at octaves higher than 630 Hz.
24»
22+ // "\\
+ 40 km/h
20.4
+ co km/h
1 \K //, ~\ 18 / \ \\ ° 120 km/h /* Z 16 \ \ o 73 14 12 10-; ° 3 0 8+; ° 1 Front Rear T l v l e W O 45 90 135 180Microphone position /deg/
Fig. 28 Signal-to-noise ratio in the U6 trailer as measured with the lifted tire principle
31
, . - '. -~.
Eig;_2_g Measurements of background noise in the U6 trailer with the quiet tire/road combination principle
l 00
T 1 5
- M
90 ~ 1 2 \ __E
- 8 \Z
__J (f) C]. _m 70
6
Tire XMX on ospholt surfoce
60 @ SPL for the most quiet
tire/surfoce combinotions -- Minimum S/N rotio 50~
1250 2500 5000
Octave bond frequency /HZ/
Fig. 30 Background noise and S/N ratio in the U6 trailer as measured with the quiet tire/road combination principle
32
6.4 Background noise of the TUG Trailer
Background noise of the TUG trailer was measured both with the lifted tire principle and the quiet tire/road combination principle.
The TUG trailer is not very well suited for the lifted/removed wheel method as the measuring wheel is necessary to support the trailer and cannot be removed without a special adaptation. To make such measurements possible, two additional wheels located outside the enclosure were fitted (Fig. 31). The wheels were adjusted to give a clearance of 20 mm between the measuring wheel and the road surface. The distance from the microphone to the nearest extra wheel was around twice the distance from the microphone to the measuring tire. There is an important difference in comparison to the UG trailer since during normal measurements the extra wheels do _n_o_t contribute to the background noise; nevertheless their noise was inevitably added to the background in this test. In case of the U6 trailer, the supporting wheels are located close to the measuring tire all the time.
The normally used supporting wheels of the TUG trailer are positioned far from the microphone (6.5 and 8 times the distance from the microphone to the measuring tire) so even if the noise generated by them would be similar to the noise generated by the measuring wheel, and the screening performed by the enclosure would be negligible, the S/N ratio considering only the tire sources would still be around 15 dB. Such an estimation is conservative since the supporting wheels are very narrow, have a big diameter, are low-inflated and low-loaded so they should be relatively quiet.
Fig. 32 shows estimations of S/N ratio for a typical tire rolling on a smooth asphalt surface. The estimation of the background noise is based on the lifted tire principle. The results obtained by the lifted tire principle were judged to be influenced very much by the "extra" supporting wheels since they are thought to determine the background noise "floor". These wheels were equipped with tire tread patterns with circular grooves. Such tread patterns are relatively noisy in the frequency range 800 - 3150 Hz and their distance to the microphone was only about twice the distance between the microphone and the test wheel.
The test by the quiet tire/road combination principle was conducted in a similar way as for the U6 trailer [9]. The surfaces used for the test were the same as stated in Chapter 6.3 except one extra surface which was a soft carpet. The tires used for the experiment are listed below:
* PIARC reference smooth tire, dimension 1658R15
* PIARC reference smooth tire filled with polyurethane, dimension 165$R15
33
Fig. 31 Extra supporting wheels mounted on the TUG trailer
25
SMOOTH ARTIFICAL SURFACE
MICROPHONE 90' --- SMOOTH TIRE -p-SPEED: 70 km/h - SUMMER TIRE 'SP
[d
8]
Fig. 32 Estimation of S/N ratio in the TUG trailer based on the lifted tire principle
34
The spectra obtained from the evaluations are presented in Fig. 33. The S/N ratio for a typical summer tire rolling on a smooth asphaltic concrete is shown in Fig. 34. The analysis of the most quiet tire/road combinations showed, that the lowest noise of frequencies below 2 kHz was obtained for a tire filled with polyurethane and that for higher frequencies a normal, smooth tire was quieter.
90:
85;
80-:
c-753
r l 1 . .47O2
.4 l/
on
31
l p 01 I L J I I L T -Q s.' n40%
q
35g
% % i l l l l l l l l I T T l l63
125
25
500
1
2
4k
8k
16k
Frequency /Hz/
I l l L l l l l l J l l l l JFig. 33 Spectra of the background noise in the TUG trailer (quiet tire/road combination principle)
35
All surfaces used during the measurements but the soft carpet are quite or very expensive. It would be desirable to use only the soft carpet as it is very cheap and fast to install temporarily. By a comparison of the background noise estimations obtained with the whole set of surfaces and soft carpet only, it appears that the impairment by this simplification is acceptable. LN 01 l (N O A l l l L l l l l l l L l l l % l l l l l l l L l J l l l l l L J l l N ()1 l [\ J O l
S/
N
[d
B]
CD I 01 l l l l l l l l63
1'2'1250H56'11H 2H 4k
8k [16k
Frequency /Hz/
L l l l l l l l 1 0Fig. 34 S/N ratio in the TUG trailer (based on the quiet tire/road combination principle)
36
6.5 General recommendationsHow the background noise of a trailer should be tested is up to the judgement of its owner, but according to the experience gained at the Technical University of Gdansk and the Swedish Road and Traffic Research Institute the following procedure should be used as a minimum. The principle of the quiet tire/road combination should be used. It means that the noise from the test tire in the trailer - and no other supporting tires - should be measured on the most quiet surface available and using the most quiet tire available.
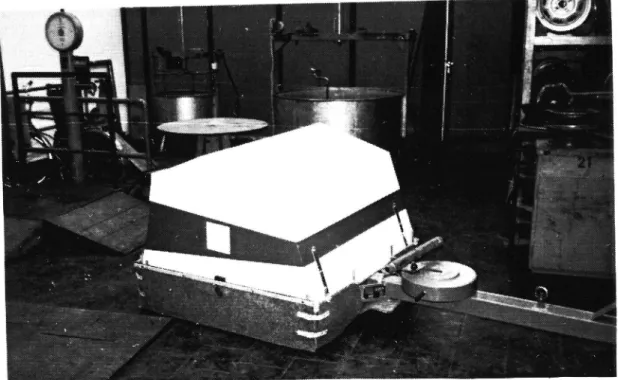
A suitable tire is the PIARC reference tire with a smooth tread or, probably even better would be the "composite wheel" described in [10] and shown in Fig. 35. The composite wheel has not been tested on a soft carpet but on normal surfaces it is more quiet than any other known wheel. A suitable surface is a soft textile carpet used in floor carpeting. Its "hard" part should be as smooth as possible, and it should be glued on the smoothest possible road. A proper width would be about 0.5 m and the length should be 30 - 100 m. An averaging time of at least 1 s should be used and runs sufficient to give at least 4 s of total measuring time should be made.
INBOARD OUTBOARD
SIDE SIDE
00.0.5595? . _
Rim outer art F g Bimlinnerpartl
53,3
x :5"
F
_
V
'ame * v '23 Bolt hole
I . " Center hole
Wheel dlSC + Inner rim + Shoulder + Outer rim , :3"!.. . .. . ShOulder
Z75 Metal I Rubber Composnte
Fig. 35 The composite wheel [10]
37
It is also recommended to locate a screen between the test tire and the microphone. It should have dimensions enough to cover the essential parts of the tire, with the lowest practical ground clearance. It should be made of 2-4 mm thick aluminum covered by sound absorbing material on its tire-facing side. The screen should not reduce any other noise than the noise from the test tire. Therefore, it should not cover the bearing, seen from the microphone position.
The noise level obtained in the microphone when running in a normal way over this carpet surface using the smooth tire will be an upper limit to the background noise.
If more than one tire is used for the tests (9. g. a smooth tire and a smooth tire filled with polyurethane) the results should be combined to get the minimum levels at each frequency.
7. REFERENCE TIRES
7.1 General
To reliably compare noise emission on road surfaces it is necessary that different and representative tires be used during the measurements. Tires may interact with road surfaces in different and sometimes even opposite
ways depending on the type of tire.
In many cases, there are no statements whether any type of "reference" tires are used consistently in the trailers. Therefore, the following survey is very incomplete.
7.2 Reference tires proposed in the French-German Procedure
Some future measurements in Germany will utilize reference tires. The methods will be the French-German Procedure which is also called "the Controlled Pass-By Procedure" (CPB), as well as the Trailer Method. According to Ref. 13, the following tires have been selected as references for further experiments:
* Michelin MXT, 155/70 SR 13 * Goodyear Vector, 175/70 SR 13 * Continental CH90, 195/65 HR15 * Pirelli P600, 205/60 VR15
These will be used in measurements with the CPB method and the Trailer
method (incl. the UG/UB trailer in Berlin).
38
7.3 Tires used in the UG/UB trailer
The UG/UB trailer when used by the University of Gottingen utilized commercial and prototype tires for measurements. A lot of measurements were performed with tires 155$R13 Continental TS771, Dunlop SP4, Firestone $211, Goodyear Allweather, Michelin XZX and Uniroyal Rallye 280.
So far, the type of tire used in the UG/UB trailer during its time in Berlin
has been exclusively the PIARC rib tire. PIARC standard test tires are manufactured for reference purposes according to strict specifications. There are two different versions of the PIARC tires. Both are of the size 165R15 but one of them has no tread pattern (is smooth), while the other one has circumferential straight grooves. The most important advantage of the PIARC tires is their well defined specification which is not subjected to changes for years. Unfortunately, the tread pattern (either smooth or circumferential grooves) is not well suited for noise measurements since modern tire treads have very complicated patterns; acoustically very different from circumferential and straight ribs.
7.4 Tires used in the TUG trailer
The tires chosen for the experiments were selected in such a way as to cover a wide range of designs typical of present cars. All tires were steel radials of the 165R15 size. A short description of the test tires is given below and in Table 1 and Fig. 36:
0 Tire P is a standard reference tire without tread which can represent the extreme case when the tire tread pattern is worn out. It would be the tire which is the most sensitive to road surface properties.
0 The tires S and M represent ordinary "summer" tires.
0 The tire G represents "winter" (snow) tires without studs, in this case with a relatively aggressive pattern. There are "winter" tires with more "closed" patterns but these are, in terms of noise emission, more similar to the S and M tires. This tire is expected to be the one which is the least sensitive to road surface properties.
0 The tire GS is the same as G, but with studs, and thereby represents the most common tire type in winter time in Sweden.
39
Table 1 The selected test tires in the TUG trailer
TIRE SIZE 8.
' . MANUFACTURER COMMENTS FOOT - PRINT,
SYMBOL TREAD PATTERN
165 R 15 P.I.A.R.C. PAVEMENT
P
B.F. GOODRICH
SMOOTH TEST TIRE >1975<
165 SR 15 mI '9
S CAVALLINO S-l FIRESTONE 'SUMMER TIRE mm
165 SR 15
M MICHELIN SUMMER me g g gg '
. XZX
l G 165 R 15 86 Q GISLAVED WINTER TIRE ~ 53- 93~
M+S FROST V v S
I 165 R 15 86 Q mm me {*3}
GS . GISLAVED g.
M+S FROST WITH 108 STUDS V v q .
Fig. 36 The selected test tires in the TUG trailer
4O
8
CORRELATION BETWEEN THE TRAILER AND THE PASS-BY
METHODS
One of the most important factors that must be considered before the trailer method can be recommended for evaluation of the road surface
influence on traffic noise is its relation to other measuring methods.
It seems that the trailer method correlates well with coast-by tire/road noise measurements if drainage pavements are excluded [11]. If drainage pavements are included then the trailer method in comparison to the coast-by method usually overestimates their noise influence.
Many investigations presenting correlations between trailer (or drum) measurements and coast-by measurements present relations between those methods which include a wide range of speeds. This will generally give very high correlations, but it should be noted that this is misleading since the cause for it is that speed influence is the same in both methods. Any correct correlation study shall eliminate the influence of speed in this respect before calculating or presenting a relation. Speed shall be treated independently.
In a recent Japanese study [14], tire/road noise on a dense asphalt surface was compared to that on a porous asphalt surface, using both the coast-by and the near-field methods. For a passenger car as well as for a truck (measurements with a rib as well as a cross-bar tire), a mean overestimation of noise on the porous surface of 2 dBA was obtained for the near-field method compared to the far-field (coast-by method).
The author is not aware of any publication addressing the correlation between the trailer method and the statistical pass-by method. Fortunately enough, the Swedish Road and Traffic Research Institute and the Technical University of Gdansk performed some time ago, a lot of measurements by the trailer method and the statistical pass-by method on the same roads. The results were not originally evaluated from the point of view of correlation between both methods, but it has been possible to do it now.
41
Table 2 gives a description of the surfaces used for the evaluation. The pass-by results have been normalized to 70 km/h. They included noise emitted by passenger cars only, since the test tires used in the trailer method were only car tires.
The surfaces were grouped into five groups:
smooth, dense asphalts (old) - used as a reference smooth, dense asphalts (new)
double surface dressings single surface dressings drainage asphalts * * * * *
Trailer measurements were performed for six tires described below: 165SR15 PIARC Pavement Test Tire; smooth tread,
1655R15 Firestone Cavallino 5-1; summer tread, 165SR15 Michelin XZX; summer tread,
1655R15 Firestone M+S Town & Country; winter tread, 165$R15 Gislaved M +S Frost; winter tread,
S 165$R15 Gislaved M+S Frost, same as G but with studs.
E E C / 3 ' 0 CD C)
Figure 37 presents the results averaged for each group of surfaces. Instead of absolute values of sound levels the differences between certain surface types and smooth, old asphalt are plotted.
If drainage pavements are excluded, then the summer tires M and S, as well as the winter tire W, show reasonably similar ranking of surfaces measured by the trailer method as by the statistical pass-by method. However, the noise levels obtained on single surface dressing surfaces are somewhat lower than expected when using the trailer method. The deficit is 1.0-1.5 dB(A). It is difficult to explain this at the moment. One of the possible reasons may be different directivity of the sound radiation
and another. may be higher rolling resistance. Rolling resistance on a
single surface dressing is higher than for smoother surfaces and this could mean that power-train noise on this surface may be higher due to higher loading of the drive unit and tire/road noise may be higher due to higher torque.
Figures 38, 39, 40, 41, 42 and 43, show the relations of the results obtained by the trailer and SP8 methods for each surface separately. Surfaces of drainage type are marked by x while othersurfaces have the symbol 0.
42
Table 2 Road surfaces used for evaluation of correlation between the trailer and the SP8 methods
.
Macro-Road Site location Type of Type of pavement Age texture
site Road (year) * (dB)
No.
11 Road E4, north of 2x2 lane Surface dressing (Y1 4-8 mm) 0 58 Nykoping motorway laid on top of worn dzo,
12-16 mm chippings, two years older
12 -"- -"- Surface dressing, double 2 57 (Y2 12-20/4-8 mm). The top
layer (4-8 mm chippings) worn away
30 -"- -"- Smooth, dense and worn 10 48 asphalt concrete (MAB12T)
33 -"- -"- Surface dressing (Y1 4-8 m 0 56 mm) laid on top of worn dzo
(Y2 12-16/4-8 mm). one year older
35 -"- -"- Asphalt concrete of 1 60
drainage type, chippings <12 mm (HABD12)
36 -"- -"- Same as No. 35, but 8% of 1 62 the binder is rubber
(HABD1ZG)
38 -"- -"- A special bituminous seal 1 47 ("Cape seal") on top of a
double surface dressing. Smooth surface.
51 Road 796, east 2x1 lane Smooth, dense asphalt O 52 of Linkoping highway concrete (MAB12T)
52 -"- -"- Asphalt concrete of O 63
"drainage" type, chippings < 12 mm,
50 kg/m2 (50HABD12)
53 -"- -"- Same as No.52 but thicker, 0 63
90 kg/m2 (90HABD12)
54 -"- -"- Same as No. 52 but medium 0 63
thick, 70 kg/m2 (7OHABD12)
55 -"- -"- Asphalt concrete of type 0 57 'Delugrip"
Max 12 mm chippings
57 -"- -"- Rough, single surface dressing 0 60
(Y1 12-16mm), some bleedings in wheel track
' dB rel. to 10'5 m rms, within the texture wavelength range 2-100 mm
to
th
e
sm
oo
th
,
de
ns
e
as
ph
al
t
Ti
re
/R
oa
d
no
is
e
re
l.
43
TR_TN1 a5 T
70 l<m/h
-
0% of heavy vehicles
_Il4
Single surf. dressing
.0 d c
O 3 ~ Double surf. dressmg.
:S
(D - \.
u.
E 2 _ Smooth, dense asphalt (new) _ _ ___.t
L _ /
.93
6
i ~~ Drainage asphalt
k. _+_, _ a) ..._ _C O ,o -+ J _a l ~
8 4 + /' / 5 "'2 \7'4 \/ -- "M" summer tread 8 - /- -+ "S" summer tread g 3 0/ 404 "W" winter tread V d -9 "G" winter tread 4 q- ~0- Tires M.S,W,G averaged 5 I i I it I 1T I i I *IF I j! I i I i j i I i5
4
3
2
l
O
l
2
3
4
5
Traffic noise rel. to the smooth, dense asphalt /dB/
Fig. 37 Comparison of results obtained with the trailer method versus the statistical pass-by (SPB) method). Speed: 70 km/h, 0 % of heavy vehicles. Please note that the results with the SP8 method were obtained in the summertime. Consequently, tires
W and G are not representative for such measurements
For the smooth tire P the correlation is very low, so it appears that smooth tires are not acceptable for representative evaluation of road surfaces. This is natural since tire/road noise is lower in relation to power-train noise then. Tire M shows a rather good correlation for both groups of surfaces (dense and porous) if they are treated separately. For this tire there is almost a constant shift of around 2 dBlA) between the VTI MEDDELANDE 669A
44
regression lines for each group, i.e. noise on drainage surfaces are overestimated at 2 dBlA). In fact, this is the same value as reported for the Japanese investigation at the beginning of this chapter. It may be possible to "correct" data obtained on drainage surfaces to fit better the relationship but it is difficult to estimate how valid such a correction may be in general cases. Tire S shows worse correlation than tire M. For the winter tire W the correlation is rather high. The correlation of the results for the winter tire G is low, at least for non-drainage surfaces. This is natural, since for such an aggressive tread pattern, the tread pattern influence dominates over the road texture influence. Strange enough, the studded winter tire GS shows a very good correlation for both types of surfaces. Nevertheless, the use of the winter and studded tires as "references" is unrealistic.
It may be concluded, that summer tires and some selected winter tires may be a good choice as "reference" tires for the evaluation of the surfaces by the trailer method.
![Fig. 2 An array of microphones for a passby measurement with the GM trailer [1]](https://thumb-eu.123doks.com/thumbv2/5dokorg/4727942.124999/21.892.205.656.271.578/fig-array-microphones-passby-measurement-gm-trailer.webp)

![Fig. 9 Trailer at ETH [4]](https://thumb-eu.123doks.com/thumbv2/5dokorg/4727942.124999/28.892.123.760.174.971/fig-trailer-at-eth.webp)
![Fig. 17 Principle of the "linear model" [7] .](https://thumb-eu.123doks.com/thumbv2/5dokorg/4727942.124999/33.892.150.629.388.669/fig-principle-linear-model.webp)
![Fig. 19 Correlation coefficients and averaged slopes of regression lines according to Ronneberger's investigation [8]](https://thumb-eu.123doks.com/thumbv2/5dokorg/4727942.124999/35.892.232.570.368.885/correlation-coefficients-averaged-slopes-regression-according-ronneberger-investigation.webp)
