DISSERTATION
ANGUS CATTLE AT HIGH ALTITUDE: PULMONARY ARTERIAL PRESSURE, ESTIMATED BREEDING VALUE AND GENOME-WIDE ASSOCIATION STUDY
Submitted by Xi Zeng
Department of Animal Sciences
In partial fulfillment of the requirements For the Degree of Doctor of Philosophy
Colorado State University Fort Collins, Colorado
Fall 2016
Doctoral Committee:
Advisor: Milton G. Thomas Co-Advisor: R. Mark Enns
Copyright by Xi Zeng 2016 All Rights Reserved
ABSTRACT
ANGUS CATTLE AT HIGH ALTITUDE: PULMONARY ARTERIAL PRESSURE, ESTIMATED BREEDING VALUE AND GENOME-WIDE ASSOCIATION STUDY
In high altitude states such as Colorado, New Mexico, Utah and Wyoming, hypoxia-induced bovine pulmonary hypertension (PH) commonly referred to as “brisket disease” or “high altitude disease (HAD)”, has been observed within the cattle industry. This disease is a major cause of morbidity for beef cattle ranches and feedyards above 1500 m and contributed to an estimated $60 million (based on cattle price of $800/head) loss each year in beef herds at high altitude of the United States. This disease in humans and animals is a response to hypoxia, which results in pulmonary vasoconstriction, vascular remodeling, elevated pulmonary arterial pressure (PAP), pulmonary hypertension, right heart ventricular hypertrophy, and finally death from congestive heart failure. Due to the close physiological relationship between HAD and PAP, this measurement has been used as an indicator trait for studying HAD. The objectives of this study were to explore the phenotypic and genetic characteristics of various yearling PAP phenotypes, develop multivariate models for genetic evaluation of yearling PAP phenotypes, conduct genome-wide association studies (GWAS) on yearling PAP phenotypes and performance traits and evaluate the genomic relationships among traits.
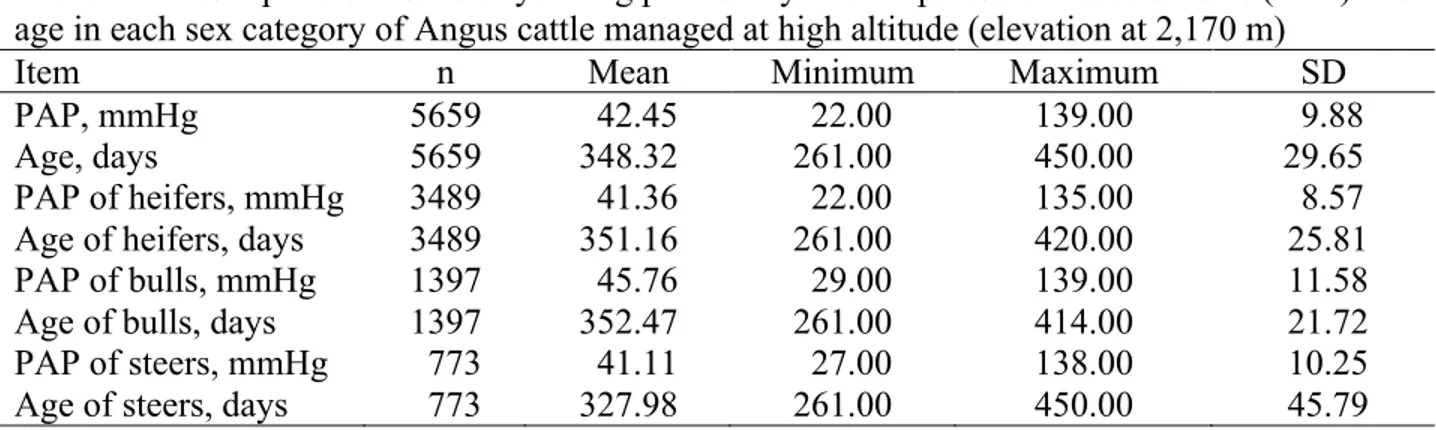
Yearling PAP measurements (42.45 ± 0.56 mmHg) and performance phenotypes were collected from Angus cattle born from 1993 to 2015 at John E. Rouse Colorado State University Beef Improvement Center (CSU-BIC, 2,170 m in elevation). Beside the non-transformed
three-category phenotype (CAT3), an ordinal two-category phenotype (CAT2) were investigated in this study. The PT (10000×PAP-2) was determined via Box-Cox analysis, the CAT3 observations were defined as low risk (PAP < 41mmHg), moderate risk (41mmHg ≤ PAP ≤ 49mmHg) and high risk (PAP > 49mmHg) for HAD. The CAT2 observations were constructed by combining low and moderate risk categories of CAT3. Performance traits included birth weight (BWT; 36.21 ± 0.50 kg), weaning weight (WW; 213.88 ± 0.34 kg), post-weaning gain (PWG; 127.29 ± 0.88 kg) and yearling weight (YW; 344.85 ± 1.10 kg). Genotype data on 2,765 Angus cattle born from 1997 to 2015 in the CSU-BIC were merged and used in this study. Most individuals were genotyped using various formats of Illumina Bovine SNP50 Beadchip version 2 assays (54,609) over three year-groups (i.e. 2013, 2014 and 2015) and in two labs (i.e. Zoetis and GeneSeek), and with a subset (n=65) steers genotyped in 2013 using Illumina BovineHD BeadChip (777,962 SNP) through GeneSeek (Lincoln, NE).
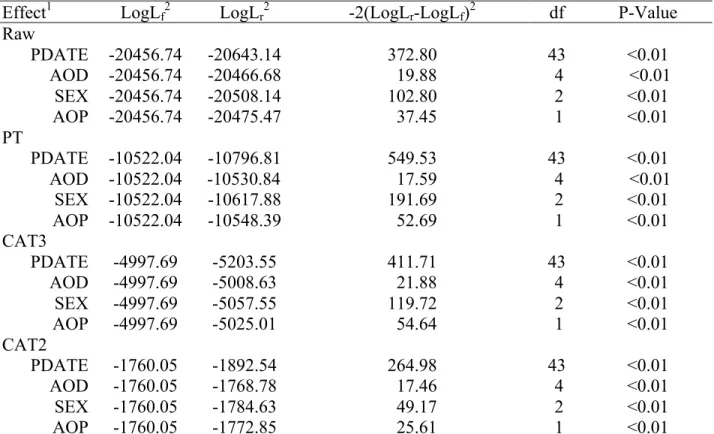
The fixed effects in the models for yearling PAP phenotypes included sex, age of dam, PAP measurement date and age at PAP measurement as a covariate. For performance traits, fixed effects included sex, age of dam, age of measurements (covariate) and contemporary groups. Significance of fixed effects was tested using log-likelihood ratio test from generalized linear models and maximum likelihood method. Univariate linear and threshold models were applied to estimate heritability for yearling PAP phenotypes (i.e. RAW, PT, CAT3 and CAT2), and bivariate and multivariate linear and threshold models were used to obtain genetic correlations between yearling PAP phenotypes and performance traits, and between yearling PAP in different sex categories.
Deregressed EBV (DEBV) and associated reliability of various yearling PAP phenotypes and performance traits were developed from their EBV and accuracy from multivariate animal
models and used as dependent variables in GWAS. The linear models for GWAS were executed using Bayes B and Bayes C methods. The percentage of genetic variance of specific trait explained by a genomic window (~ 1 Mb) was applied to identify significant QTL regions. The SNP effects on each trait from GWAS were obtained to construct associated weight matrix (AWM) and calculate SNP effect based genetic correlation between yearling PAP phenotypes and performance traits.
The estimated heritabilities were 0.24, 0.24, 0.25, and 0.32 for RAW, PT, CAT3 and CAT2, respectively. Sire EBV accuracies from univariate models of RAW, PT, CAT3 and CAT2 ranged from 0.03 to 0.67, 0.03 to 0.68, 0.01 to 0.65 and 0.01 to 0.58 with means of 0.31, 0.31, 0.27 and 0.21, respectively (pooled sd = 0.13). The absolute genetic correlations between them were above 0.91, and the rank correlations between EBV from RAW and PT, CAT3 or CAT2 were 0.92, 0.84 and 0.77, respectively. The RAW, CAT3 and CAT2 had a downward sloping genetic trend, and the PT (the inverse transformation of PAP) has an upward sloping genetic trend that consistent with the other PAP phenotypes’ genetic trend. The estimated heritability of yearling PAP phenotypes of bulls were significantly different (P < 0.05) from that of heifers. Genetic correlations between yearling PAP phenotypes in bulls and heifers were 0.82, 0.79, 0.96 and 0.87, and EBV rank correlations were 0.94, 0.93, 0.99 and 0.96 for RAW, PT, CAT3 and CAT2, respectively. Results suggested violation of assumptions in linear modeling had limited influence on genetic evaluation results, and losses in EBV accuracy and some re-ranking of sires was observed in ordinal categorical phenotypes compared to continuous PAP scores. The non-transformed yearling PAP measurements were preferred in genetic evaluation of PAP measurements because of its similar genetic heritability with PT, higher accuracy than
alternative dependent variables in studying PAP, however, they would cause some re-ranking of sires related to non-transformed PAP measruments. The PAP phenotypes in different sexes were identified genetically un-identical (P < 0.05). However, it is not necessary to treat yearling PAP as separate traits by sex in genetic evaluation because the EBV from all PAP and PAP of different sexes were highly correlated and would yield similar rank of animals.
The estimated genetic correlations between various yearling PAP phenotypes and BWT, WW, PWG, YW and MILK ranged from 0.22 to 0.27, 0.16 to 0.22, 0.03 to 0.16, 0.11 to 0.20, and 0.07 to 0.16 respectively. The average EBV accuracy of yearling PAP phenotypes was improved by 0.011 (sd = 0.0026; 7.20%) and 0.0018 (sd=0.0021, 1.15%) in multivariate (including PAP, BWT, WW, PWG) and bivariate models (including PAP and YW), respectively. This multivariate model was preferred in estimating EBV for yearling PAP phenotypes, since it would increase the accuracy of the EBV and the number of animals used in GWAS.
We identified 4, 12 and 9 windows (1-Mb) associated with RAW, CAT3 and CAT2, respectively. The majority of these lead-SNP (with the highest model frequency in identified window) resulted in significant (P < 0.05) additive effects, and only one lead-SNP had significant dominant effect. This demonstrated the polygenetic characteristics of yearling PAP phenotypes, additive effects of most of yearling PAP phenotypes associated SNP and dominant effects of limited number of yearling PAP phenotypes associated SNP. Five concordant windows located on chromosome 7, 11, 12, 15 and 20 were identified across the PAP phenotypes when considering top 2% windows of each phenotype. Gene enrichment and ontology analysis suggested these windows were related to ion binding and transportation, inflammation, innate immunity and cell proliferation mechanisms. This gave evidences of the identified QTL’s association with hypoxia-induced elevated PAP in cattle.
Twenty-two windows were identified to be associated with performance traits (i.e. BWT, WW, PWG, YW, MILK), which illustrated the polygenetic characteristics of these traits. Seven of them located on chromosome 7, 14, 20 and X were pleiotropic across these performance traits. Gene enrichment and ontology of these windows clustered gene functions in categories such as adipose tissue development and innate immunity.
Only two windows, located on chromosome 7 at 93 Mb and Chromosome 20 at 4 Mb, were recognized as pleiotropic between yearling PAP phenotypes and performance traits. Low to moderate SNP-based genetic correlation were identified between yearling PAP phenotypes and performance traits, and the SNP-based genetic correlation explained 61 % variation of pedigree-based genetic correlation. Results suggested SNP effects could be used to estimate genetic correlation between traits. Genes in two pleiotropic windows and AWM have roles in intracellular transportation, cellular metabolism, inflammatory, hypoxia response and cell proliferation, which demonstrated the effects of SNP in AWM on PAP phenotypes. Our findings will improve the understandings of biological process involving health and growth in Angus cattle managed at high altitude, and also help genetic improvement in these cattle against PH and HAD.
ACKNOWLEDGMENTS
I would like to express my sincere and grateful appreciations to my advisor Dr. Milton G. Thomas for his guidance, understanding, encourage, patience, and most importantly, continuous support for my PhD studies. His mentorship helped me through the research and writing of this dissertation, and provided well direction in developing my long-term career goals. Without his guidance and persistent help, this dissertation would not be possible.
A special thank to my co-advisor Dr. Mark Enns for his input and guidance on my studies, with whose help I explore the idea and development of this dissertation. I would also like to thank my dissertation committee: Dr. Timothy N. Holt, who provided considerable of help in understanding and developing the dissertation topic on pulmonary hypertension, Dr. Scott E. Speidel, for his guidance in my study of quantitative genetics sciences, computational programming, critical thinking and trouble shooting. A big thanks also goes out to Dr. Kraig Peel, who gave me insight comments, asked me good questions and helped me understand the whole-picture of the beef industry.
In addition, I am grateful to the John E. Rouse ranch group, who helped me gather the data to be used in my dissertation. Furthermore, I would like to offer my thanks to my colleagues in Animal Breeding and Genetics group at CSU. Their support and encouragement benefited me during the whole process of my PhD program and life in the United States.
Lastly, I would also like to express my special thank to my mother and father for their support in my studies and life. This dissertation would not be possible without their dedication. I am appreciative of my husband Yang for his support, patience, tolerance and encouragement in the past three years. Thanks always go to my friends for their support and enthusiasm.
TABLE OF CONTENTS
ABSTRACT ... ii
ACKNOWLEDGEMENTS ... vii
LIST OF TABLES ... xv
LIST OF FIGURES ... xx
LIST OF EQUATIONS ... xxii
CHAPTER 1 INTRODUCTION ... 1
1.1 Background ... 1
1.2 Objectives ... 3
LITERATURE CITED ... 5
CHAPTER 2 LITERATURE REVIEW ... 7
2.1 Introduction ... 7
2.2 Economics ... 7
2.3 Physiology of HAD ... 8
2.4 Relationship between PAP and HAD ... 12
2.5 Measurement of PAP ... 14
2.5.1 Technical procedure ... 14
2.5.2 Calculation of mean PAP ... 14
2.6 Environmental factors influencing PAP measurement ... 17
2.6.4 Production level ... 20
2.6.5 Other factors ... 21
2.7 Inheritance of PAP and HAD ... 22
2.7.1 Inheritance of High Altitude Disease ... 22
2.7.2 Inheritance of PAP ... 24
2.8 Genetic selections and PAP ... 26
2.9 Model for genetic evaluation ... 28
2.9.1 Multivariate models ... 29
2.9.2 Threshold models ... 30
2.9.3 Other types of models ... 31
2.9.4 Model development ... 32
2.9.5 Models for genetic evaluation of PAP ... 36
2.10 Genetic relationship between PAP and growth traits ... 39
2.11 Genomic wide association study ... 40
2.11.1 Response variable in GWAS ... 41
2.11.2 Methods used in GWAS ... 42
2.11.3 Bayesian inference ... 46
2.11.4 Markov chain Monte Carlo ... 48
2.11.4.1 Gibbs Sampling algorithm ... 49
2.11.4.2 Metropolis-Hasting algorithm ... 50
2.12 Post GWAS process ... 50
2.12.1 Genomic selection ... 51
2.12.3 Network analysis ... 55
2.12.4 Additional “omics” studies ... 55
2.13 Conclusions ... 56
LITERATURE CITED ... 58
CHAPTER 3 PHENOTYPIC AND GENETIC CHARACTERISTICS OF PULMONARY ARTERIAL PRESSURE IN ANGUS CATTLE MANAGED AT HIGH ALTITUDE ... 66
3.1 Introduction ... 66
3.2 Materials and methods ... 66
3.2.1 Data ... 66
3.2.2 Distribution of yearling PAP measurements ... 68
3.2.3 Testing fixed effects ... 68
3.2.4 Genetic evaluations ... 69
3.3 Results and discussion ... 73
3.3.1 Distribution of yearling PAP measurements ... 73
3.3.2 Fixed effects ... 78
3.3.3 Genetic evaluation ... 84
3.3.3.1 Genetic parameters ... 84
3.3.3.2 EBV ... 87
3.3.3.3 Genetic trend ... 89
3.3.3.4 Genetic relationship between PAP in different sex categories ... 92
CHAPTER 4 GENETIC RELATIONSHIP BETWEEN PULMONARY ARTERIAL PRESSURE PHENOTYPES AND PERFORMANCE TRAITS OF ANGUS
CATTLE MANAGED AT HIGH ALTITUDE ... 103
4.1 Introduction ... 103
4.2 Materials and methods ... 104
4.2.1 Data ... 104
4.2.2 Fixed effects ... 105
4.2.3 Genetic parameters ... 106
4.2.4 EBV and accuracy ... 109
4.3 Results and discussion ... 110
4.3.1 Fixed effects ... 110
4.3.2 Genetic correlations between yearling PAP and performance traits ... 112
4.3.3 EBV and accuracy ... 118
4.4 Conclusions ... 122
LITERATURE CITED ... 123
CHAPTER 5 GENOMIC WIDE ASSOCIATION STUDY ON YEARLING PULMONARY ARTERIAL PRESSURE PHENOTYPES OF ANGUS CATTLE AT HIGH ALTITUDE REGION ... 126
5.1 Introduction ... 126
5.2 Materials and methods ... 126
5.2.1 Deregressed EBV ... 126
5.2.2 Genotype data ... 129
5.2.3 Statistical method ... 130
5.3.1 DEBV ... 133
5.3.2 GWAS of PAP phenotypes ... 134
5.3.2.1 Non-transformed PAP measurements ... 138
5.3.2.2 Three-category phenotypes for PAP ... 143
5.3.2.3 Two-category phenotypes for PAP ... 149
5.3.2.4 Additive and dominant effects ... 152
5.3.3 Effect of different phenotypic forms on GWAS ... 156
5.4 Conclusions ... 164
LITERATURE CITED ... 167
CHAPTER 6 GENOMIC WIDE ASSOCIATION STUDY ON PERFORMANCE TRAITS OF ANGUS CATTLE MANAGED AT HIGH ALTITUDE ... 178
6.1 Introduction ... 178
6.2 Materials and methods ... 178
6.3 Results and Discussion ... 180
6.3.1 DEBV ... 180
6.3.2 GWAS of performance traits ... 182
6.3.3 Trait-specified QTL window ... 187
6.3.4 Pleiotropic QTL window ... 195
6.3.5 Gene enrichment analysis ... 201
6.4 Conclusions ... 202
CHAPTER 7 GENOMIC RELATIONSHIP BETWEEN YEARLING PULMONARY ARTERIAL PRESSURE AND PERFORMANCE TRAITS OF ANGUS
CATTLE AT HIGH ALTITUDE ... 210
7.1 Introduction ... 210
7.2 Materials and methods ... 210
7.2.1 Concordant QTL windows ... 210
7.2.1 Genomic correlations ... 211
7.3 Results and discussion ... 213
7.3.1 Pleiotropic genomic windows on PAP and growth performance traits ... 213
7.3.2 Genomic correlation ... 216
7.4 Conclusions ... 220
LITERATURE CITED ... 221
APPENDIX 3.1 HERITABILITY ASSOCIATED WITH DIFFERENT THRESHOLD POINTS TO CONSTRUCT THREE-CATEGORY PULMONARY ARTERIAL PRESSURE PHENOTYPE ... 223
APPENDIX 3.2 REGRESSION ESTIMATES OF SEX, AGE OF DAM AND AGE OF MEASUREMENT ON NON-TRANSFORMED ALL, BULL, HEIFER AND STEER PULMONARY ARTERIAL PRESSURE PHENOTYPE ... 227
APPENDIX 3.3 REGRESSION ESTIMATES OF SEX, AGE OF DAM AND AGE OF MEASUREMENT ON POWER-TRANSFORMED ALL, BULL, HEIFER AND STEER PULMONARY ARTERIAL PRESSURE PHENOTYPE ... 229
APPENDIX 3.4 REGRESSION ESTIMATES OF SEX, AGE OF DAM AND AGE OF MEASUREMENT ON ALL, BULL, HEIFER AND STEER THREE-CATEGORY PULMONARY ARTERIAL PRESSURE PHENOTYPE ... 231
APPENDIX 3.5 REGRESSION ESTIMATES OF SEX, AGE OF DAM AND AGE OF MEASUREMENT ON ALL, BULL, HEIFER AND STEER TWO-CATEGORY PULMONARY ARTERIAL PRESSURE PHENOTYPE ... 232
APPENDIX 4.1 REGRESSION ESTIMATES OF SEX, AGE OF DAM AND AGE OF MEASUREMENT ON GROWTH PERFORMANCE TRAITS ... 233
APPENDIX 5.1 SUMMARY OF GENOTYPED SAMPLES ... 235 APPENDIX 5.2 GENOMIC WINDOWS EXPLAIN >1% GENETIC VARIATION FROM GWAS OF NON-TRANSFORMED, THREE-CATEGORY AND
TWO-CATEGORY YEARLING PULMONARY ARTERIAL PRESSURE
PHENOTYPES FROM ANGUS CATTLE AT HIGH ALTITUDE
(ELEVATION AT 2,170 M) ... 236 APPENDIX 6.1 APPENDIX 6.1 GENOMIC WINDOWS EXPLAINED > 1% GENETIC VARIATION FROM THE GWAS OF PERFORMANCE TRAITS FROM ANGUS CATTLE AT HIGH ALTITUDE REGION (ELEVATION AT 2,170 M) ... 237 APPENDIX 7.1 SUMMARY OF ASSOCIATED WEIGHT MATRIX OF GENOME-WIDE ASSOCIATION ANALYSIS ON YEARLING PULMONARY ARTERIAL PRESSURE PHENOTYPES AND PERFORMANCE TRAITS IN ANGUS CATTLE MANAGED AT HIGH ALTITUDE (ELEVATION AT 2,170 M) .. 238 APPENDIX 7.2 RESULTING ASSOCIATED WEIGHT MATRIX ... 239 APPENDIX 7.3 SIGNIFICANT GENE ONTOLOGY (GO) TERMS FROM GENE ENRICHMENT ANALYSIS ON GENES IN ASSOCIATION MATRIX ON YEARLING PAP PHENOTYPES AND PERFORMANCE TRAITS IN ANGUS CATTLE MANAGED AT HIGH ALTITUDE (ELEVATION AT 2,170 M) .. 257
LIST OF TABLES
Table 2.1: Evaluation of pulmonary arterial scores ... 13 Table 2.2: Estimated heritability and repeatability for pulmonary arterial pressure (PAP) in previous literature ... 24 Table 2.3: Guidelines for using pulmonary arterial pressure to evaluate cattle’s (older than 9 month) susceptibility for high altitude disease ... 39 Table 2.4: Summary of different Bayesian methods ... 44 Table 2.5: History of Bayesian Inference in animal breeding and genetics ... 48 Table 3.1: Descriptive statistics of yearling pulmonary arterial pressure measurements (PAP) and age in each sex category of Angus cattle managed at high altitude (elevation at 2,170 m) ... 67 Table 3.2: Results of log-likelihood ratio tests for fixed effects of each form of yearling pulmonary arterial pressure (PAP) phenotypes in Angus cattle managed at high altitude (elevation at 2,170 m) ... 79 Table 3.3: Results of regression coefficients, statistical tests and increases in R2 of
365-day-adjusted yearling weights on yearling pulmonary arterial pressure phenotypes of Angus cattle managed at high altitude (elevation at 2,170 m) ... 81 Table 3.4: Results of log-likelihood ratio tests for fixed effects of non-transformed yearling pulmonary arterial pressure (PAP) of Angus cattle managed at high altitude in each sex category (elevation at 2,170 m) ... 82 Table 3.5: Results of log-likelihood ratio tests for fixed effects of power-transformation yearling pulmonary arterial pressure (PAP) of Angus cattle managed at high altitude in each sex category (elevation at 2,170 m) ... 82 Table 3.6: Results of log-likelihood ratio tests for fixed effects of three-category yearling pulmonary arterial pressure (PAP) of Angus cattle managed at high altitude in each sex category (elevation at 2,170 m) ... 83 Table 3.7: Results of log-likelihood ratio tests for fixed effects of two-category yearling pulmonary arterial pressure (PAP) of Angus cattle managed at high altitude in each sex category (elevation at 2,170 m) ... 83 Table 3.8: Heritability, genetic correlation (above diagonal) and residual correlation (below diagonal) among non-transformed, power-transformed and categorical yearling PAP of Angus cattle managed at high altitude (elevation at 2,170 m) ... 83
Table 3.9: Results of Pearson (above diagonal) and Rank (below diagonal) correlations among EBV of raw, continuous transformed and categorical transformed pulmonary arterial pressure (PAP) records of Angus cattle managed at high altitude (elevation at 2,170 m) ... 88 Table 3.10: Summary of accuracy from univariate model for each form of yearling pulmonary arterial pressure (PAP) phenotypes of Angus cattle managed at high altitude (elevation at 2,170 m) ... 89 Table 3.11: Heritability, genetic variance and genetic correlation (above diagonal) between
non-transformed PAP measurements of heifer, bull and steer Angus cattle managed at high altitude (elevation at 2,170 m) ... 94 Table 3.12: Heritability, genetic variance and genetic correlation (above diagonal) between power-transformed pulmonary arterial pressure measurements of heifer, bull and steer Angus cattle managed at high altitude (elevation at 2,170 m) ... 95 Table 3.13: Heritability, genetic variance and genetic correlation (above diagonal) between three-category pulmonary arterial pressure phenotype of heifer, bull and steer Angus cattle managed at high altitude (elevation at 2,170 m) ... 95 Table 3.14: Heritability, genetic variance and genetic correlation (above diagonal) between
two-category pulmonary arterial pressure phenotype of heifer, bull and steer Angus cattle managed at high altitude (elevation at 2,170 m) ... 95 Table 3.15: Log likelihood ratio test for sex effects of four yearling pulmonary arterial pressure phenotypes of Angus cattle managed at high altitude (elevation at 2,170 m) ... 95 Table 3.16: Pearson (above diagonal) and rank (below diagonal) correlations between estimated breeding value from non-transformed pulmonary arterial pressure measurements of all animals, heifer, bull and steer Angus cattle managed at high altitude (elevation at 2,170 m) ... 97 Table 3.17: Pearson (above diagonal) and rank (below diagonal) correlations between estimated breeding value from power transformed pulmonary arterial pressure measurements of all animals, heifer, bull and steer Angus cattle managed at high altitude (elevation at 2,170 m) ... 97 Table 3.18: Pearson (above diagonal) and rank (below diagonal) correlations between estimated breeding value from three-category pulmonary arterial pressure phenotype of all animals, heifer, bull and steer Angus cattle managed at high altitude (elevation at 2,170 m) ... 98 Table 3.19: Pearson (above diagonal) and rank (below diagonal) correlations between estimated breeding value from two-category pulmonary arterial pressure phenotype of all
Table 4.1: Summary statistics of performance traits and associated ages in Angus cattle managed at high altitude (elevation at 2,170 m) ... 105 Table 4.2: Results of log-likelihood ratio tests of fixed effects for performance traits in Angus cattle at high altitude (elevation range from 2,170 m to 2,740 m) ... 111 Table 4.3: Genetic correlations between yearling pulmonary arterial pressure phenotypes and performance traits of Angus cattle managed at high altitude (elevation at 2,170 m) ... 112 Table 4.4: Genetic correlation between growth traits and non-transformed pulmonary arterial pressure (PAP) phenotypes in different sex categories of Angus cattle managed on high altitude (elevation at 2,170 m) ... 116 Table 4.5: Genetic correlation between growth traits (categorical data) and power-transformed pulmonary arterial pressure (PAP) phenotype of different sex categories of Angus cattle managed on high altitude (elevation at 2,170 m) ... 116 Table 4.6: Genetic correlation between growth traits and three-category pulmonary arterial pressure (PAP) phenotype of different sex categories of Angus cattle managed on high altitude (elevation at 2,170 m) ... 116 Table 4.7: Genetic correlation between growth traits and two-category pulmonary arterial pressure (PAP) phenotype of different sex categories of Angus cattle managed on high altitude (elevation at 2,170 m) ... 116 Table 4.8: Heritability, genetic variance, genetic correlation (above diagonal) and residual correlation (below diagonal) between performance traits of Angus cattle managed on high altitude (elevation at 2,170 m) ... 118 Table 4.9: Comparison of EBV accuracies from univariate two multivariate models for
non-transformed pulmonary arterial pressure (PAP) phenotype of Angus cattle managed at high altitude (elevation at 2,170 m) ... 120 Table 4.10: Comparison of EBV accuracies from univariate two multivariate models for power transformed pulmonary arterial pressure (PAP) phenotype of Angus cattle managed at high altitude (elevation at 2,170 m) ... 121 Table 4.11: Comparison of EBV accuracies from univariate two multivariate models for
three-category pulmonary arterial pressure (PAP) phenotype of Angus cattle managed at high altitude (elevation at 2,170 m) ... 121 Table 4.12: Comparison of EBV accuracies from univariate two multivariate models for
two-category pulmonary arterial pressure (PAP) phenotype of Angus cattle managed at high altitude (elevation at 2,170 m) ... 121
Table 5.1: Genomic windows explaining > 1% genetic variation of non-transformed pulmonary arterial pressure (PAP) measurements of yearling Angus cattle from Beef Improvement Center of Colorado State University (elevation at 2,170 m) ... 139 Table 5.2: Genomic windows explaining > 1% genetic variation of three-category pulmonary arterial pressure (PAP) measurements of yearling Angus cattle from Beef Improvement Center of Colorado State University (elevation at 2,170 m) ... 144 Table 5.3: Genomic windows explaining > 1% genetic variation of two-category pulmonary arterial pressure (PAP) measurements of yearling Angus cattle from Beef Improvement Center of Colorado State University (elevation at 2,170 m) ... 150 Table 5.4: Significance, estimate least square means (s.e.) of each genotype, and estimated additive and dominant effects of lead-SNP on EBV of yearling pulmonary arterial pressure (PAP) phenotypes in Angus cattle managed at high altitude (elevation at 2,170 m) ... 154 Table 5.5: Pearson (above diagonal) and Rank (below diagonal) correlations between
genome-wide SNP effect of three yearling pulmonary arterial pressure (PAP) phenotypes of Angus cattle at high altitude regions ... 156 Table 5.6: Common top 2% (N=52) windows across non-transformed (RAW), three-category (CAT3) and two-category (CAT2) pulmonary arterial pressure phenotypes of Angus cattle managed at high altitude (elevation at 2,170 m) ... 158 Table 5.7: Significant gene ontology (GO) terms from gene enrichment analysis on genes within identified concordant 1-Mb windows with genome-wide association studies across yearling PAP phenotypes of Angus cattle managed at high altitude (elevation at 2,170) ... 159 Table 5.8: Summary of genes located in common genomic windows from genome-wide association study of yearling PAP phenotypes of Angus cattle at high altitude (elevation at 2,170 m) ... 162 Table 6.1: Summary of EBV and deregressed EBV of performance traits of genotyped Angus cattle managed at high altitude region (elevation at 2,170 m) ... 181 Table 6.2: Pleiotropic QTL 1-Mb windows associated with performance traits of Angus cattle managed at high altitude (elevation at 2,170 m) ... 186 Table 6.3: Genomic windows explaining > 1% genetic variation of birth weight of Angus cattle managed at high altitude (elevation at 2,170 m) ... 188 Table 6.4: Genomic windows explaining > 1% genetic variation of weaning weight of yearling Angus cattle managed at high altitude (elevation at 2,170 m) ... 190
Table 6.5: Genomic windows explaining > 1% genetic variation of maternal weaning weight (MILK) of Angus cattle managed at high altitude region (elevation at 2,170 m) ... 193 Table 6.6: Genomic windows explaining > 1% genetic variation of post-weaning gain of Angus cattle managed at high altitude region (elevation at 2,170 m) ... 193 Table 6.7: Genomic windows explaining > 1% genetic variation of yearling weight of Angus cattle managed at high altitude region (elevation at 2,170 m) ... 194 Table 6.8: Significant gene ontology (GO) terms from gene enrichment analysis on genes in identified in pleiotropic genomic windows ... 202 Table 7.1: Pleiotropic QTL windows associated with yearling pulmonary arterial pressure (PAP) and performance traits of Angus cattle managed at high altitude (elevation at 2,170 m) ... 214 Table 7.2: Significant gene ontology (GO) terms from gene enrichment analysis on genes in identified pleiotropic windows across PAP phenotypes and performance traits in Angus cattle managed at high altitude (elevation at 2,170 m) ... 216 Table 7.3: Pearson correlations between SNP effects of yearling pulmonary arterial pressure phenotypes (PAP) and performance traits in association weight matrix (above diagonal) and all studied SNP (below diagonal) ... 217
LIST OF FIGURES
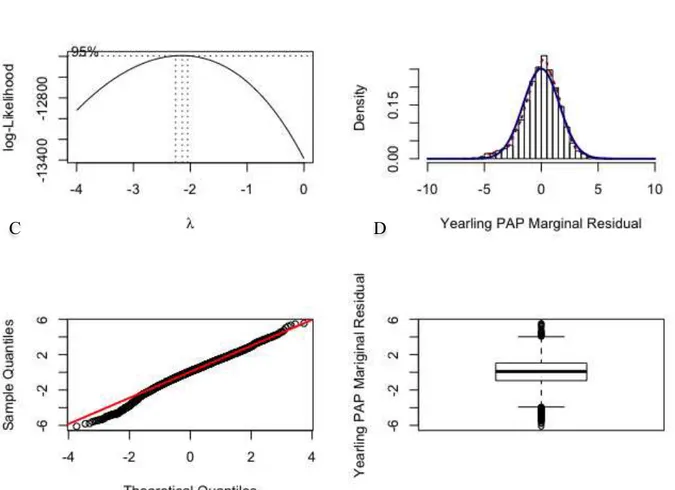
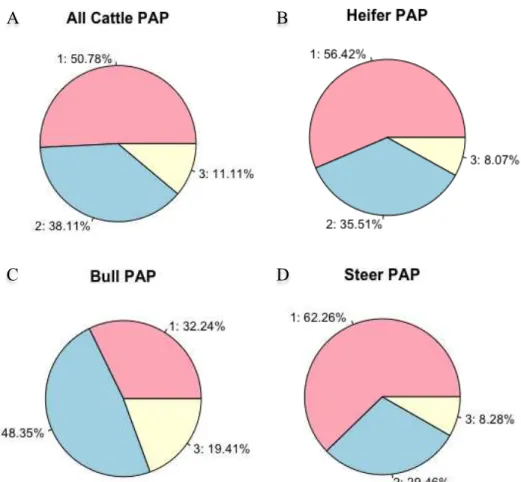
Figure 2.1: Relationship between mean pulmonary arterial pressure and age in natives with normal health who live at a high altitude, at 4540 m (solid line), compared to the data reported for sea level residents (dashed line; the numbers in parenthesis indicate the number of cases). ... 18 Figure 2.2: Genetic trend for pulmonary artery pressure (PAP) in Angus cattle at the Tybar Ranch (Tybar) and the CSU John E. Rouse Beef Improvement Center (BIC) since selection with EPD began in 1992 in Tybar) and 2002 in BIC ... 28 Figure 2.3: General iterative steps in model building, but these steps are not always clearly separable. These steps can be used by both modeler and end-user ... 33 Figure 3.1: Histogram of (A) original measurements and (B) associated marginal residuals, and (C) Q-Q plot and (D) boxplot of residuals of yearling pulmonary arterial pressure (PAP) ... 75 Figure 3.2: (A) Box-Cox analysis result, (B) histogram, (C) Q-Q plot and (D) boxplot of residuals of the power-transformed (λ = -2) yearling pulmonary arterial pressure (PAP) measurements ... 76 Figure 3.3: Proportion of calves in each of the three phenotypic categories based on all, heifer, bull and steer pulmonary arterial pressure (PAP) measurements. 1: (PAP < 41mmHg) ; 2: (41mmHg <= PAP <= 49 mmHg); 3: (PAP > 49 mmHg) ... 78 Figure 3.4: Genetic trends and associated regression lines and equations across year from 1993 to 2015 from raw yearling pulmonary arterial pressure (PAP) (A), power-transformed yearling PAP (B), and three-category (C) and two-category (D) phenotypes. ... 90 Figure 3.5: Genetic trends and associated regression lines across year from 1993 to 2015 of animals from all sires (All), the registered external sires (OUT), the CSU-BIC sires (BIC), and the partial CSU-BIC sires (Partial_BIC) from original yearling pulmonary arterial pressure measurements in Angus cattle managed at high altitude (elevation at 2,170 m) ... 92 Figure 5.1: Manhattan plots of proportion of genetic variance explained by 1-Mb windows from genomic wide association study of deregressed EBV from A) non-transformed PAP; B) three-category; C) two-category yearling pulmonary arterial phenotypes of Angus cattle managed at high altitude (elevation at 2,170 m) with the line reprenting 1% of genentic variation ... 137
Figure 5.3: Signaling mechanisms underlying sustained hypoxic pulmonary vasoconstriction (HPV) ... 166 Figure 6.1: Manhattan plot of proportion of genetic variance explained by 1-Mb windows from genome-wide association study of deregressed EBV of birth weight in Angus cattle managed at high altitude (elevation at 2,170 m) with the line representing the 1% of the genetic variation ... 183 Figure 6.2: Manhattan plot of proportion of genetic variance explained by 1-Mb windows from genome-wide association study of deregressed EBV of weaning weight in Angus cattle managed at high altitude (elevation at 2,170 m) with the line representing the 1% of the genetic variation ... 183 Figure 6.3: Manhattan plot of proportion of genetic variance explained by 1-Mb windows from genome-wide association study of deregressed EBV of maternal weaning weight (MILK) in Angus cattle managed at high altitude (elevation at 2,170 m) with the line representing the 1% of the genetic variation ... 184 Figure 6.4: Manhattan plot of proportion of genetic variance explained by 1-Mb windows from genome-wide association study of deregressed EBV of post-weaning gain in Angus cattle managed at high altitude (elevation at 2,170 m) with the line representing the 1% of the genetic variation ... 184 Figure 6.5: Manhattan plot of proportion of genetic variance explained by 1-Mb windows from genome-wide association study of deregressed EBV of yearling weight in Angus cattle managed at high altitude (elevation at 2,170 m) with the line representing the 1% of the genetic variation ... 185 Figure 7.1: Comparison of genetic correlations and SNP-based correlations across eight phenotypes ... 218
LIST OF EQUATIONS
Equation 3.1: Log-likelihood test ... 69 Equation 3.2: Nagelkerke R2 calculation ... 69 Equation 3.3: Bivariate linear and threshold animal models used to estimate genetic correlation between various yearling PAP phenotypes ... 70 Equation 3.4: Standard normal distribution curve of liability for threshold model analysis ... 70 Equation 3.5: Multivariate linear and threshold animal models used to estimate genetic correlation between yearling PAP phenotypes in bulls, heifers and steers ... 71 Equation 3.6: Two-sample z test for the significant of difference between estimated heritabilities ... 72 Equation 3.7: Calculation of Beef Improvement Federation accuracy from prediction error and genetic variance ... 72 Equation 4.1: Multivariate linear and threshold animal models used to estimate genetic correlation between each yearling PAP phenotype and birth weight, weaning weight, maternal weaning weight and post-weaning gain ... 106 Equation 4.2: Bivariate linear and threshold animal models used to estimate genetic correlation between each yearling PAP phenotype and yearling weight ... 108 Equation 4.3: Multivariate linear animal models used to estimate genetic parameters for birth weight, weaning weight, maternal weaning weight and post-weaning gain ... 109 Equation 5.1: Calculation of reliability of each animal using prediction error and genetic variance ... 127 Equation 5.2: Final formula to develop of deregressed EBV free of parents average for each animal ... 127 Equation 5.3: Final formula to develop accuracy of de-regressed EBV free of parents average for each animal ... 127 Equation 5.4: Calculation of right-hand-side element pertaining to a individual i (
γi
*) for
developing deregressed EBV ... 127 Equation 5.5: Calculation of the unknown information of the individual i (Z' Z ) for develop
de-Equation 5.6: Calculation of the unknown information of the unknown information content of the parent average of individual i (
ZPA' ZPA) for develop deregressed EBV ... 128 Equation 5.7: Calculation of scaled weight of each individual to be used in analysis to address heterogeneous of deregressed EBV ... 128 Equation 5.8: Mixed model for executing GWAS on each yearling PAP phenotype ... 130 Equation 5.9: Calculation of additive effect of single SNP on a specific trait ... 132 Equation 5.10: Calculation of dominant effect of single SNP on a specific trait ... 132
CHAPTER 1 INTRODUCTION
1.1 Background
There is economic relevance to high altitude disease (HAD), with an incidence of 3% to 5% typically in native cattle managed at high altitude (Holt and Callen, 2007), and about 10% to 40% of cattle when they were moved from low altitude to high altitude (Grover et al., 1963, Will et al., 1970). Therefore this disease would lead to economic loss in high altitude states such as Colorado, New Mexico, Utah and Wyoming in the United States.
High altitude disease in humans and animals is a consequence of response to hypoxia in high altitude. In response to alveolar hypoxia, the pulmonary artery constricts resulting in hypertension, right heart ventricular hypertrophy, vascular remodeling, and death from congestive heart failure (Holt and Callan, 2007). Therefore, pulmonary hypertension is one of the important characteristics for HAD, and it is typically diagnosed using measurement of pulmonary arterial pressure (PAP). The measurement of PAP has been used as indicator trait for selection against HAD, and reported to be moderately heritable in cattle (with heritability ranging from 0.25 to 0.46; Enns et al., 1992; Shirley et al., 2008; Crawford et al., 2016). Previous results were based on the PAP measures without studying the data structure and potential transformation needs, or the potential genetic differences among PAP measures at different environments (e.g. age and sex). However, violation of model assumptions may influence the analyses and results (Maas and Hox, 2004; Nimon, 2012;), and different genetic structure of PAP may be associated with different environmental situations (Holt and Callen, 2007; Zeng et al.,
Based on physiological studies of HAD and PAP, animal frame, weights, and obesity could be somehow related to the PAP measurements and susceptibility of HAD (Koda et al., 2007; Neary 2013). Therefore, the PAP measurements and susceptibility of HAD may be genetically related to performance traits in cattle (e.g. birth weight (BWT), weaning weight (WW), yearling weight, etc.). Crawford et al. (2016) reported low but non-zero (0.19 to 0.24) genetic correlations between PAP and pre-weaning growth traits (i.e. BWT and WW), and moderate genetic correlations between them were also previously observed (Shirley et al., 2008). This suggested the potential improvement in genetic prediction of PAP with using correlated performance traits in multi-variate models.
With the advance in molecular genetic techniques and statistical methods, genome-wide association study (GWAS) has been successfully executed to detect associations between single-nucleotide polymorphisms (SNP) and traits. Moderate heritability of PAP measurements provided us the potential to identify its QTL. Identification of QTL could help studying hypoxia-induced pulmonary hypertension in both human and animals and improve selection of cattle against HAD. Also, the concordances observed in GWAS of PAP and performance traits can help us explore genes influencing both PAP and performance traits. However, there are few published GWAS of PAP, except for unpublished works and proceeding papers from Animal Breeding and Genetics group in Colorado State University based on non-transformed and log10-transformed PAP phenotypes.
The true genetic merit observed among unrelated animal in the absence of selection is an ideal training population data for genomic selection (Garrick et al., 2009). However, true breeding values are not available in practice, and the estimate of true breeding value (EBV) of an individual is usually calculated using the data of related animals. The EBV estimated from this
procedure is a shrinkage estimator of true breeding value and could introduce family relatedness into the GWAS. Family relatedness can reduce the power and increase the false positive rate of QTL identification in GWAS. Therefore, deregressed estimated breeding value (DEBV), with removing the parent average and un-shrinking estimates appeared to be the most appropriate response variable for GWAS of PAP.
1.2 Objectives
The goal of this dissertation effort is to study data structure, estimate EBV and conduct DEBV based GWAS of PAP using data from a herd of Angus cattle at CSU Beef Improvement Center (CSU-BIC; One Bar Eleven, Rouse Ranch in WY) located at elevation of 2,170 m. This herd has bred Angus cattle for high altitude adaptability for more than 50 years through phenotypic and genetic selection (from year of 2002) on PAP. The breeding program also cooperates with AI companies by progeny testing the PAP genetic merit of bulls via breeding cows of this herd with semen from outside AI sires. The goal of this doctoral study is achieved through the following objectives:
1. Study the phenotypic and genetic characteristics of yearling PAP measurements.
This part investigated distribution of yearling PAP phenotype, tested the fixed effects and estimated the genetic parameters of yearling PAP in alternative phenotypic forms, and inspected the sex’s influence on genetic parameters of yearling PAP phenotypes. The information helped explore the potential violation of modeling assumptions and its influence on genetic analysis, develop models for yearling PAP phenotypes and determine the phenotypic form of yearling PAP to be used in genetic evaluation.
2. Investigate the genetic relationship between yearling PAP measurements and
performance traits. Genetic correlations were estimated between performance traits (i.e.
BWT, WW, PWG and YW) and the various yearling PAP phenotypes (i.e. continuous and categorical scale). The genetic correlation between performance traits and yearling PAP phenotypes in different sex categories (i.e. bull, heifer and steer) were also examined. These analyses provided information needed to construct the multivariate models to be used in genetic evaluation of yearling PAP phenotypes and obtained the EBV from the most appropriate model.
3. Conduct GWAS on various yearling PAP phenotypes using deregressed EBV. This part identified genomic windows (1-Mb QTL) for each yearling PAP phenotype. The DEBV of various yearling PAP phenotypes were developed from the EBV and used as dependent variable in GWAS. The concordant genomic windows across alternative yearling PAP phenotypes were also studied. Candidate genes (located in identified genomic window regions) associated with yearling PAP phenotypes were also identified and studied.
4. Conduct GWAS of performance traits using deregressed EBV. Estimated breeding values of performance traits (i.e. BWT, WW, PWG, YW) from multivariate models, and developed DEBV for GWAS from them. The DEBV were used to conduct GWAS and locate the genomic window (1-Mb QTL) associated with each of the performance trait and identify the concordant QTL windows across performance traits.
5. Study the SNP-based genetic relationship between yearling PAP phenotypes and
performance traits. This section identified the concordant genomic regions and genes
of yearling PAP phenotypes and performance traits from GWAS. An association weight matrix (Reverter and Fortes, 2013) was constructed based on estimated SNP effects to calculate the SNP-based genetic correlations between yearling PAP phenotypes and performance traits. These SNP-based correlations were compared with the estimated genetic correlations from traditional pedigree-based quantitative genetic methods to assess the relationship between the two types of genetic data.
LITERATURE CITED
Crawford, N. F., M. G. Thomas, T. N. Holt, S. E. Speidel, and R. M. Enns. 2016. Heritabilities and genetic correlations of pulmonary arterial pressure and performance traits in Angus cattle at high altitude. J. Anim. Sci. doi:10.2527/jas.2016-0703
Enns, R. M., J. S. Brinks, R. M. Bourdon and T. G. Field. 1992. Heritability of pulmonary arterial pressure in Angus cattle. In Proc. West. Sect. Am. Soc. Anim. Sci. 43:111-112. Fortes, M. R. S., A. Reverter, S. H. Nagaraj, Y. Zhang, N. N. Jonsson, W. Barris and R. J.
Hawken. 2011. A single nucleotide polymorphism-derived regulatory gene network underlying puberty in 2 tropical breeds of beef cattle. J. Anim. Sci. 89:1669-1683.
Garrick, D. J., J. F. Taylor and R. L. Fernando. 2009. Deregressing estimated breeding values and weighting information for genomic regression analyses. Genet Sel Evol. 41:44. Grover, R. F., J. T. Reeves, D. H. Will, and S. G. Blount. 1963. Pulmonary vasoconstriction in
steers at high altitude. J. Appl. Physiol. 18:567-574.
Holt, T. N. and R. J. Callan. 2007. Pulmonary arterial pressure testing for high mountain disease in cattle. Vet Clin N Am-Food A. 23:575-596.
Koda, M., M. Sulkowska, L. Kanczuga-Koda, E. Surmacz, E. and S. Sulkowski. 2007. Overexpression of the obesity hormone leptin in human colorectal cancer. J. Clin. Pathol. 60:902-906.
Maas, C. J. and J. J. Hox. 2004. The influence of violations of assumptions on multilevel parameter estimates and their standard errors. Comput. Stat. Data Anal. 46:427-440. Neary, J. M. 2013. Pre-weaned beef calf mortality on high altitude ranches in Colorado. Master’s
Thesis. Colorado State University.
Nimon, K.F., 2012. Statistical assumptions of substantive analyses across the general linear model: a mini-review. Front. Psychol. 3:1-5.
Reverter, A. and Fortes, M.R., 2013. Association weight matrix: a network-based approach towards functional genome-wide association studies. Genome-Wide Association Studies and Genomic Prediction. 437-447.
Shirley, K. L., D. W. Beckman and D. J. Garrick. 2008. Inheritance of pulmonary arterial pressure in Angus cattle and its correlation with growth. J. Anim. Sci. 86:815-819.
Will, D. H., J. L. Hicks, C. S. Card and A. F. Alexander. 1975. Inherited susceptibility of cattle to high-altitude pulmonary hypertension. J. Appl. Physiol. 38:491-494.
Zeng, X, R. M. Enns, S. E. Speidel and M. G. Thomas. 2015. Angus Cattle at High Altitude: Relationship Between Age and Pulmonary Arterial Pressure. In Proc. West. Sec. Am. Soc. Anim. Sci. 66:119–121.
CHAPTER 2 LITERATURE REVIEW
2.1 Introduction
In high altitude states such as Colorado, Wyoming, New Mexico, and Utah, hypoxia-induced bovine pulmonary hypertension (PH) commonly referred to as “brisket disease” or “high altitude disease (HAD)”, has been observed within the cattle industry (Holt and Callen, 2007). Glover and Newsome (1915) first studied this disease in cattle as to advise Colorado and New Mexico stockman to protect their herds. Because HAD is highly economically relevant, it has been studied by agriculture scientists for a century. These studies coved multiple aspects of the disease, including physiology, pathology, genetics and now “omics” areas (i.e. Genomics, transcriptomics, proteomics and metabolomics). Due to the close physiological relationship between HAD and pulmonary arterial pressure (PAP), this measurement has been used as an indicator trait for studying HAD. This section reviewed the factors, methods and previous reports discussing HAD and PAP. The contents of these reviews included economic aspect of HAD, physiology of HAD, the relationship between PAP and HAD, factors influencing HAD or PAP, genetics and “omics” information of HAD and PAP.
2.2 Economics
There is a economic relevance to HAD, since it is a major cause of calf morbidity for beef cattle ranches and feedyards above 1500 m (Hecht et al., 1962; Jensen et al., 1976). Williams et al. (2012) reported HAD (or Bovine PH) attributed to an estimated $60 million loss each year in
producer losing 20% of his 600 calves between summer turnout and weaning, which equates to $78,864 of lost potential income based on a market price of $1.24/lb. live weight (November 7th 2011) and the herd average weaning weight in 2009 (529.8± 72.4lbs; Neary, 2013). Cattle native to high altitude may be more resistant to HAD than cattle that originally lived at low altitude due to natural and artificial selection (Will et al., 1975). These long-term selections would produce cattle that are adapted to high altitude environment and resistant to HAD (Qiu et al., 2012). The general incidence of HAD was 3% to 5% typically in native cattle (Holt and Callen, 2007), whereas 10% to 40% of non-native cattle developed HAD when they were moved from low altitude to high altitude (Grover et al., 1963, Will et al., 1970). It should be note that reports on HAD are limited due to the fact that beef production system in mountain terrain are extensive cow/calf operation.
2.3 Physiology of HAD
Alexander and Jenson (1959, 1963) reported that, hypoxia in regions of high elevation is the major cause of HAD. As altitude increased, although the proportion of oxygen in the air is the same at all altitudes, the barometric pressure falls (Peacock, 1998). The reduction in barometric pressure causes a corresponding drop in partial pressure of oxygen, which results in less oxygen reaching the lungs and pulmonary artery, sequentially leading to the hypoxia in the lungs (Peacock, 1998).
Due to the hypoxia, some areas of the lung are poorly oxygenated. This leads to vasoconstriction in the pulmonary distal vessel as to distribute the blood away from poorly oxygenated areas within the lung to the areas that better oxygenated (Neary, 2014). The closure of some pulmonary capillaries causes the increased pressure in pulmonary capillaries and the
primary pulmonary artery. If an animal stays in a hypoxic condition for longer than 3 weeks, a remodeling process begins in the pulmonary artery. Specifically, The smooth muscle growth in the pulmonary arteriole wall leads to vascular hypertrophy and thickening of the medial layers of the pulmonary arterioles (medial hypertrophy, Stenmark et al., 2006). Vascular remodeling leading to loss of peripheral pulmonary arteries contributes to increased pulmonary vascular resistance. In early stages of remodeling, a combination of events (e.g. pulmonary vasoconstriction, pulmonary remodeling and unchanged cardiac output) causes the increase in PAP and significant PH, which makes it harder for the right ventricle to pump the same amount of blood through the lung in the later stage (Holt and Callen, 2007; Neary, 2014). This leads to changes in cardiac function: right ventricular hypertrophy, followed by right ventricle dilation, and finally right congestive heart failure. In addition, Holt and Callen (2007) described the increased vascular hydrostatic pressure (intravascular hypertension) causes ventral edema in the brisket region and the loss of fluid into the extra vascular space. Therefore, HAD is usually characterized by the presence of ventral edema in the brisket region (i.e. Brisket Disease).
In order to adapt to PH, a complex physiological process happens in right ventricle (Vonk-Noordegraaf et al., 2013). Generally, PH increases right ventricle wall stress, which leads to the ischemia, mitochondrial remodeling, neurohormonal and immunological activation, and sequentially causes myocardial remodeling. Hypertrophy and matrix remodeling from the myocardial remodeling can increase right ventricle contractility to adapt to the increased PAP. There are two patterns of ventricular remodeling on the basis of morphometric and molecular characteristics: adaptive and maladaptive remodeling. Adaptive remodeling preserves systolic and diastolic function, whereas maladaptive remodeling is associated with unhealthy systolic and
dilatation and failure. The right heart failure is the eventual clinical characteristic of HAD, and ultimately may lead to the death of the animal.
High altitude disease in human is classified into four categories although they are all associated with elevated PAP and PH: acute mountain disease, high-altitude pulmonary edema, high-altitude cerebral edema or chronic mountain sickness (Jin et al., 2009; Luo et al., 2014). These classifications depend on the duration, stage and level of severity of the high altitude disease. In addition, an acclimatization processes is also involves in the development of HAD (Vonk-Noordegraaf et al., 2013; Luo et al., 2014).
Several physiology responses can be initiated in the human or animal during high altitude acclimatization, and the acclimatization is a comprehensive effect of various organ systems. This process includes: elevated ventilation leading to a rise in arterial oxygen saturation; pulmonary vasoconstriction, a mild diuresis and contraction of plasma volume leading to more oxygen per unit of blood; elevated blood flow and cardiac output; and greater hemoglobin mass and red blood cells (Chawla and Saxena, 2014; Julian et al., 2009). In addition, molecular responses regulate many physiological processes to defend hypoxia. For instance, the up-regulation of hypoxia inducible factor 1 (HIF-1) expression regulates the genes involved in glucose uptake, glycolysis, metabolism, pH balance, angiogenesis, erythropoiesis to help human and animal adapt hypoxia environment (Chawla and Saxena, 2014).
Although physiology mechanisms for acute mountain sickness, high-altitude pulmonary edema and high-altitude cerebral edema remain elusive, they generally occur between the initial hypoxia exposure and the onset of acclimatization (optimal acclimatization takes days to weeks, or perhaps months) and associated with elevated PAP and PH (Imray et al., 2010). The acute mountain sickness, high-altitude pulmonary edema and high-altitude cerebral edema have similar
the same pathophysiology and considered to represent different points along a single spectrum of a same disease, and high-altitude pulmonary edema and high-altitude cerebral edema are considered more serious form of acute mountain sickness (Bärtsch and Bailey, 2014). These diseases were only caused by hypoxia, and it was associated with the general mechanism described above. The HAPE contributes to the increased pressure and damages of pulmonary capillary and lung alveolar (Maggiorini et al., 2001). Under hypoxia, in order to satisfy the oxygen requirement of brain, the cerebral blood flow elevates to bring more oxygen to the brain, which may increase blood-brain barrier permeability or cerebral vascular permeability (Bärtsch and Bailey, 2014). This can be a mechanism observed in high-altitude cerebral edema.
The chronic mountain sickness is a disease that develops after spending an extended time (years) living at high altitude (> 3,000 meter), and it is an important high-altitude disease in mountain regions (León-Velarde et al., 2010). The chronic mountain sickness of humans and animal results from the loss of capacity to adapting hypoxia (developed thicken pulmonary arteries), which was related to age, disease (e.g. lung diseases and obesity), unhealthy behavior (e.g. smoking) and contamination (Penaloza and Arias-Stella, 2007; Jin et al., 2009). All these factors can incorporate the hypoxia on high altitude to cause alveolar hypoventilation (Jin et al., 2009). Beside PH, this disease was also characterized by excessive erythrocytosis with the typical symptoms of polycythemia, hypoxemia, breathlessness, palpitations, sleep disturbances, cyanosis, venous dilatation, headaches, tinnitus, and dizziness (Jiang et al., 2014). The level of erythrocytosis is used to define the CMS (Jiang et al., 2014; Villafuerte et al., 2014). The mechanism of CMS is different from AMS, HAPE or HACE, which may explain the large difference of the HAD case rate in high altitude native cattle and cattle that relocated from low
2.4 Relationship between PAP and HAD
Increased PAP is a direct outcome of all types of PH and HAD. As a physiological indicator of PH, PAP measurements have been used to assist selection of cattle to reduce the incidence of HAD in recent decades in high altitude regions. Holt and Callen (2007) provided guidelines to help breeders make selection decisions using PAP phenotypes to reduce risk of HAD in high altitude beef production systems (Table 2.1). Producer reports collected in veterinary health studies suggest that, in some cases, low PAP cows should have significantly reduced the incidence of HAD within their calf crop (Neary, 2013). However, elevated PAP dose not necessary lead to the consequences of HAD (e.g. death and brisket edema). Holt (Personal communication, 2015) described that a bull of normal healthy at high altitude region (>2,300m in elevation), although his measured PAP measurement was larger than 100 mmHg. Neary (2013) also described that reports from some producers showed that the selection on low PAP has minimum influence on reducing the mortality of pre-weaned beef calves. The actual genetic relationship between PAP and HAD has not been described because of the difficulty to obtain data on the incidence of HAD. Therefore, additional studies should be conducted to understand that genetic selection on low PAP would reduce the chance of cattle for developing HAD. Genomic studies could be effective methodology to genetically tie up HAD and PAP via identifying common genes and pathways associated with both HAD and elevated PAP.
Table 2.1. Evaluation of pulmonary arterial scores1
PAP Interpretation
30 – 35 mmHg This score is considered excellent and highly reliable. 36 – 39 mmHg This score is considered excellent for any animal over the
age of 12 months. If the animal is less than 12 months of age, the score is still fairly reliable, but retesting before breeding is suggested.
< 41 mmHg Scores less than 41 mmHg are reliable measurements in all animals more than 12 months of age. It is recommended that yearling cattle have a PAP measurement less than 41 mmHg (depending on altitude of the test). The variation in scores 41 mmHg and above is inconsistent and difficult to predict in some cattle as they age. Any animal measuring 41 mmHg and greater should always be retested before use.
41 – 45 mmHg This range is acceptable for older animals (ie, more than 16 months of age). Animals less than 16 months scoring in this range should be retested to predict the future PAP of the animal accurately.
41 – 45 mmHg This range is acceptable for older animals (ie, more than 16 months of age). Animals less than 16 months scoring in this range should be retested to predict the future PAP of the animal accurately.
45 – 48 mmHg This range is acceptable only for older animals that have been in high elevations for an extended period of time. Animals with this score are more susceptible to environmental stresses leading to HMD and should be considered at some risk. Elevation of test site and where the animal lives must be evaluated closely for those in this PAP score range.
> 49 mmHg Animals that score in this range must always be considered high-risk candidates for developing HMD, not only for themselves but also their offspring. Many animals that have scored in this range have died of HMD. An option for these animals is to move them to a lower elevation for use there. It is also recommended that offspring of these animals never return to high altitude.
1These figures are based on cattle tested at or above 1800 m (6000 ft) and12 months of age or greater. If
2.5 Measurement of PAP
2.5.1 Technical procedure
Pulmonary arterial pressure is a measure of blood pressure found in the primary pulmonary artery. The procedure used to measure PAP in cattle has been used for more than 30 years. This measurement can only be taken by one licensed veterinarian in one herd in order for selection to be more effective, because PAP measures can be influenced by any unprofessional action in the process. With the right equipment and facilities, a veterinarian can take PAP score for a large number of animals daily (about 200 to 300 cattle), which makes PAP a measurable and affordable trait for selection (about $20/head). Pulmonary arterial pressure is measured through a right heart catheterization procedure, which requires jugular venipuncture, catheter insertion and passing flexible catheter tubing through a large bore needle inserted into the jugular vein (Holt and Callen, 2007). The catheter is passed via the jugular vein, through the right atrium, into the right ventricle, and then into the pulmonary artery. Once the catheter is inside the pulmonary artery, the systolic, diastolic and mean blood pressures are recorded from a heart monitor, which is attached to the catheter via a transducer (Ahola et al., 2007; Holt and Callen, 2007).
2.5.2 Calculation of mean PAP
Although the mean PAP can be directly recorded from cardio graphic monitor, it is not directly measured. There are two phase of the arterial pressure: systole and diastole (Fucuta and Little, 2008, Homoud, 2008, PysiologyWeb, 2011). During the systole, blood is ejected from right ventricle to the pulmonary artery, and during the diastole, the heart relaxes, and blood flows from the pulmonary artery into pulmonary circulation. In the systolic phase, the blood pressure
rise during right ventricular ejection after opening of the pulmonary valve, which is followed by a general decrease in pressure while blood is being ejected from the right ventricle until closure of the pulmonary valve. The closure of the pulmonary valve causes a short increase in pressure, which is called dicrotic notch. In the diastolic phase and after the dicrotic notch, PAP decreases as the heart relaxes. The maximum and minimum pressures during cycle of ventricular contraction and relaxation are defined as the systolic and diastolic PAP, which can be directly measured and used to calculate mean PAP (Homoud, 2008, PysiologyWeb, 2011, Chemla et al., 2004). However, the mean PAP is not the simple average of systolic and diastolic PAP. The formula used to calculate the mean PAP is (Homoud, 2008, PysiologyWeb, 2011):
This mathematic formula was constructed based on the duration of systolic and diastolic phases of ventricles. In reality, the ventricles spend one-third (1/3) of their time in systole, and two-thirds (2/3) in diastole. Chemla (2004) reported another formula to approximate the mean PAP using the statistical relationship between mean PAP and systolic PAP. As the mean PAP was highly correlated with systolic PAP, a regression model is suitable for calculate mean PAP form systolic PAP:
The author suggested that mean PAP could be accurately predicted from systolic PAP. The mean PAP used in the regression analysis was defined as the area under the pressure curve divided by the pulse interval, which can also be considered an appropriate measurement.
The PAP measurements (mean PAP, systolic PAP, diastolic PAP) are associated with many
mean PAP = diastolic PAP + (1
3pulse PAP) pulse PAP = systolic PAP − diastolic PAP
(PVR), and mean pulmonary artery wedge pressure (PAWP; or Pulmonary Artery Occlusion Pressure; Chemla, 2002; Klabunde, 2010). Blood pressure is the force of blood against the walls of the arteries as the heart pumps blood throughout the body. Assuming a constant diameter for the pulmonary arteries, the high CO brings more volume of blood and higher force against the arterial wall, which causes higher pressure (Mayet and Hughes, 2003). Less elastic and thicker arterial wall provides more react force to the blood volume and cause higher pressure (Mayet and Hughes, 2003). Like a water pipe, the resistance on one end of an artery can also cause increased pressure inside the artery (Chemla, 2002). Mean PAWP serves as the resistant force in forming mean PAP. Thus, another formula to estimate mean PAP is expressed as (Klabunde, 2010, Chemla, 2002):
mean PAP = (CO × PVR) + mean PAWP
The increase in CO, PVR and PAWP will increase mean PAP. The CO measured the amount of blood the heart pumps through the systemic and pulmonary circulation in a minute (Wingfield and Raffe, 2002). Sufficient CO is needed to sustain blood pressure and supply oxygen to the whole body, and it is influenced by heart rate and stroke volume (Wingfield and Raffe, 2002). The PAWP is an indicator for the left atrial pressure, and its increase causes more resistant for blood flow in pulmonary arteries resulting in higher PAP (Luchsinger et al., 1962). The PVR is the resistance that the blood flow must overcome to go through the pulmonary circulation. Vasoconstriction and vascular remodeling (e.g. cell proliferation) both influence PVR and therefore blood pressure (Elzouki et al., 2012). Generally, the blood flowing through the pulmonary circulation is essentially the same as the blood flowing through the systemic circulation, but the blood pressure in systemic circulation is about 10 times higher than that in pulmonary circulation because the systemic vascular resistance is 10 to 15 times higher than
pulmonary vascular resistance (Klabunde, 2010). The PVR can be estimated using the modification of equation (3) (Griffin et al., 2008; Homoud, 2008).
PVR =
mean PAP − mean PAWP CO
2.6 Environmental factors influencing PAP measurements
The PAP measurements can be influenced by many factors including age, elevation, breed, gender, pregnancy statue, temperature, production level, feed and other diseases (Holt and Callen 2007; Jin et al., 2011; Neary, 2014). In order to understand and use PAP measurements, these factors should always be considered.
2.6.1 Elevation
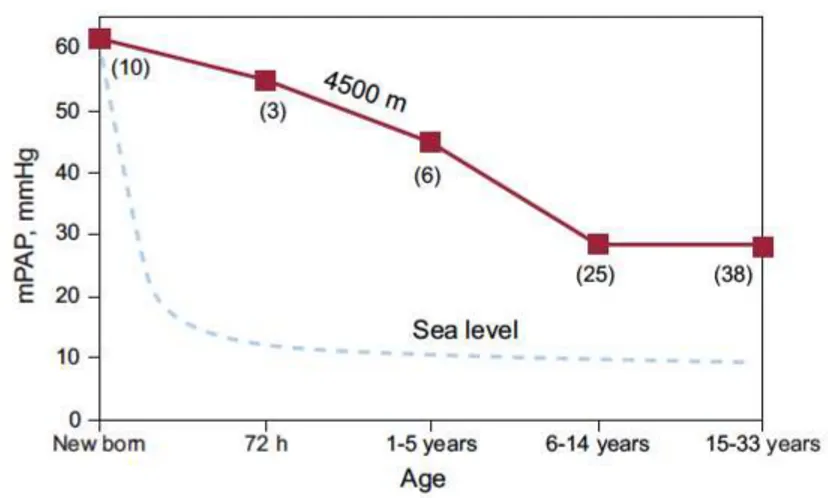
Humbert (2010) reported that important changes in oxygen saturation and PAP occurred with mild and moderate increases of elevation above 3000 m, and elevation degree was inversely related to the level of oxygen saturation and directly related to PAP. Also, PAP measurements were reported to increase 1 to 2 mmHg per 305 m (1000 ft) rise in elevation (Holt and Callen, 2007). In addition, the risk of CHF appeared to increase with rising elevation (Neary, 2014). Penaloza (2012) reported that people (across different ages) residing high altitude had higher PAP than people at sea level (Figure 2.1). Thus, when using PAP in cattle, it is important for ranchers to know the associated elevation of the PAP score.
Figure 2.1 Relationship between mean pulmonary arterial pressure and age in natives with normal health who live at a high altitude, at 4540 m (solid line), compared to the data reported for sea level residents (dashed line; the numbers in parenthesis indicate the number of cases). The mean pulmonary arterial pressure decreases rapidly at sea level; in contrast, in high-altitude natives, the grade of pulmonary hypertension decreases slowly and can persist into adulthood (Penaloza, 2012).
In human, the hypoxia-induced pulmonary response would not be seen until individuals reached an elevation of 1524 m (5000 ft; Aghababian, 2010; Netzer et al., 2013). Venugopalan (2014) indicated that it is difficult to demonstrate significant clinical changes due to hypoxia in people at elevations lower than 3000 m. In order to exclude PH from other illnesses, PAP measurements performed above 1524 m should be used to identify animals that are sensitive to the hypoxic condition. Therefore, PAP measurement would be more accurate and reliable, when the data are collected at higher elevation. Thus, the reliable PAP for studying HAD should be recorded from animals that stayed at regions higher than 1524 m in elevation for at lease three weeks (Holt and Callen, 2007).
2.6.2 Age
Neary (2014) demonstrated that, even at moderate altitude, PAP significantly increased with age among pre-weaned calves. Rhodes (2005) also showed a potential non-linear relationship between incidence of hypoxia-induced PH and age as the majority of hypoxia-induced PH of cattle occurs between birth and 2 years of age. Similarly in humans, it was reported that systolic PAP increased with age regardless of altitude, which would suggest pulmonary vascular remodeling with increasing age (Lam et al., 2009). Badesch et al. (2009) reported that although the mean PAP of rest persons was not different among different age groups, the mean PAP was significant higher in older persons during slight and submaximal exercise. However, Penaloza (2012) reported higher PAP in younger man (Figure 2.1). Therefore, age should always be considered when we use individuals’ PAP measurements.
2.6.3 Gender
Different high PAP incidences were observed in male and female cattle (Holt and Callen), and heifer calves were reported having significantly lower mean PAP than bull calves (Neary, 2014). In this discussion (Neary, 2014), it was illustrated that broiler (male) chickens had significant greater muscular hypertrophy of the pulmonary arteries than hen-chicks when they were raised at an altitude of 3000 m until 4 weeks old. Jin (2010) presented that differences existed between males and females in their response to hypoxia, and CMS and AMS appears to be more frequent in men than women. In addition, gender differences were reported in breath patterns of humans at high altitude that was related to HAD, and males were more sensitive to central sleep apneas than females (Lombardi, 2012).