The Performance of
Socially Responsible
Investments
Are Swedish mutual funds forced to pay a price for
doing good?
MASTER THESIS WITHIN: Business Administration NUMBER OF CREDITS: 15
PROGRAMME OF STUDY: International Financial Analysis AUTHORS: Carl Jönsson Asp & Gordon Molander
Acknowledgements
Special thanks to our supervisor Haoyong Zhou for his advice, support, and guidance during the process of the thesis. We also want to thank our opponent team who during our seminars provided us with excellent critical feedback and suggestions on ways we could improve this paper. Finally, we also wish to express our appreciation to the analyst at Movestic for helping us collect data from their trading terminals.
_______________________ _______________________ Carl Asp Gordon Molander
Master Thesis in Business Administration
Title: The Performance of Socially Responsible Investments – Are
Swedish mutual funds forced to pay a price for doing good? Authors: Carl Asp & Gordon Molander
Tutor: Haoyong Zhou
Date: May 2021
Subject terms: Socially Responsible Investments (SRI), ESG, Mutual Equity Funds, Conventional, Fund performance, Portfolio Analysis.
Abstract
The financial performance of Socially Responsible Investing (SRI) strategies is heavily debated in the modern age. Due to lack of evidence on Swedish SRI performance, Swedish investors are uncertain about placing their financial assets in these strategies as they are afraid expected to sacrifice their financial return for doing good. The purpose of this study is to examine and evaluate the financial and risk-adjusted performance of Swedish registered SRI mutual equity funds compared to conventional mutual equity funds during 2010-2020. The study’s dataset consists of a total of 236 mutual equity funds, with a sample of 133 SRI funds and 103 conventional funds. Financial performance measures used in this study are alpha, estimated through the Carhart four-factor model, and the Sharpe Ratio. The analysis between SRI mutual equity funds and conventional mutual equity funds indicated an insignificant difference in both financial and risk-adjusted performance. Based on the evidence provided, the study concludes that Swedish investors who put ethical, environmental and social values into their investment decision making process do not have to sacrifice their expected financial return, nor will their investment entail a higher degree of risk.
Table of Contents
1. Introduction ... 1 1.1 Problem Discussion ... 2 1.2 Purpose ... 4 1.3 Perspective ... 5 1.4 Delimitations ... 5 2. Frame of Reference ... 62.1 The Foundations of SRI and ESG ... 6
2.2 Mutual Funds ... 8
2.3 Modern Portfolio Theory ... 9
2.3.1 Modern Portfolio Theory and SRI Screening ... 9
2.4 The Nexus Between Stakeholder and Shareholder theory ... 11
2.4.1 Negative Relationship: “The Cost-Concerned School” ... 12
2.4.2 Positive Relationship “The Value-Creation School” ... 13
2.5 Hypotheses... 15
3. Research Methodology & Approach ... 16
3.1 Research Methodology ... 16
3.1.1 Research Approach ... 16
3.1.2 Philosophical Framework ... 17
3.2 Research Approach ... 17
3.2.1 Data collection ... 17
3.2.2 Data sample and the Morningstar Sustainability Rating ... 17
3.3 Asset Pricing Models ... 18
3.3.1 Jensen’s Alpha ... 19
3.3.2 Fama French Three Factor Model ... 19
3.3.3 Carhart Four Factor Model ... 20
3.4 Econometric Model ... 21
3.4.1 Variables ... 21
3.4.2 Linear Regression Model ... 23
3.5 Scientific Criteria ... 24
3.5.1 Validity ... 24
3.5.2 Reliability ... 25
4. Results ... 26
4.1 Overall Performance ... 26
4.2 Performance During the Last 5- and 3 Years ... 29
4.3 Differences Between Low and High Ranked Portfolios ... 30
4.4 Regression summary ... 32
4.5 Statistical Tests ... 33
4.6 Hypotheses Testing ... 34
5 Analysis... 35
5.1 Performance and Risk ... 35
5.2 Rating and Data Implications ... 37
6. Conclusion ... 40 6.1 Research Questions ... 40 6.2 Discussion ... 41 6.3 Future research ... 42 References ... 44 Appendix ... 51
List of Tables
Table 1: The ESG Factors ... 7
Table 2: Summary of Previous Research ... 14
Table 3: Overall Performance and Regression Results (%) ... 27
Table 4: Descriptive Risk-Adjusted and Risk Statistics ... 28
Table 5: Performance and Regression Results (%) ... 29
Table 6: Descriptive Statistics by Rating ... 31
Table 7: Econometric Model... 32
Table 8: OLS Tests ... 33
List of Figures
Figure 1: The Effects of Social Screening on the Universe of Stock Choices ... 10Figure 2: The Cost-Concerned School ... 12
Figure 3: The Value-Creation School ... 13
Figure 4: Morningstar Sustainability Rating ... 18
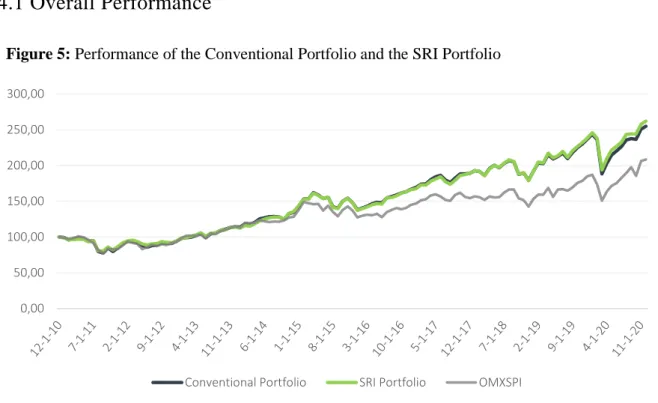
Figure 5: Performance of the Conventional Portfolio and the SRI Portfolio ... 26
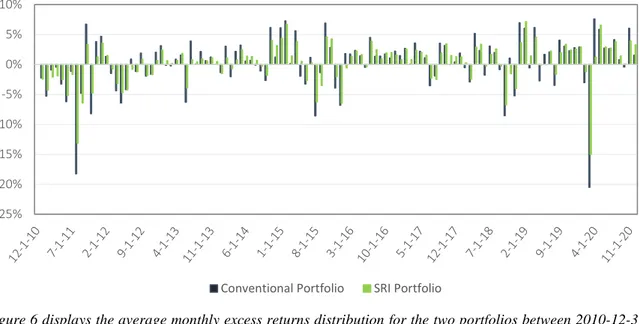
Figure 6: Distribution of Monthly Excess Returns ... 27
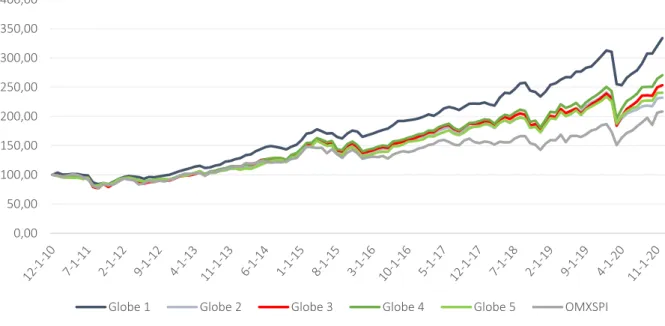
Figure 7: Performance by Rating ... 30
Appendix
Appendix 1: Overview Fund Data ... 51Appendix 2: Fund Sample ... 51
Appendix 3: Regression Output Carhart Alpha ... 56
Appendix 4: Regression Output Sharpe Ratio ... 57
Appendix 5: Jarque-Bera Test Carhart Alpha ... 57
Appendix 6: Jarque-Bera Test Sharpe Ratio ... 58
Appendix 7: Variance Inflation Factors Statistics ... 58
Appendix 8: White Test Statistics Carhart Alpha ... 59
Appendix 9: White Test Statistics Sharpe Ratio ... 59
1. Introduction
This chapter starts with an introduction to the topic of SRI followed by the problem discussion and research questions. The chapter continues with the purpose of the study followed by the perspective and delimitations.
Socially Responsible Investing (SRI) is a relatively new dimension in the financial markets, becoming increasingly popular by investors and recognized in financial research in recent decades. Eurosif (2021) identifies SRI as a long-term investment strategy that integrates Environmental, Social and Governance (ESG) criteria in the security selection process of an investment portfolio. By using this selection criteria, SRI aims to benefit the society while capturing long-term returns for investors. The difference from conventional investments is defined by Miralles-Quiros, Miralles-Quiros and Arrajano (2017) as relative, meaning that only companies that outperform their peers with regards to their individual ESG criteria can be categorized as sustainable. Although the principles of SRI and corporate sustainability have been known for a long time, it is not until recent decades that the need for socially responsible screening of corporate behavior has become exceptionally fashionable.
Due to the need for environmental change, the topic of sustainability is now one of the main points of discussion among professional investors and portfolio managers, as well as for the general public and politicians. Moreover, the number of mutual funds investing in companies that meet a variety of ethical, social and environmental criteria, so called SRI funds, have been growing rapidly worldwide due to the increasing demand by mutual fund investors (Ussif, 2021). According to Joliet and Titova (2018), the incorporation of sustainable criteria into the portfolio selection process among mutual funds may contribute to changes in corporate behavior as companies are afraid to miss out on investments if they are perceived as unethical. Further, the authors define sustainable funds as somewhat subjective as portfolio managers select their securities according to their own specific guidelines or beliefs, which makes the concept of SRI somewhat intangible. The manager’s motive behind their selection could be of any reason, such as personal values or political beliefs. However, most funds managers follow similar guidelines when implementing their SRI screenings.
In 2017, Sweden became one of the first countries to introduce a legislation on sustainability reporting, meaning that every company larger than a certain size1 must establish a sustainability
report that provides information regarding environment, social relationship, employees and human rights (Bolagsverket, 2019). The Swedish SRI market is described by Eurosif (2021) as very mature compared to other markets in Europe, with many large institutions having been active within SRI field for more than ten years. Almost all major fund institutions have some sort of framework for sustainable investing and ESG policies. The Swedish institutions began with exclusion strategies already in the 1980s and have since then expand to more all-encompassing strategies including integration, engagement and voting as part of a holistic approach to integrating ESG factors into the screening process and investment policy.
The Swedish Investment Fund Association (2021) states that Sweden is a world leader in fund saving, where over 80% of the population having their savings in at least one active mutual fund2. Of these people, one third have chosen their fund solely based on its sustainable orientation. As such a large proportion of Swedish investors choose to invest their money in sustainable alternatives, it is compelling to every investor, whether professional or amateur, to examine the performance of this alternative way of investing. To enable a better understanding of the variables examined in this paper, the foundations of SRI and the distinction from conventional funds will be presented in chapter two.
1.1 Problem Discussion
During the last years, questions regarding the financial performance of SRI have risen due to the growing interest in the investment strategy among investors. Consequently, there has been a growing body of academic literature and research on the performance of SRI and whether the investment strategy show inferior or superior performance compared to its conventional peers. A common debate with SRI revolves around the idea that incorporating ESG factors into the screening process will hurt the financial performance. However, the exact relationship is not clearly established as previous research on this topic present various empirical results. Gutsche and Zwergel (2016) state that investors are often deterred from SRI because the strategy is
1 See reference for the specific requirements.
anticipated to deliver inferior returns compared to conventional investments. Though, SRI investors are according to Brzeszcynski and McIntosh (2014), in some cases, willing to accept compromised expected financial returns, if in turn their investments can lead to a better environment with increased social benefits. From a stakeholder's perspective, Porter and Van Der Linde (1995) argue that enhancements of sustainable practices can improve the company’s financial performance, by creating sustainable competitive advantages and increase the effectiveness on resource allocation.
Numerous major studies by Blankenberg and Gottschalk (2018), Humphrey, Lee and Shen (2010) and Dias-Curto and Vital (2014) suggest that there is no significant difference in returns between SRI and conventional investing and that investors who engage in SRI therefore do not have to compromise their expected financial return. Similarly, an extensive study including over 11,000 US domestic mutual funds published by The Morgan Stanley Institute for Sustainable Investing in 2019 found that SRI mutual funds provided returns in line with, if not better than, comparable conventional mutual funds between 2004 to 2018. In addition, statistical evidence showed that SRI mutual funds are more stable during periods of high volatility, i.e., the downside risk was lower for SRI mutual funds compared to their conventional counterpart. Nofsinger and Varma (2014) also shows evidence that US domestic SRI mutual funds limit the downside risk during periods of market instability, but their finding also shows that this comes at the cost of performing worse during non-crisis periods in relation to its conventional peers. The differences were, however, larger during the crisis periods stating that risk-averse investors might value SRI alternatives higher.
Contrarily, there are several other studies that show a significant variation in returns between the two categories. Chang and Doug Witte (2010) contradict Nofsinger and Varma (2014) in their study which shows that sustainable funds generated lower risk-adjusted returns between 2008-2011, a period recognized by high market volatility. According to Renneboog, Ter Horst and Zhang (2008) and Lee, Humphrey, Benson and Ahn (2010), it is the comprehensive screening processes that comes with SRI that decreases investors’ expected returns. Renneboog et al. (2008) states that the use of screenings reduces a fund’s investment options and diversification opportunities, which leads to a higher degree of risk and constrain the risk-return ratio. Lee et al. (2010) further expands that the common viewpoint among investors is that the
imposing of SRI screenings will restrict investors choices regarding the number of available investments. Thus, leading to less efficient portfolios that will consequently have inferior performance than conventional funds. These reasonings imply that mutual funds operating within the SRI screening criteria cannot achieve the same degree of diversification as conventional mutual funds, which in turn leads investors to assume that SRI strategies can only perform worse or equal to conventional funds. However, Sandberg, Juravle, Hedesström and Hamilton (2009) claim that the use of SRI screenings can have various impacts on fund performance as they find that SRI can be a competitive advantage in some, but not all, situations.
Although the research in SRI performance has developed steadily during the 21st century, the evidence to date is mainly sample-specific, which explains the large variation in empirical findings. In addition, almost all the existing literature have examined developed financial markets with focus aimed towards the US and UK markets due to relatively better data availability. To address this critique, new research should extend to unexamined markets. Using this as a motivation, this study examines the difference in performance and risk of Swedish SRI mutual equity funds and conventional mutual equity funds in line with previous research. To the knowledge of the authors, there has not been any major study conducted on the Swedish market, a country known for its environmental awareness and an innovation leader for several clean technologies. Thus, the geographical research gap aims to be filled with this study. Specifically, the study aims to answer the following two questions.
• Do Swedish investors who engage in SRI have to sacrifice their expected financial
returns?
▪ Is there a higher degree of risk associated with Swedish SRI investments?
1.2 Purpose
The purpose of this paper is to compare the risk-adjusted returns and the overall financial performance of Swedish registered SRI mutual equity funds to conventional mutual equity funds during the period 2010-12-31 to 2021-12-31. In order to provide Swedish investors with evidence on the performance of SRI mutual equity funds and interpret the direction in which
the mutual funds are developing, the study will analyse the descriptive statistics over a 5-year and 3-year period.
1.3 Perspective
Due to the lack of evidence on SRI fund performance for Swedish investors, the research will be conducted from the Swedish investor’s perspective when evaluating the financial performance and risk of Swedish registered mutual equity funds.
1.4 Delimitations
This study only considerers Swedish registered mutual equity funds. Further requirements for the fund data are that the funds must report their returns in SEK and be registered in the Thomson Reuters Eikon database. The funds sustainability rating must also be accessible in the Morningstar database. The time period examined in this study is between December 2010 and December 2020.
2. Frame of Reference
This chapter begins with a review of the literature concerning socially responsible investments and ESG, mutual funds, and finance related theories applicable on SRI. Finally, the hypotheses of the study are presented.
2.1 The Foundations of SRI and ESG
Since there is no legal definition of what constitutes socially and responsible investing, commonly used terms like ethical investing, sustainable investing, green investing, and impact investing are often used interchangeably in the financial industry. However, there are some distinct differences to consider that will in turn affect the construction of portfolios. Ethical investing, for example, refers to exclusions of certain businesses, such as weapon production, gambling, or pornography - namely branches which according to western culture are considered unethical. Thus, the focus here is on what the company produces. Contrarily, SRI identifies risks from a sustainability perspective and look at how companies handle certain risk factors, and how they adjust and positioning themselves for the changing conditions that climate change entails. Thus, SRI focuses more on how, rather than what the companies produces (Söderberg & Partners, 2017).
The international SRI organization, Eurosif, has set a general definition of SRI. According to the association, SRI can be defined as a collective noun for a variety of different procedures and screening processes that mutual fund managers practice taking environmental and social responsibility in their investments. Further, SRI is an investment strategy where integration of environmental, social and governance (ESG) factors are essential in investment decisions, to create a stable and well-functioning economic system as well as long-term sustainable returns for investors (Eurosif, 2021). The ESG factors’ significance, have according to MSCI (2020) been growing as of late, both for institutional and private investors.
The general definition by Eurosif requires the ESG factors to be further elucidated. Brzeszcynski and McIntosh (2014) identify the ESG factors as very broad topics that include
many different sub-areas, as shown in Table 1. By uniting these factors an investors financial concerns are linked to their ethical, social, and environmental concerns.
Table 1: The ESG Factors
Environmental Social Governance
Climate change Human capital Corporate governance
Natural resources Product liability Corporate behavior Pollution and waste Stakeholder opposition
Environmental opportunities Social opportunities
Source: MSCI (2020)
The environmental factor is the first part of ESG and has become a very popular topic for investors but also for politicians when running for public offices. The environmental issues concern any aspect of a company’s activity that affect the environment in either a positive or negative manner. MSCI (2020) present four different sub-areas in the environmental factor including climate change, natural resources, pollution and waste, and environmental opportunities. The environmental issue is discussed at the very highest level and the European Commission (2020) recently proposed to raise the EU 2030 greenhouse gas emission reduction target, from 40% to 55% (from the 1990 levels). Further, the 2030 targets also include the union to reach a minimum of 32% renewable energy and at least a 32.5% improvement in energy efficiency. To significantly reduce carbon emissions and other negative environmental impacts, UNFCCC3 claims that climate finance4 plays a key role as large-scale investments are needed for the adaption to the adverse effect of climate change (MSCI, 2020).
The social factor of ESG cover aspects such as human capital, product liability, stakeholder opposition and social opportunities. The social criteria means that companies have a responsibility to their employees and the society in which they operate, including labour management, health standards, supply chain labour standards, privacy and security, and product safety (MSCI, 2020). One major problem according to Fairtrade Sverige (2019) is that
3 The United Nations Framework Convention on Climate Change
4 Refers to public and private sources of financing that seek to support mitigation and adaption actions that will
many workers in the global trade chain receive wages that are too low for them to uphold a satisfactory standard of living.
The final component of ESG is the governance factor, which involves corporate governance and corporate behavior (MSCI, 2020). Khan (2019) argues that effective and good corporate governance is important for the preservation and growth of capital along with effective capital allocation, which are all key factors for constructing a sustainable business in the company’s long-term operations. However, an inefficient corporate governance can be costly for stake- and shareholders. Savitz and Weber (2014) describe that most of the large public firms are incorporating ESG factors into a broader role within their corporate strategy. Companies have also created an explicit role for a “chief sustainability officer,” whose role is to devise and integrate strategies of ESG throughout the company’s organization. Shrivastava and Addas (2014) claims that better corporate governance generates a higher sustainability score which in turn can lead to increased probability for firms to adopt sustainability policies.
2.2 Mutual Funds
According to Elton and Gruber (2013) there are four types of mutual funds: exchange-traded funds, closed-end funds, unit investment trusts and open-end funds. The authors argue that the later type is the largest and mostly considered as a mutual fund. Bodie, Kane and Marcus (2018) states that mutual funds consist of pooled money from many individual investors and invest in various types of securities. Also, most mutual funds tend to specialize in one area of the security market. For instance, a fund orientation could be US small-cap, global large-cap, or the technology sector (Baker, Filbeck and Kiymas, 2015). According to Phalippou and Gottschalg (2009), mutual equity funds is one of the major financial assets in the financial market. The mutual equity funds mainly invest in stocks, but they can also include other securities or fixed incomes to a certain degree, often to reduce volatility (Bodie et al., 2018).
2.3 Modern Portfolio Theory
According to Markowitz (1952), the Modern Portfolio Theory (MPT) has its foundation in the diversification and correlation between assets. Although Markowitz’s theory was first introduced almost 70 years ago, Erickson (2014) claims that it is still the most universally approved theory used in the creation of investments portfolios. The theory argues that investors should include assets in their portfolio which have the lowest correlation possible between them to limit the total portfolio risk and, thereby, increase the diversification of the portfolio.
Markowitz (1952) states that there are two types of risk in the financial market, namely systematic and unsystematic risk, where the former refers to the risk associated with the entire capital market. The systematic risk cannot be predicted and is impossible to avoid and cannot be reduced by any strategy the investor implements. The unsystematic risk is described by Bodie et al. (2018) as a specific risk associated with an industry sector or a company. The unsystematic risk of a specific asset can be offset by the unsystematic risk of another asset, namely diversification (Markowitz, 1952).
2.3.1 Modern Portfolio Theory and SRI Screening
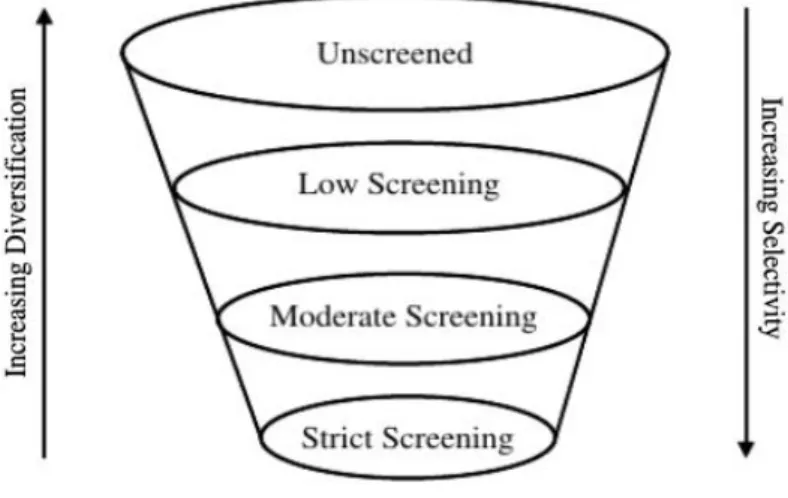
Bodie et al. (2018) states that the Modern Portfolio Theory allows investors to choose their investments from the entire stock universe. Barnett and Salomon (2006) describe that the universe of stocks has a uniform distribution of returns; stocks in the centre earn the return of the market, stocks in the left tail return less and stocks in the right tail return more. Markowitz (1952) argue that investors who take random draws from the stock universe can expect to assemble a portfolio that has a return equal to the market if the assembled portfolio is well diversified. In recent years, many alternative and updated asset pricing models have been explored. However, diversification is a tenet of most of these models and still considered as the most effective way to limit the downside risk (Barillas, Kan, Robotti and Shanken, 2019). Chieffe and Lahey (2009) argue that screening is the main strategy of SRI and that the strategy is constantly evolving. The screening process is done by the fund management who compile a list of certain criteria that works as basis when excluding and (or) including securities in a portfolio. SRI screening does according to Barnett and Salomon (2006) methodically inhibit
an investors ability to diversify a portfolio or fund, as shown in Figure 1. Supporters of the Modern Portfolio Theory such as Lee et al. (2010) argue that SRI portfolios are expected to deliver inferior performance compared to the market due to its inability to create a well-diversified and efficient portfolio.
Figure 1: The Effects of Social Screening on the Universe of Stock Choices
Source: Barnett and Salomon (2006)
According to Unpri (2020) there are three types of screening:
▪ Negative screening excludes certain sectors and companies because of their poor ESG performance/rating. Example of these kind of sectors are fossil-fuel, alcohol and tobacco. Companies that are excluded through a negative screening are labelled by Hong and Kacperczyk (2009) as “sin” stocks.
▪ Norm-based screening excludes companies based on their business practices that violates international standards and conventions through different frameworks such as UN global impact and UN human rights (Unpri, 2020).
▪ Positive screening includes certain sectors and companies based on their positive ESG performance and their projected impact on SRI practices. Another reason for their inclusion can be the product or service that they provide (Unpri, 2020).
Renneboog et al. (2008) argue that the use of the different screening types, reduces a fund’s investments options which in turn leads to higher risk and inferior returns. Lee et al. (2010)
also state that the number of screenings negatively impact financial performance, but the systematic risk of the SRI portfolio will be lower as a result of the screenings. Nofsinger and Varma (2014) support the argument by describing that SRI portfolios limit the down-side risk and deliver superior financial returns during financial crises. Barnett and Salomon (2006) claim that investors who apply screening strategies when constructing a portfolio have a higher likelihood of avoiding stocks in the left tail of the distribution and picking stocks in the right tail. According to Capelle-Blancard and Monjon (2014) investors who engage in SRI strategies should be prepared to bear a cost for their investment strategy.
Statman and Glushkov (2009) argue that the exclusion of “sin” stocks will result in a disadvantage in regard of returns for SRI portfolios relative to conventional portfolios. Fabozzi, Ma and Oliphant (2008) claim that there can occur financial gains for companies by not conforming to social standards, as it entails costs for a company to uphold such standards. Martí-Ballester (2015) state that the financial gains from the use of a positive screening is offset by the negative screening, thereby leading to a neutral portfolio. Barnett and Salomon (2006) claim that even though an SRI portfolio may entail a higher degree of risk, the pool from where it draws its stocks becomes richer than the conventional pool.
2.4 The Nexus Between Stakeholder and Shareholder theory
Deng, Kang and Low (2013) argue that there are two conflicting views on Corporate Social Responsibility (CSR), specifically stakeholder value maximization and the shareholder expense view. According to Kitzmueller and Shimshack (2012), CSR has increasingly become a mainstream business activity among companies and the term CSR is frequently used to describe a company’s stakeholder orientated activities. Deng et al. (2013) states that many publicly traded companies provide annual CSR reports with detailed descriptions of their CSR activities. Liang and Renneboog (2017) claim that CSR allows companies to focus on areas besides profit maximization and contribute to activities that improve other stakeholders’ welfare, such as selecting suppliers that uphold high standards of human rights and provide employee benefits. McWilliams and Siegel (2001) describe that CSR are actions that enhance and advance a company’s social good, beyond that which is required by law. Deng et al. (2013) states that the common reason why companies engage in CSR is that it will generate a higher
firm value and increasing profitability, this is often referred to as “doing well by doing good”. This statement directly contradicts the classical view of Friedman (1970) argument that companies only have a responsibility to its shareholders and that they should not spend time or resources on social activities, as they are likely to decrease shareholder value.
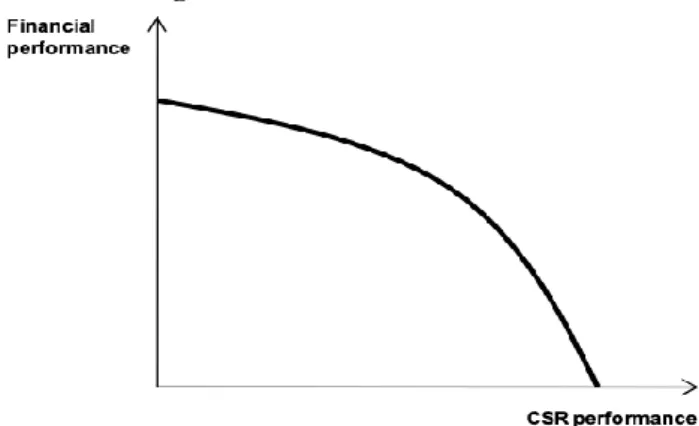
2.4.1 Negative Relationship: “The Cost-Concerned School”
Neoclassical economics implies according to Hickman, Teets and Kohls (1999) that investors only care about two factors, namely their expected return and risk. Friedman (1970) points out that CSR is costly and an administrative burden for firms to engage in socially responsible practices, such as reducing environmental impact. Godfrey, Merrill and Hansen (2009) also assert that CSR is a costly factor by stating that a company’s CSR value is not reflected on the enterprise value, however, the authors argue that CSR practices can act as a form of insurance against unforeseen events. Barnett and Salomon (2006) state that the use of SRI strategies leads investors to select companies which have above-average operating expenses, thereby having higher CSR engagements. Jensen (2001) claims that the burdens of CSR directly detract value from a company’s profits, thus putting socially responsible firms at a disadvantage relative to their rivals who do not engage in these activities. Friedman (1970) argues that if CSR practices would increase a company’s profitability, they would already have been integrated into the company’s core business operations. Furthermore, Jensen (2001) state that the gains a company can make from engaging in CSR in higher degree are too small that they become insignificant compared to the higher compliance costs, therefore companies should not aim to incorporate CSR. In brief, the central argument of the cost-concerned school is that there is a trade-off between CSR engagement and financial performance, which is illustrated in Figure 2.
Figure 2: The Cost-Concerned School
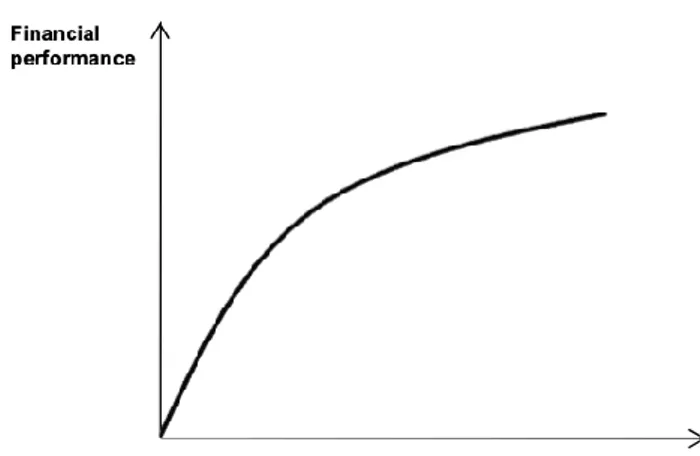
2.4.2 Positive Relationship “The Value-Creation School”
The negative relationship between CSR and financial performance, as suggested by the cost-concerned school, has more recently been disputed. OECD (2017) argues that a good ESG and CSR performance could be a sign that a company is operating efficiently on an operational and financial level, as they are able to adapt to changing market conditions and are benefitting from lower production costs. Furthermore, Cai and He (2014) claim that there is a positive correlation between CSR and the long-term company performance, and Martí-Ballester (2015) argue that engagement in CSR strategies can lead to increased productivity because of the operational efficiencies and the lower cost entailed of attracting quality employees and more attractive products or services. According to Godfrey et al. (2009), the practice of CSR could help preserve a company’s corporate financial performance, because a major part of the CSR value lies in intangible assets. Moreover, Attig, Ghoul, Guedhami and Suh (2013) claim that there is a strong relationship between CSR and credit ratings. Thus, firms with high CSR scores could obtain lower financing costs. Godfrey et al. (2009) support this theory by stating that ESG and CSR performance can lower the cost of equity and cost of debt if the corporate governance is well managed. Attig et al. (2013) argue that the benefits of CSR can be immediate, despite the fact that CSR does not usually have an immediate positive impact on a company’s financial performance as it usually entails financial costs to engage in CSR. Cai and He (2014) argue that a better company management of stakeholder relations will in the long-run result in a better financial performance. The above arguments from the value-creation school, is briefly illustrated in Figure 3.
Figure 3: The Value-Creation School
Table 2: Summary of Previous Research
Year Author(s) Country Sample Time Span Performance Measure Results Relationship
2012 Chang, Nelson & Doug Witte
US 131 SRI
mutual funds
2008-2011 Sharpe Ratio SRI funds underperform on risk-adjusted basis (lower returns and similar risk).
Negative
2018 Blankenberg & Gottschalk
Global 40 stocks 2002-2016 Risk-Adjusted Returns (Sharpe Ratio)
The sustainable portfolio does not perform significantly different compared to the conventional portfolio.
Neutral
2010 Humphrey, Lee & Shen
UK 256 firms 2002-2010 Jensen’s and Carhart
Alpha
Firms with high or low ESG ratings do not show a significant difference in terms of risk-adjusted returns.
Neutral
2014 Dias Curto & Vital
Global 14 indices 2001-2011 Parametric, non-parametric & Granger Causality tests
Sustainable indices outperform traditional stock indices. No significance in average returns. Positive 2014 Nofsinger & Varma US 240 SRI mutual funds
2000-2011 Jensen’s, Fama & French 3-factor, and Carhart Alpha
Asymmetric return performance (SRI funds outperform during market crises but underperform during non-crisis periods).
Positive/Negative
2004 Schröder Global 46 funds
and 10 indices
< 2002. Minimum history of 30 months
Jensen’s Alpha SRI assets have no significant disadvantage compared to conventional investments concerning risk-adjusted performance.
Neutral
2010 Lee, Humphrey, Benson & Ahn
Global 61 SRI mutual funds
1989-2006 Fama & French 3-factor and Carhart Alpha
Screening intensity has no effect on unadjusted returns or idiosyncratic, and results in lower systematic risk. Screening intensity has a small negative effect on Carhart Alpha.
Neutral/Positive 2006 Barnett & Salomon US 61 SRI mutual funds 1972-2000 Risk-Adjusted Returns (Sharpe Ratio)
The financial loss borne by an SRI fund due to poor diversification is offset as SRI screening intensifies because better managed and more stable firms are selected into its portfolio.
Neutral
2007 Bauer, Derwall & Otten
Canada 275 mutual funds
1994-2003 Jensen’s, Fama & French 3-factor and Carhart Alpha
Any performance differential between SRI mutual funds and their conventional peers is statistically insignificant.
2.5 Hypotheses
Based on the purpose of this paper, previous research, and existing literature regarding the financial and risk-adjusted performance of SRI and conventional mutual equity funds, the following hypotheses are to be tested in this study:
𝐻0: There is no significant difference in risk-adjusted performance between conventional and SRI mutual equity funds.
𝐻1: There is a significant difference in risk-adjusted performance between conventional and SRI mutual equity funds.
3. Research Methodology & Approach
This chapter describes the scientific research methodology, followed by the research approach with descriptions on the data and sample collection. This is followed by a description of the three asset pricing models and the variables used in this study along with the econometric model used for the analysis of the empirical material. Finally, reliability and validity are presented.
3.1 Research Methodology
There are two research strategies that can be adopted when writing a research paper, either a quantitative or qualitative method. The quantitative method is more suitable to be generalizable to the population if the collected sample data is representative (Bryman & Bell, 2017). When the aim of the research is to analyse tangible data or statistics for either primary or secondary data, it is according to Edling and Hedström (2003) the quantitative method that is the most commonly used among scholars. It is also the most suitable method especially when the examined sample data is large (Gheondea-Eladi, 2014). Since the purpose of the thesis is to examine how SRI funds perform compared to conventional funds, the base data of our analysis will be monthly returns from each fund. Therefore, the study adopts a quantitative method with an experimental study methodology since it evaluates the difference in financial and risk-adjusted performance between conventional and SRI mutual funds.
3.1.1 Research Approach
Bryman and Bell (2017) state that the relationship between a study’s theoretical and empirical sections can be expressed by three different approaches, namely, deductive, inductive, and abductive. These approaches help researchers select how the collected data will be analysed and tested. Saunders, Lewis and Thornhill (2016) state that an abductive approach is a combination of an inductive and deductive approach where both a quantitative and qualitative method can be adopted. Patel and Davidson (2011) claim that an inductive approach is mainly used when adopting a qualitative method. The deductive approach has its starting point in formulating hypotheses from existing theory that will then be subjected to empirical investigation in order to explain the relationship between variables. For the purpose of this thesis the choice of approach fell on the deductive approach since we want to test our developed hypotheses through our empirical findings. The purpose of this research is to examine the
financial performance of SRI funds compared to conventional funds and the study makes use of an experimental methodology since the study investigates risk-adjusted performance in relation to the fund type (Saunders et al., 2016).
3.1.2 Philosophical Framework
A research paradigm is often called philosophical framework and it serves as a guidance for researchers for how scientific research should be carried out. There are two paradigms that can be adopted in scientific research: interpretivism and positivism. Interpretivism perceives the research phenomenon in the study subjectively, while positivism perceives the research phenomenon objectively. A positivism research paradigm is used for this study, as it is the most suitable approach for the purpose of this study. Positivism is also mostly used in quantitative research with a deductive approach where a phenomenon can be explained scientifically (Collis & Hussey, 2014).
3.2 Research Approach
3.2.1 Data collectionSecondary data is used in this study in terms of monthly net asset value (NAV) history, date since inception and assets under management retrieved from Thomson Reuters Eikon. Secondary data is defined by Christensen, Engdal, Grääs and Haglund (2016) as previous research and data that is available to be collected from existing sources for everyone. The factors (independent variables) for the asset pricing models were retrieved from the Kenneth R. French Database that provides data for each factor for different markets, and the risk-free
rate and the return of OMXSPI were collected from the Bloomberg terminal.
3.2.2 Data sample and the Morningstar Sustainability Rating
The purpose of the study is to analyse the financial performance of Swedish SRI mutual equity funds in comparison with their conventional peers. Therefore, a purposive sampling (non-probability sampling method) is used for the collection of funds. In total, 236 mutual equity
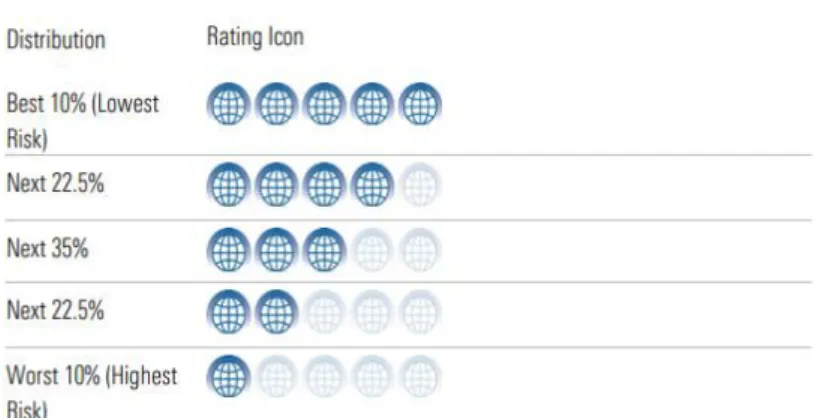
funds were collected, of which 103 are classified as conventional funds (sustainability rating of 1-3) and 133 are classified as SRI funds (sustainability rating of 4-5). The classifications are based on each fund’s sustainability rating from Morningstar, which is globally regarded as the best criteria for examining whether a fund can be classified as sustainable or not. The so called “globe rating” was constructed in order to help investors use ESG information to evaluate the sustainability profile of mutual funds. When evaluating each fund’s ESG integration, Morningstar uses a relative global comparison, meaning that Swedish mutual funds are compared to its foreign peers within the same investment category. Moreover, the rating provides an objective and reliable way of how the portfolios are meeting ESG challenges based on the underlying companies ESG ratings from Sustainalytics, a leading provider of ESG research. A portfolio’s (fund’s) sustainability rating is its normally distributed score and descriptive rank relative to its global category (Morningstar, 2019). The rating distribution is summarized in the following figure.
Figure 4: Morningstar Sustainability Rating
Source: Morningstar (2019)
3.3 Asset Pricing Models
The asset pricing models used in this study to estimate the alpha values for the funds are Jensen’s Alpha, the Fama French three-factor model, and the Carhart four-factor model. All of these models will be explained further in separate sub-chapters. The data factors SMB, HML and MOM have been retrieved from the Kenneth R. French Database for developed markets. Since most Swedish mutual funds invest globally the developed factors provide more significant results compared to the Swedish factors. Though, the data used for the risk-free rate factor is the Swedish 1-month treasury bill and the market return factor is based on the return of the OMXSPI (all stocks listed on the Stockholm Exchange). The reason is because the
mutual fund analysis is based on the perspective of a Swedish investor; thus, the Swedish T-bill and stock market index are best suited as the performance evaluation benchmarks. Both factors were retrieved from the Bloomberg Terminal.
3.3.1 Jensen’s Alpha
The Capital Asset Pricing Model is widely the most employed benchmark model used for the valuation of mutual fund performance. In the model a fund’s outperformance known as alpha is expressed and measured as the difference between a mutual fund’s excess return and the return of the single-factor benchmark. Thus, it is used to determine the abnormal return of a portfolio of securities over its theoretical expected return based on the systematic (market) risk. An assumption when using this model is that the single-factor model is sufficiently capable of explaining the cross-section between stock returns (Nofsinger and Varma, 2014).
𝑅𝑖 − 𝑅𝑓 = 𝛼𝑖 + 𝛽𝑖 (𝑅𝑚− 𝑅𝑓) + 𝜀𝑖
Equation 1: Jensen’s Alpha (Jensen, 1968) 𝑅𝑖= 𝑇ℎ𝑒 𝑟𝑒𝑡𝑢𝑟𝑛 𝑜𝑓 𝑚𝑢𝑡𝑢𝑎𝑙 𝑓𝑢𝑛𝑑 𝑖 𝑖𝑛 𝑚𝑜𝑛𝑡ℎ 𝑡 𝛼 = 𝑅𝑒𝑝𝑟𝑒𝑠𝑒𝑛𝑡𝑠 𝐽𝑒𝑛𝑠𝑒𝑛′𝑠 𝑎𝑙𝑝ℎ𝑎 𝛽𝑖 = 𝑇ℎ𝑒 𝑚𝑎𝑟𝑘𝑒𝑡 𝑟𝑖𝑠𝑘 − 𝑒𝑥𝑝𝑜𝑠𝑢𝑟𝑒 𝑜𝑓 𝑡ℎ𝑒 𝑓𝑢𝑛𝑑 𝑅𝑚= 𝑇ℎ𝑒 𝑟𝑒𝑡𝑢𝑟𝑛 𝑜𝑛 𝑡ℎ𝑒 𝑚𝑎𝑟𝑘𝑒𝑡 𝑝𝑟𝑜𝑥𝑦 𝑖𝑛 1 𝑚𝑜𝑛𝑡ℎ 𝑅𝑓 = 𝑇ℎ𝑒 𝑟𝑖𝑠𝑘 − 𝑓𝑟𝑒𝑒 𝑟𝑎𝑡𝑒 𝜀𝑖= 𝑇ℎ𝑒 𝑒𝑟𝑟𝑜𝑟 𝑡𝑒𝑟𝑚
3.3.2 Fama French Three-Factor Model
In 1992, Kenneth French and Eugene Fama presented the article The Cross-Section of Expected
Stock Returns. The article investigated if various variables could be used in a model to explain
the cross-section expected asset returns, more advantageously than the single variable beta in the original CAPM. The two factors, BE/ME and company size had the most significant results and were then used to develop the three-factor model. The paper found that the size of a company has a negative relationship with the average return and that assets with a high BE/ME ratio yields larger average return. The first factor in the model is the beta value of an asset and
it describes how the asset corresponds to the market portfolio. The second factor in the model is labelled as SMB and stands for Small Market Capitalization Minus Big Market Capitalization. This factor measures the historic excess return of small-cap over large-cap companies. The third factor is labelled as HML and stands for High Book-to-Market ratio Minus Low Book-to-Market ratio. This factor measures the historic excess returns of value stocks over growth stocks. The three-factor model is an evolution of the original CAPM as it contains the same factor that is used in the CAPM, but also includes two other variables in the formula in order to better explain the cross-section in expected return. Since the model uses three factors instead of one, the authors suggest that the three-factor model can be used to explain the asset return better than the CAPM. Another argument stated by the authors is that with the addition of the two new variables, the model can be used to detail the non-diversified risk in assets to a higher degree than the CAPM (Fama & French, 1997). The Fama French three-factor model in regression form is expressed as follows:
𝑟𝑖𝑡− 𝑟𝑓𝑡 = 𝛼 + 𝛽1(𝑟𝑚𝑡− 𝑟𝑓𝑡) + 𝛽2𝑆𝑀𝐵𝑡+ 𝛽3𝐻𝑀𝐿𝑡+ 𝜀𝑡
Equation 2: The Three-Factor Model (Fama & French, 1997) 𝛼 = The intercept of the regression
𝑟𝑖 = The return of asset i 𝑟𝑓 = The risk-free interest rate 𝑟𝑚 = The market return
𝑆𝑀𝐵 = The return of the size factor 𝐻𝑀𝐿 = The return of the BE/ME factor 𝜀𝑡 = The error term
𝛽1−2−3 = The coefficient values of the three exogenous variables
3.3.3 Carhart Four-Factor Model
Mark M. Carhart introduces the Carhart four-factor model in 1997 in his article On Persistence
in Mutual Fund Performance and the model was used as a tool for evaluating mutual funds.
The model is based on the Fama French three-factor model but also based on the work by Jegadeesh and Titman (1993), that found evidence that good and bad performance of stocks persists over several months and that stocks thereby have an incorporated momentum factor. It
is the momentum factor that Carhart added to the four-factor model. The factor measures the return between winners’ and losers’ stocks (Carhart 1997). The Carhart four-factor model in regression form is expressed as follows:
𝑟𝑖𝑡− 𝑟𝑓𝑡 = 𝛼 + 𝛽1(𝑟𝑚𝑡− 𝑟𝑓𝑡) + 𝛽2𝑆𝑀𝐵𝑡+ 𝛽3𝐻𝑀𝐿𝑡+ 𝛽4𝑀𝑂𝑀𝑡+ 𝜀𝑡
Equation 3: The Four-Factor Model (Carhart 1997) 𝛼 = The intercept of the regression
𝑟𝑖 = The return of asset i 𝑟𝑓 = The risk-free interest rate 𝑟𝑚 = The market return
𝑆𝑀𝐵 = The return of the size factor 𝐻𝑀𝐿 = The return of the BE/ME factor MOM = Return of the momentum factor 𝜀𝑡 = The error term
𝛽1−2−3−4 = The coefficient values of the four exogenous variables
3.4 Econometric Model
In econometrics, the main purpose is to examine the relationship between different variables by collecting empirical data, either primary or secondary data, in order to perform hypotheses testing regarding the relationship between the variables (Pinto, 2011).
3.4.1 Variables
The two dependent variables used in this study’s econometric model is the Carhart alpha and the Sharpe ratio. Both measures have been used extensively in previous studies on mutual fund performance, either for itself or together. While the Carhart alpha uses market benchmarks to gauge the risk-adjusted performance between mutual funds, the Sharpe ratio considerate the mutual funds’ underlying asset volatility – making it useful as a relative measure when comparing mutual funds with similar asset holdings. The Carhart alpha is best used for examining the performance of mutual funds when the market benchmark is the same. As our
sample of mutual funds are exposed to different kind of markets, we use the Sharpe ratio as an additional performance measure in our model. By doing so, we create a higher robustness in our study and are able to evaluate the risk-adjusted performance between mutual funds not only in relation to the market, but also to the portfolios’ underlying assets’ volatility.
The Carhart alpha measures the return a fund has been able to generate in comparison with the overall market. If the value is positive, then the fund has outperformed the market and underperformed if the value is negative. An asset’s alpha can be estimated using different models; the models used in this study are presented in chapter 3.3 including their corresponding equations. The dependent variable used in the econometric model to calculate a funds alpha is, however, the Carhart four-factor model - as it is heavily used as the main performance model in previous research on mutual fund performance.
The Sharpe ratio measures the return an investor receives beyond the risk-free interest rate in relationship to the total amount of risk (standard deviation) associated with the investment, also defined as risk-adjusted return. The formula is a tool to help facilitate in the search of the investments that historically have yielded the highest return along with the lowest risk, the aim of the ratio is to pick the asset with the highest value (Sharpe 1966). The formula for the Sharpe ratio is as follows:
𝑆ℎ𝑎𝑟𝑝𝑒 𝑟𝑎𝑡𝑖𝑜 =𝑅𝑝− 𝑅𝑓 𝜎𝑝
𝑅𝑝 = The return of the portfolio
𝑅𝑓 = The risk-free interest rate
𝜎𝑝 = Standard deviation of the portfolio
The independent variables used in this study are “sustainable” (dummy variable), “size” and “age” (control variables). In previous studies on the financial performance of mutual funds, the variables size and age have commonly been used as control or independent variables. The dummy variable, “sustainable”, is used to classify whether the fund is an SRI or conventional mutual equity fund. The variable takes either on the value of 0 if the fund is a conventional
mutual fund (ESG rating of 1-3), or the value of 1 if it is an SRI mutual fund (ESG rating of 4-5). The ESG rating is retrieved from the Morningstar database. The size of the fund is measured by the fund’s total net assets under management (TNA) and the age of the fund is calculated from the years since the fund inception. The data for both size and age have been retrieved from the Thomson Reuters Eikon database.
3.4.2 Linear Regression Model
A linear regression model is mainly used for forecasting and prediction but can also be used to examine the relationship between different variables. One of the most popular linear regression models is the Ordinary Least Square (OLS) model (Ohlson & Kim 2015). There are according to Gujarati and Porter (2009) four assumptions that researchers have to test for when performing a linear regression:
1. Normal distribution 2. Homoscedasticity 3. Autocorrelation 4. Multicollinearity
Should these assumptions not be fulfilled, it would lead to less trustworthy results, and researchers could draw the wrong conclusions regarding their findings. The OLS regression used in this study is performed by using the statistical software programme EViews.
3.4.3 Data Analysis: Regression and Descriptive Statistics
Based on the study’s hypotheses, whether or not there is a difference in risk-adjusted performance between conventional and SRI mutual equity funds, a multiple regression model was used as the study uses two separate dependent variables in two performed regressions; Carhart alpha and Sharpe ratio, with one independent variable; sustainable, and two control variables; age and size. The regression was tested for the overall period of 10 years with two separate regressions using the following formula:
𝐶𝑎𝑟ℎ𝑎𝑟𝑡 𝑎𝑙𝑝ℎ𝑎 𝑜𝑟 𝑆ℎ𝑎𝑟𝑝𝑒 𝑟𝑎𝑡𝑖𝑜 = 𝑆𝑢𝑠𝑡𝑎𝑖𝑛𝑎𝑏𝑙𝑒 (𝑐𝑜𝑛𝑣𝑒𝑛𝑡𝑖𝑜𝑛𝑎𝑙 𝑜𝑟 𝑆𝑅𝐼) + 𝐴𝑔𝑒 + 𝑆𝑖𝑧𝑒 + 𝜀
In addition to the regression model, descriptive risk-adjusted, risk statistics and financial statistics have been emphasized to back up the regression and to create a more comprehensive analysis on the portfolios’ risk and performance, which is in line with previous research (e.g., Chang et al., 2012 and Schröder, 2004). For the risk measures, we use standard (and downside) deviation of returns, VaR, Expected Shortfall, Skewness and Kurtosis – all commonly used in previous research as well as in the finance industry when evaluating the risk of assets. Furthermore, the Sharp ratio and Sortino ratio are used as the risk-adjusted measures.
3.5 Scientific Criteria
Validity and reliability are essential to increase the quality and trustworthiness of the study, as well as to reduce suspicion of the research. Validity and reliability are two concepts that are frequently used in research as scientific criteria, the concepts are argued to be more suitable for a quantitative method rather than a qualitative one (Bryman and Bell, 2017).
3.5.1 Validity
LeCompte and Goetz (1982) argue that there are two different aspects of validity - internal and external validity. According to Lincoln and Guba (1985), internal validity corresponds to the trustworthiness of the study and is described as how likely or unlikely the result of the study was. DePoy and Gitlin (1999) state that internal validity deals with the ability of the research to answer the research questions and to fulfil the research purpose. In this study the criteria of internal validity have been established by carefully examining previous research on the difference in financial performance between conventional and SRI mutual funds and determining that the main scientific body indicates that there is not a significant difference in financial performance or risk adjusted performance between the two investment types.
Jakobsson (2011) argue that external validity focuses on the study’s possibility to generalize the results and how well the results can be applicable on other organizations and geographical areas. When selecting empirical data for a quantitative study, researchers place high focus on selecting data sample that is highly representative which leads to that the result can be applied on an even larger scale. This study examines the performance of Swedish SRI mutual funds’ performances and aims to contribute to this field of research. The method adopted in this study have been created by using similar methodology of previous research. The sample criteria of the study that the fund needs to be registered in Sweden, may lead to that the study’s results may not be applicable on other international markets. One strength of the study is that it examines an entire business cycle, which sometimes can be a limit to studies that only investigate a boom for example.
3.5.2 Reliability
Lincoln and Guba (1985) claim that reliability is relate to whether a specific study’s result would be consistent if the study were replicated with the same method and the exact same data. LeCompte and Goetz (1982) state that a study’s ability to be replicated is defined as external reliability. Bryman and Bell (2017) argue that in quantitative research, reliability is of major interest as it becomes more noticeable whether the measurements are stable or not. The data used for analysis in this thesis is retrieved from Thomson Reuters Eikon which is a renowned database tool within finance and is considered to have a high reliability. Although the database has a high reliability, there can always be human or technical errors. We therefore performed spot-checks on the individual fund’s factsheets and their historic return to increase the reliability of the study. The reliability of a study is increased by more precise data, which in this thesis’ case would be the daily return data of the mutual funds (Bryman and Bell, 2017). Our collection of data is monthly financial returns which may lead to decreased reliability and less precise data. However, all similar previous research uses monthly data in their data examination.
4. Results
This chapter presents the statistical results with a presentation of the descriptive statistics for the 10-year period and the 5-10-year and 3-10-year period, followed by the descriptive statistics for the individual globe ratings. The chapter continues with the regression results of the econometric model and the test for the assumptions of the OLS model. Finally, the results of the hypotheses are presented.
4.1 Overall Performance
Figure 5: Performance of the Conventional Portfolio and the SRI Portfolio
Figure 5 shows the total average cumulative return for the SRI portfolio, the conventional portfolio, and the market benchmark (OMXSPI) for the period 2010-12-31 to 2020-12-31. The graph is constructed by using a portfolio index with a starting value of 100 and the total percentage returns for the two portfolios is shown in Table 3. 0,00 50,00 100,00 150,00 200,00 250,00 300,00
Figure 6: Distribution of Monthly Excess Returns
Figure 6 displays the average monthly excess returns distribution for the two portfolios between 2010-12-31 to 2020-12-31.
Table 3: Descriptive Risk-Adjusted and Risk Statistics
SRI Portfolio Conventional Portfolio
Total Return 162.1 154.8
Average Annual Return 10.67 10.49
Jensen’s Alpha 0.215* (0.2149) 0.194* (0.1936) FF3 Alpha 0.319* (0.3192) 0.319* (0.3192)
Carhart 4-factor Alpha 0.312* (0.3123) 0.307* (0.3074) Beta 0.784-0.797*** 0.835-0.848*** N 133 103
Note: *, ** and *** represents the statistical significance level at 10%, 5% and 1%, respectively. The standard errors are reported in the parentheses.
-25% -20% -15% -10% -5% 0% 5% 10%
Table 4: Descriptive Risk-Adjusted and Risk Statistics
SRI Portfolio Conventional Portfolio
Sharpe Ratio (an.) 0.27 0.25
Sortino Ratio (an.) 0.29 0.26
Standard Deviation of Returns (an.) 13.89% 14.53%
Downside Deviation of Returns (an.) 13.18% 14.05%
Value at Risk 5% -6.54% -6.81% Value at Risk 1% -9.38% -9.77% Expected Shortfall 5% -10.75% -11.07% Expected Shortfall 1% -16.80% -18.25% Skewness 0.29 0.20 Kurtosis -1.07 -1.15 N 133 103
Table 3 and 4 present statistics on the performance and risk for SRI mutual equity funds and its conventional peers. For the regression, a monthly time-series have been used of an equally weighted portfolio of funds for the period 2010-12-31 to 2020-12-31. The performance and risk measures are monthly for the presentation unless otherwise stated and the beta presents the interval for the three regression models used. The SRI portfolio refers to mutual equity funds with a Morningstar rating of 4-5 (top 32.5%) and the Conventional portfolio include mutual funds with a rating of 1-3 (bottom 67.5%). N refers to the total number of mutual funds in each portfolio.
During the entire period of 10 years, the SRI portfolio outperforms the conventional portfolio by 7.24% points regarding total return and shows a slightly higher annual average return compared to the conventional portfolio. The SRI funds demonstrate a lower standard (downside) deviation returns which means that it has a lower volatility in contrast to the conventional funds. Both portfolios have a positive alpha for all regression models used, and the SRI funds show slightly higher values compared to the conventional funds. The beta values for SRI funds are slightly lower for all models used, indicating that the SRI portfolio entails a lower systemic risk compared to conventional funds. SRI also exhibits a higher Sharpe ratio compared to conventional funds.
4.2 Performance During the Last 5- and 3 Years
Table 5: Performance and Regression Results (%)
SRI Portfolio Conventional Portfolio
5 years 3 years 5 years 3 years
Total Return 70.10 39.84 65.19 35.29
Average Annual Return 11.97 12.45 11.04 11.44
Standard Deviation of Returns (an.) 14.60 17.21 14.66 17.47
Jensen's Alpha 0.393* (0.3929) 0.117* (0.2050) 0.330* (0.3305) 0.205* (0.1170) FF3 Alpha 0.548*¨ (0.5482) 0.630* (0.5956) 0.526* (0.5256) 0.596* (0.6302) Carhart 4-factor Alpha
0.561* (0.5608) 0.785* (0.7058) 0.543* (0.5431) 0.706* (0.7853) Beta 0.763-0.827*** 0.785-0.863*** 0.771-0.842*** 0.789-0.880*** N 133 133 103 103
Note: *, ** and *** represents the statistical significance level at 10%, 5% and 1%, respectively. The standard errors are reported in the parentheses.
In the Table 5, the returns and alpha measures have been broken-down into two subperiods, namely the last 5-year period (2015-12-31 to 2020-(2015-12-31) and the 3-year period (2017-(2015-12-31 to 2020-(2015-12-31). For the regression and standard deviation, a monthly time-series have been used of an equally weighted portfolio of funds and the beta presents the interval for the three regression models used. The SRI portfolio refers to mutual equity funds with a Morningstar rating of 4-5 (top 32.5%) and the Conventional portfolio include funds with a rating of 1-3 (bottom 67.5%).
During the past 5 years SRI displays a higher annual average return with 11.97%, compared to the conventional portfolio which displays an annual average return of 11.04%. The standard deviation of the SRI portfolio is slightly lower than conventional but only with a difference of 0.06% points. SRI portfolio still exhibits a lower beta value and thereby have a lower systemic risk compared to conventional funds. Both investment types have been able to generate higher alpha values for the 5-year period compared to the entire period of 10 years. SRI exhibits a higher annual Sharpe ratio than conventional. SRI has in the period had a total return of 70.10% compared to conventional that only display a total return of 65.19%, which is a difference of 4.91% points in favour for SRI.
During the 3-year period the SRI portfolio displays an average annual return of 12.45% compared to the conventional portfolio that displays a return of 11.44%. Furthermore, the SRI funds also exhibit a lower average annual standard deviation compared to the conventional funds with 17.21% and 17.47%, respectively. The SRI funds display lower beta values in all three models used (0.811-0.859) compared to the conventional portfolio (0.826-0.877). The conventional portfolio shows a greater alpha for the one-factor model compared to the SRI portfolio but lower for the multi-factor models. The total returns show a difference of 4.55% points for the 3-year period, in advantage for SRI.
4.3 Differences Between Low and High Ranked Portfolios
To elaborate the effects of ESG ratings on fund performance more specifically, the two broad portfolios have been divided into five sub-portfolios accordingly to their Morningstar Sustainability Rating.
Figure 7: Performance by Rating
Figure 7 displays the total average cumulative return for the five sub-portfolios and the market benchmark (OMXSPI) for the period 2010-12-31 to 2020-12-31. The graph is constructed by using a portfolio index with a starting value of 100 and the total percentage returns for the two portfolios is shown in Table 6.
0,00 50,00 100,00 150,00 200,00 250,00 300,00 350,00 400,00
Table 6: Descriptive Statistics by Rating Globe 1 Globe 2 Globe 3 Globe 4 Globe 5
Total Return 234% 132% 153% 171% 141%
Average Annual Return 12.77% 9.49% 10.51% 11.04% 9.71%
Sharpe Ratio (an.) 0.50 0.18 0.24 0.29 0.21
Sortino Ratio (an.) 0.55 0.20 0.26 0.31 0.24
Standard Deviation Returns (an.) 11.16% 14.16% 15.05% 14.22% 13.29%
Downside Deviation Returns/LPSD (an.) 10.93% 13.70% 14.27% 13.53% 12.09%
VaR 1% -7.44% -9.63% -10.14% -9.52% -9.04% VaR 5% -5.12% -6.75% -7.08% -6.63% -6.32% Expected Shortfall 5% -7.95% -11.03% -11.40% -10.99% -10.21% Expected Shortfall 1% -14.98% -18.17% -18.51% -17.40% -15.31% Skewness 0.32 0.18 0.19 0.29 0.26 Kurtosis -1.03 -1.22 -1.14 -1.03 -1.17 N 8 16 79 95 38
Table 6 presents the descriptive performance and risk statistics for the underlying portfolios included in the SRI/Conventional portfolio. The measures are calculated through the entire period (2010-12-31 to 2020-12-31) unless otherwise is mentioned. The funds are divided into their respective Globe portfolio based on their Morningstar Sustainability Rating, explained in 3.2.2.
The Globe 1 portfolio (funds with the worst ESG rating) deviates from the other portfolios as it undoubtedly presents the best risk and performance statistics. However, only a limited amount of mutual funds (the worst 10% withing their global investment sector) are included in this ESG-portfolio, which is why the portfolio only constitutes 3.4% of our total sample. The remaining portfolios show, similar to the two broad portfolios, a high correlation in terms of risk and return as the average annual return and standard deviation only differs about a percentage point between the best and the worst portfolio in terms of sustainability rating. The Globe 4 portfolio, where most mutual funds are included, show slightly better risk-adjusted returns with a Sharp ratio of 0.29, followed by the Globe 3 and Globe 5 portfolio with 0.24 and 0.21, respectively. However, the Globe 5 portfolio presents the lowest risk (excl. Globe 1) with a standard deviation of 13.29% and a limited expected shortfall at the 1% level of -15.31%.
4.4 Regression summary
Table 7: Econometric Model
Fund Performance Carhart Alpha Sharpe Ratio
Sustainable 0.000298 0.005867 (0.000419) (0.011224) Age 0.000126 0.000556 (0.000021) (0.000572) Size 0.000251 0.000392 Constant R-Squared (0.000001) 0.035419*** (0.000518) 0.005005 (0.000004) 0.162373*** (0.013872) 0.011859 N 236 236
Note: *, ** and *** represents the statistical significance level at 10%, 5% and 1%, respectively. The standard errors are reported in the parentheses.
Table 7 present the regression results for the econometric model. The variables Carhart Alpha and Sharpe Ratio are the dependent variables. Sustainable is a dummy variable that takes on either the value 0 or 1 depending on whether the fund is classified as conventional or SRI. Age is the number of years since inception and size is the amount of total net assets under management.
The regression output displays insignificant results for all independent variables except the constant at the conventional significance levels 0.01, 0.05 and 0.10. The result shows that the main variable of interest; sustainable, is insignificant - indicating that there is no significant difference in either Carhart alpha or risk-adjusted returns (Sharpe ratio) between the SRI and conventional portfolio. The R-squared value is low for both the Carhart alpha and Sharpe ratio models, indicating that the models are not a god fit for predicting the financial performance of mutual funds for the two portfolios. However, the Durbin Watson test statistic is higher than the R-square, indicating that the results of the model are reliable.