The Impact of
Political Tensions on
Trade Flows
MASTER
THESIS WITHIN: Economics NUMBER OF CREDITS: 30 PROGRAMME OF STUDY: Urban,
Regional and International Economics
AUTHOR: Qingping Meng JÖNKÖPING May 2018
i
Master Thesis in Economics
Title: The Impact of Political Tensions on Trade Flows -A Case Study of China and Its Neighbors Authors: Qingping Meng
Tutors: Sara Johansson, Pingjing Bo Date: 2018-05-21
Key terms: Political tensions, Trade flows, gravity model, Import, Export, China
Abstract
This thesis contributes to the study of the impact of political tensions on international trade patterns. China has been involved in many regional political tensions with its neighboring countries in the last decade, and it is essential to find out whether these tensions have impact on China’s trade flows with its neighbors. This thesis applies gravity model with quarterly data of China’s trade flows, with its ten biggest Asian trading neighbours during the period 2007 to 2017. By using the new measurement of political tension (the protests from China’s Foreign Ministry, Hong Kong & Taiwan Affairs offices), this thesis finds that the political tensions have negative impact on China’s imports from its neighboring trading partners, but no impact on China’s exports. Political tensions not only have negative impact on China’s imports at the present period, but also can affect China’s imports for the next quarter. This thesis also finds that joining the same regional trade agreement with China can decrease the negative impact of political tensions on trade flows.
ii
Table of Contents
1. Introduction ... 1
2. Background ... 3
3. Previous Studies and Economic Mechanisms ... 7
3.1. The Gravity Model ... 7
3.2. The Gravity Model Components and International Trade Flows ... 8
3.2.1. Economic Size ... 8
3.2.2. Distance ... 9
3.3. Other Factors Affecting Trade Flows ... 11
3.3.1. Trade Agreement... 11
3.3.2. Real Exchange Rate ... 11
3.3.3. Common Border and Language ... 12
3.4. Previous Studies on Trade Flows and Political Tensions... 13
3.5. The Economic Mechanisms ... 16
3.5.1. Producer Behavior ... 16
3.5.2. Consumer Behavior ... 17
4. Research Methodology and Data Description ... 19
5. Empirical Results ... 23
5.1. Basic Results ... 23
5.2. Robustness Test ... 27
6. Conclusion, Policy Recommendation and Future Study ... 31
Reference ... 34
Appendices ... 38
iii
Figures
Figure 1 Number of Political Tensions ... 5
Figure 2 Political Tensions and Trade Flows ... 22
Tables
Table 1 Political tensions with China ... 6Table 2 The list of variables in the baseline gravity model ... 20
Table 3 Data Description ... 21
Table 4 Estimation of the Level of Trade Flows ... 24
Table 5 With Lagged Variables ... 28
Table 6 System GMM regression... 30
Appendices
Appendix 1 Political Tension and Growth of Trade ... 38Appendix 2 Growth of Trade and Lagged Tension Variable ... 39
Appendix 3 System GMM with Growth of Trade ... 40
1
The Impact of Political Tensions on Trade Flows
- A Case Study of China and Its Neighbors
1. Introduction
___________________________________________________________________________________
This part is the introduction, will introduce the basic structure of this thesis, including motivation, main findings and some contributions.
_____________________________________________________________________ International trade is important for countries’ economic growth (Barker, 1977), and it is therefore essential to find out the factors that can affect trade flows between countries. Many studies focus on the impact of traditional gravity model components (country’s size, distance) on the international trade flows (Bernard et al. 2009; Melitz and Ottaviano, 2008; Shepherd 2012), but few (Fuchs and Klann, 2013; Garwakewize and Tang, 2017) have studied whether the political tensions have an impact on China’s trade flows, and what is the extent of such impact. This thesis explores this issue in the context of political tensions between China and its neighbors. As the biggest economy in Eastern Asia, China got involved in many political tensions with its neighboring countries, many of the tensions are about the sovereignty, territory and historical problems. With the complicated political relationship and history, the trade flows between China and its neighbors might be affected by these politic tensions rather than gravity model components alone. Hence, the research question of this paper is: Do political tensions affect international trade flows between China and its neighboring countries? More specifically, for China’s import flows and export flows, which one will get affected more by the political tensions?
In order to study the impact of political tensions on international trade, a gravity model is applied to analyze the trade flows between China and China’s neighboring countries. The panel dataset includes quarterly bilateral trade flows between China and Japan, South Korea, Taiwan, Philippines, Hong Kong, Singapore, India, Thailand, Indonesia
2
and Malaysia during the period from January 2007 to December 2017. A dummy is used to reflect if a political tension occurs, where a political tension is defined as the official protest/accusation from Foreign Ministry of China.
The results indicate that political tensions have a significantly negative impact on China’s import behavior, but do not affect China’s exports. Moreover, the negative impact of political tensions on imports is stronger under Xi Jinping’s presidency. The analysis indicates that the presence of regional trade agreements does not have a direct impact on China’s imports. Still, when interacting the variables reflecting trade agreements and political tensions, the regression results indicate that trade agreements can decrease the negative impact on China’s imports caused by political tensions.
This thesis has several contributions. First, there are only few studies focusing on the impact of political tensions on international trade patterns in the case of China (Fuchs & Klann, 2013, Du, Ju. Ramirez and Yao, 2017). Second, one major question that is raised by all relevant studies is how to measure political tensions. This paper uses the official protest and accusation from China’s Foreign Ministry, providing an easy and clear way to measure political tensions between China and its trading partners.
This rest of the thesis is organized as follows. Section 2 outlines the background with regard to the political situation between China and its neighboring countries. Section 3 provides the review of previous studies, including the studies of gravity model, previous empirical findings of tensions and trade flows, the economic mechanisms and main hypotheses. Section 4 describes in detail the empirical method, data and descriptive statistics. Section 5 presents the main results. The last section concludes and will provides some policy recommendations.
3
2. Background
___________________________________________________________________________________
This part will introduce the basic information of China, and the background of different types of political tensions China had with its neighbouring trading partners.
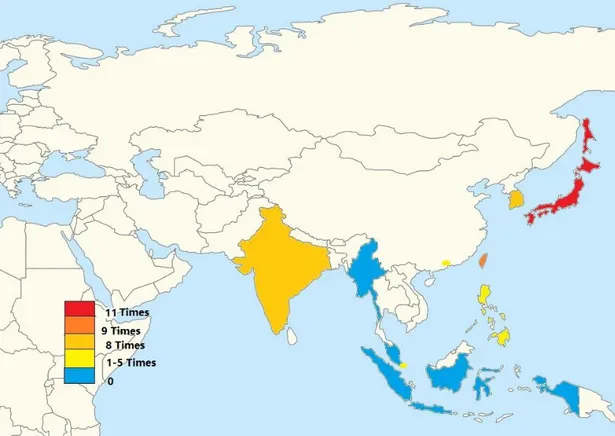
____________________________________________________________________ With the largest population (1.38 billion) and the third biggest land area (World Bank Data, 2016), China is one of biggest countries in the world. It also has the third largest economy (with GDP 11.2 trillion US dollars). In the year 2016, China’s total trade volume reached to 3.8 trillion US dollars, (with 2.2 trillion exports and 1.7 trillion imports), which makes China one of the most important markets and international trade participants in the world (Statistic China, 2016). However, with the rising power, China has been involved in many political tensions (see Figure 1, Table 1).
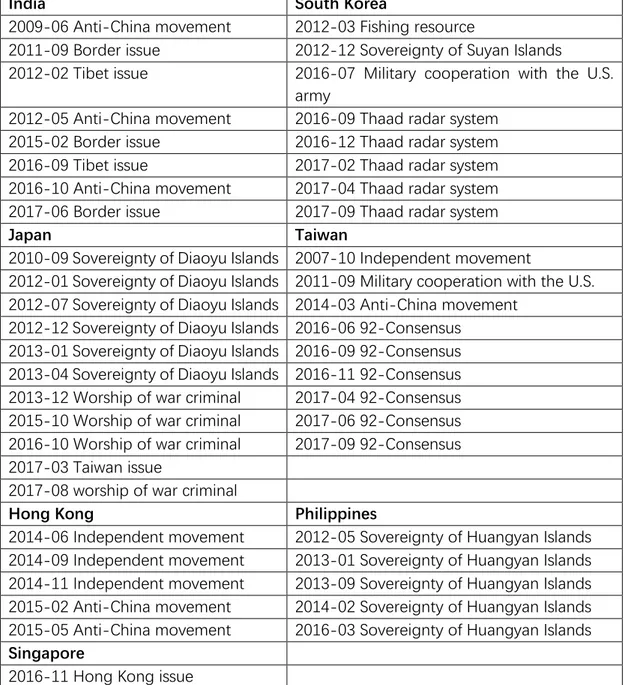
As mentioned before, the political tensions considered in this paper are defined as the official protests or accusations from China’s Foreign Ministry. The official protests and accusations from China’s Foreign Ministry generally refer to certain types of issues: historical issues, sovereignty, military actions, border disagreements and Anti-China movements. In the case of Hong Kong, the statements are released by Hong Kong and Macao Affairs Office, and in the case of Taiwan, they are released by Taiwan Affairs Office (for the details see Table 1).
In particular, nine political tensions happened between Taiwan and Mainland China in the sample period. Six out of nine of the protests and accusations were regarding the One-China policy (the 1992 Consensus), especially during the period 2016 to 2017, after Taiwan elected the new president, who supports the full independence of Taiwan and denies the 1992 Consensus. The remaining protests were about the Taiwan’s Anti-China and independent movements.
For India, the political tensions were generally caused by the disagreement on borders. During the sample period, there were eight official protests and accusations released by
4
the Foreign Ministry of China, with four of them regarding the border disagreements, China and India have been arguing about the borders in Southern Tibet for decades, and any of India’s action around the border will cause strong reaction from China. Chinese government is also very sensitive about India’s support for the independency movements in Tibet, two protests being about this issue. The remaining protests were about the Anti-China movement in India.
Regarding South Korea, most of the protests are caused due to the military cooperation between Korean and the U.S. army (six out of eight). In the last quarter of 2015, South Korea and the U.S. decided to establish the Thaad radar system in Western part of Korea, and the whole Eastern China is under the range of Thaad radar system, causing strong reaction from Chinese government.
In recent years, there are more and more people in Hong Kong protesting against Chinese government’s increasing control over Hong Kong. The movement for independence of Hong Kong occasionally transformed into an Anti-China/Mainland Chinese movement, with tourists and consumers from Mainland China violently treated by the radical protesters. Chinese government used this as an opportunity to promote the narrative that the movement in Hong Kong is aimed to against Mainland Chinese. All the protests and accusations released by Hong Kong and Macao Affairs Office are about the Anti-Mainland Chinese movement in Hong Kong.
The most internationally well-known political tensions between China and a foreign country recently is the disagreement of sovereignty over Huangyan Islands between China and Philippines. Both China and Philippines declare the sovereignty over Huangyan Islands. In the sample period, China totally had five protests and accusation against Philippines, and all of them are about Huangyan Islands.
China and Japan have had complicated history since the Japanese invasion during the Second World War. Japan is one of the biggest trading partners of China. At the same
5
time, China and Japan have the most political tensions compared to other countries. There were eleven political tensions between China and Japan in the sample period, four of them caused by the historical issues. These four protests concern Japanese government’s worship of the war criminals. In particular, the visits of Japanese prime minister at the corresponding temple caused a strong protest from China. But most of the tensions (six of elven) were actually caused by the disagreement of the sovereignty over Diaoyu Islands. Diaoyu Islands are geographically very important to both China and Japan as they are situated at the entry from Eastern Asia to Pacific Ocean. Having the sovereignty over Diaoyu Islands indicates owning the control power of sea transportation and military advantage. There are also rich fishing and oil resources around the Islands.
Figure 1 Number of Political Tensions
Data Source: China’s Foreign Ministry and Hong Kong & Taiwan Affairs Office
Fuchs and Klann (2013) argue that Chinese people’s opinion of another country is largely affected by Chinese government. Media in China are heavily controlled by Chinese government, and Chinese people get most of the foreign information through the national media (national news, radio, internet…). In Fuchs and Klann’s study, they use the official reception of Dalai Lama as the measure of having a political tension
6
with China. They point out that in order to spread the information to the Chinese consumers, every official reception of Dalai Lama in the foreign country will be massively reported by the national news and radio, and hence, Chinese people’s opinion of another country will be negatively affected.
Regarding the measure of political tensions used in this thesis, all the protests from China’s Foreign Ministry will be reported by China’s national news and radio, and the information can thus easily spread to Chinese people and affect their opinion of a particular foreign country.
Table 1 Political tensions with China
India South Korea
2009-06 Anti-China movement 2012-03 Fishing resource
2011-09 Border issue 2012-12 Sovereignty of Suyan Islands
2012-02 Tibet issue 2016-07 Military cooperation with the U.S. army
2012-05 Anti-China movement 2016-09 Thaad radar system 2015-02 Border issue 2016-12 Thaad radar system 2016-09 Tibet issue 2017-02 Thaad radar system 2016-10 Anti-China movement 2017-04 Thaad radar system 2017-06 Border issue 2017-09 Thaad radar system
Japan Taiwan
2010-09 Sovereignty of Diaoyu Islands 2007-10 Independent movement
2012-01 Sovereignty of Diaoyu Islands 2011-09 Military cooperation with the U.S. 2012-07 Sovereignty of Diaoyu Islands 2014-03 Anti-China movement
2012-12 Sovereignty of Diaoyu Islands 2016-06 92-Consensus 2013-01 Sovereignty of Diaoyu Islands 2016-09 92-Consensus 2013-04 Sovereignty of Diaoyu Islands 2016-11 92-Consensus 2013-12 Worship of war criminal 2017-04 92-Consensus 2015-10 Worship of war criminal 2017-06 92-Consensus 2016-10 Worship of war criminal 2017-09 92-Consensus
2017-03 Taiwan issue
2017-08 worship of war criminal
Hong Kong Philippines
2014-06 Independent movement 2012-05 Sovereignty of Huangyan Islands 2014-09 Independent movement 2013-01 Sovereignty of Huangyan Islands 2014-11 Independent movement 2013-09 Sovereignty of Huangyan Islands 2015-02 Anti-China movement 2014-02 Sovereignty of Huangyan Islands 2015-05 Anti-China movement 2016-03 Sovereignty of Huangyan Islands
Singapore
2016-11 Hong Kong issue
7
There are some other ways to measure political tensions in the existing literature. Fuchs and Klann (2013) only use the reception of Dalai Lama as the measure of having political tensions with China. Their measure is interesting but rather narrow compared to the measure used in this thesis. Gawakewize and Tang (2017) and Du et al. (2017) develop a coding system that allows them to go through all the news reported by People’s Daily China and Reuters, but in order to use the program, one has to set up key words (military conflicts, boycotts…). Compared to the measurement of political tension in this thesis, their measurement is very broad and general. Most of the studies on political tensions cannot measure the reaction from both governments, but as these studies point out, the main focus is on China’s trade flows. Therefore, particular political events only matter in this context when it is China that treats them as a political tension (Du et al., 2017).
3. Previous Studies and Economic Mechanisms
___________________________________________________________________________________
This part will review the previous literature, introduce the basic form of the gravity model, several studies on the gravity model components, studies on political tensions and explain the economic mechanisms.
_____________________________________________________________________
3.1. The Gravity Model
Tinbergen (1962) first develops the basic shape of gravity model providing a way to analyze the trading patterns empirically. With F being the international trade flows between country i and j, G a constant, M is economic mass of each country, D the distance between countries:
𝐹𝑖,𝑗= 𝐺
𝑀𝑖𝛽1𝑀
𝑗𝛽2
𝐷𝑖,𝑗𝛽3
Based on the basic form of the gravity model, trade flows are affected by the distance between countries, and the interaction of the countries' economic sizes. More specifically, the trade volume between two countries is expected to increase if their economic size (measured as GDP or population) increases, and the trade volume decreases if the transport costs increase (measured as the distance between countries’ economic centers). The gravity model can predict the trade flows between countries for
8
both goods and services more accurately than the traditional trade models, hence, the gravity model becomes a fundamental model of the study of trade patterns. McCallum (1995) tests the gravity model with data on trade flows between the U.S. and Canada, showing that the national border still matters for trade. His study shows that the gravity model is useful when analyzing the effect of the trade integration policies, and this study also contributes to the understanding of “border effects”. Melitz and Ottaviano (2008) apply the gravity model to study heterogeneous firms with the determination of bilateral trade flows, and Bernard et al. (2009) use gravity model to study the distinction between intensive and extensive margins of adjustment to trade shocks. These theoretical approaches provide a modern way to estimate the gravity model and how to interpret the coefficients from the gravity model.
The gravity model is now the most fundamental way to study the international trade flows. Shepherd (2012) argues that, by connecting countries’ economic size, trade cost (usually measured as the countries’ geographical and economic distances) and trade flows, the gravity model explains many basic features of international trade patterns, and it provides the clearest and most robust empirical findings. However, there are still some limitations of the gravity model. Like most of the economic models, gravity model is not able to analyze the impact of all the factors that can affect the international trade pattern, for example, the impact of history, the politic relationship between countries, and the culture, they are usually captured in the fixed effects.
3.2. The Gravity Model Components and International Trade Flows
3.2.1. Economic Size
Krugman (1980) argues that trade does not have to be a result of cross-country differences in technology or factor proportions, but simply a way of extending the market and allowing full exploitation of scale economies. The trade flows between countries are expected to increase with the increasing economic size of the importing and exporting countries. Hence, the trade flows are affected by the countries’ economic development. In many recent studies, GDP and population are used to measure
9
countries’ economic size (Karemera, Reinstra and Onyeocha, 2009; Fuchs and Klann, 2013; Cipkute ,2016; Zhang, Xi, Ji and Zhang, 2018). In particular, Karemera et al. (2009) argue that country’s population has a significant impact on international trade flows of agricultural goods. Cipkute (2016) uses the gravity model to study the trade patterns among Baltic countries. His results show that trading countries’ market sizes has significant impact on trade flows. Zhang et al. (2018) apply the gravity model to study the driving factors of the global and Asian energy trade flows.In their study, both GDP and population are used to measure the economic size of trading countries. Their estimated results indicate that there are no significant differences in the driving mechanism between the global and Asian trade patterns. The importer’s economic size has significantly positive impact on the energy import flows in their study. For exporters, the economic size still has significantly positive impact on energy trade flows, but weaker compared to the importers. It indicates that for energy market, the countries’ economic size has bigger impact on the demand side. But their results only show a weak evidence that population can affect country’s export and import behavior, although the coefficient of population variable shows a positive sign, but it is only significant at 10% level. And similarly, Fuchs and Klann (2013) study the trade patterns of China, and also use population and GDP to measure the market size of China’s trading partners. Their results indicate that for both the world and the European market, the size of the market has no impact on China’s trading behavior. The coefficients of China’s trading partners’ GDPs have mixed sign, but none of them are significant.
3.2.2. Distance
3.2.2.1. Geographical Distance
Linder (1961) points out that longer economic distance between two trading countries may have negative impact on the trade flows, because transport and other transaction costs increases with distance. Melitz (2005) argues that, distance in the gravity model can generate negative impact on international trade flows. Hanousek and Kocenda (2013) try to determine the main drivers of trade flows in Europe. In their study, they apply the distance weighted by population (measured as the distance between the largest cities of each country and weighted by the share of the city’s population in the country’s total population) as one of the estimated variables, but they find that the
10
distance plays a less important role in Europe compared to the rest of the world, due to the fact that the countries in Europe are relatively close to each other and the destination substitutes are plentiful. Their results show that the trade flows of all kind of goods are negatively affected by the distance, which matches the prediction from basic gravity model. However, the economic significance of distance factor is relatively low.
3.2.2.2. Economic Distance
Melitz (2007) argues that except for the distance in geographical terms, the North-South distances could also affect the trade flows between countries. Melitz argues that the negative impact of distance on trade flows is due to the increasing trade costs, but the distance between North and South might lead to opportunities for profitable trade. His results show that the distance between North and South does have positive impact on trade flows, when the geographical distance is controlled for. The impact of North-South distance is about 13% of the geographical distance, but the results are highly significant and robust. Melitz also points out that the impact of the North-South distance is decreasing, and this decrease may contribute to the negative impact of geographical distance on international trade flows between countries, if the North-South differences are not taken into account.
Le (2017) studies the impact of economic distance on trade flows in Vietnam. One of the key arguments of the study is how to measure the economic distances, she points out that the most natural way to measure distance is countries’ geographical distance, but with the increasing level of globalization, the role of geographical distance may be less important in international trade that it was in the past. Her results show that when both geographical distance and economic distance (measured as the natural logarithmic difference of GDP per capita between trading countries) are estimated, geographical distance shows significantly negative impact on trade flows and the economic distance has positive impact on trade flows. This result is similar to Melitz’s result (the distance between North and South have positive impact on trade flows).
11
3.3. Other Factors Affecting Trade Flows
3.3.1. Trade Agreement
According to the information provided by World Trade Organization (WTO), there are over 300 regional trade agreements (RTAs) in force and almost all WTO members have at least one RTAs with other countries. With the rising importance of bilateral and regional trade liberalization, it is important to study the impact of trade agreements on international trade flows. As argued by many researchers, the trade agreements and trade organizations can decrease the transaction costs between the member countries.
Viner (1950) argues that a trade agreement can increase trade flows among trade agreement members. The trade agreement decreases the trade barriers among the members and hence positively affects the trade flows. Lee and Shin (2006) study the impact of trade agreements on trade flows in East Asia. In their study, they analyze the gravity equation with yearly data in the period 1948-1999, with a dummy variable equals to one if two countries are both members of the same regional trade agreement. The authors also create an interaction dummy to interact the trade agreement variable and Frankel’s “natural trading partners” variables (geographical distance, culture and common language). Their estimation results show that the trade agreement does positively affect the trade flows between trade agreement members, and the impact can be doubled if the two countries are natural trading partners. The shorter the geographical distance, the stronger impact of trade agreement can be observed. Clausing (2001) uses product-level data between the U.S. and Canada to study the impact of trade agreement on trade flows, and her results show that in many sectors the North America Free Trade Agreement (NAFTA) can increase the trade flows. Gawarkiewicz and Tang (2017) argue that the membership of the same trade agreement or trade organization can limit the discriminatory tariffs at aggregated level, countries’ decisions regarding tariffs are restricted by WTO rules and trade agreements.
3.3.2. Real Exchange Rate
The real exchange rate is measured as the value of currencies, taking into account the change in the price level, hence, the real exchange rate indicates the value consumers
12
will actually pay for foreign goods. In the early 1980s, after the sharp increase in the value of the U.S. dollar, many researchers studied the impact of the changes in real exchange rate on international trade flows. Fielke (1985) and Hickock, Bell and Ceglowski (1988) argue that the changes in the trade volume can be partly explained by changes in the exchange rate. Sukar and Taisier (1996) studies the relationship between the real exchange rate and international trade flows in the case of the U.S.. Their study shows that the real exchange rate is a very important determinants of bilateral trade flows. Particularly, their results indicate that real depreciation of the U.S. currency makes the U.S. products more competitive in the international market. Wang (1993) studies China’s export since 1979, the results show that China’s trade is positively affected by the real depreciation of the Chinese currency. Similarly, Ghosh, Zaldueno, Catao and Joshi (2008) argue that in the emerging markets, the depreciation of real exchange rate can improve trade.
However, other studies argue that there is no relationship between real exchange rate and trade. Rose and Yellen (1989) point out that most of the researchers believe that the relationship between country’s trade balance and its real exchange rate shows a J-curve, and according to the J-J-curve, the depreciation of real exchange rate will decrease the trade balance in the short run but improve it in the long run. They argue that in the short-run, imports respond quickly to the change in real exchange rate, and the real depreciation of domestic currency increases the import price immediately and harms the country’s trade balance, and that is why the depreciation has negative impact on trade balance in the short-run. Rose and Yellen attempt to find the J-curve relationship between trade balance and the real exchange rate, but their results show that the J-curve relationship cannot be found in the U.S. data, and there is no evidence shows that the changes in real exchange rate have impact on trade in the short run.
3.3.3. Common Border and Language
Frankel (1997) comes up with the term “natural trading partners”. He argues that some countries are natural trading partners. These countries usually share common borders or are geographically very close to each other, and they may also share common
13
language or common history. Common border indicates that the trading partners are very close to each other, and the transport costs are relatively low. Naturally, low transport costs positively affect the trade flows. The impact of common language is similar to common border, with the common language allowing exporting and importing firms to communicate easily. It thus makes it easier for firms to gather information on foreign market, and thus decreasing the trade costs and uncertainty. With the low costs caused by common border or language, the countries can trade more compared to their other trading partners in the world. By using country-level data, Frankel’s results show that the trading volume increases if countries are “natural trading partners”. This “natural trading partner” status can explain the large part of the trade flows between these countries. Cafiso (2011) supports this argument in the European context, showing that the common language and common border can explain a large part of trade among EU countries.
3.4. Previous Studies on Trade Flows and Political Tensions
There are many studies showing that the military conflicts have negative impact on trade flows. Brown (1996) argues that the war in Azerbaijan at the end of 1980s interfered with oil deliveries from the Caspian Sea, and the wars in Afghanistan and Tajikistan disrupted central Asia's trade flows. Long (2008) argues that the “shadow of the war” decreases the trade volume, his results showing that the armed conflicts can increase the transaction costs, production costs and that firms tend to trade less under armed conflicts. Morrow (1999) argues that the increased trade flows can decrease the probability of having military conflicts. The bilateral trade flows will decrease the willingness of solving disputes with war for both counties due to increased loss from the war. Hegre, Russett and O'neal (2010) study the relationship between peace and trade, their results suggest that trade cannot decrease the number of conflicts, measured as the number of use of army force, but on the other hand, the use of army force has negative impact on international trade flows. As Davis and Meunier (2011) point out, the probability of bad political relationship ending up with military conflicts is rapidly reducing over time. More commonly, there are four stages of the political relationship between countries: friendly, normal, tense and threatening. The increasing number of disputes in International Court of Territory and Other Conflicts also indicates that it is
14
unlikely that countries willing to start a war due to the bad political relationship. With the fact that countries’ political conflicts are less extreme, there are some papers starting to study the impact of relatively moderate political conflicts on international trade flows, with most of the studies applying gravity model to study this impact.
Heilmann (2016) studies the impact of political tensions measured as politically motivated boycotts on the bilateral trade flows, like the boycotts of French wine in the U.S. in the year 2003, the Muslim countries’ boycotts on Danish goods in the year 2005, and the boycotts on Japanese products by Chinese consumers due to the Diaoyu Islands conflict in the year 2012. By using difference-in-difference estimation, his results suggest that the boycotts have strong negative impact on trade flows in both goods and services. The export flows from the boycotted country to the boycott country decreases significantly, by 18.8%, 3% and 1.7% for Denmark, Japan and France, respectively. For Japan and France, there is only a short-term impact on their export flows. The author also argues that even though the boycott has negative impact on boycotted countries’ export flows, it affects a very small share of boycotted countries’ total export flows in the same time period. Consumer goods are the most likely to be affected by the boycotts, particularly the signature export products of the boycotted country, like French wine and Japanese cars. Heilmann uses the boycotts which were caused by specific events as the measure of political tension, in the case of China and Japan, the same event of Diaoyu Islands is also captured by this thesis’s dataset.
Fuchs and Klann (2013) use the gravity model to examing the Dalai Lama impact, where the reception of Dalai Lama (who supports the independent movement of Tibet) is treated as the trigger of having a political tension with China. Chinese government frequently threaten its trading partners that the trading countries’ official meeting with Dalai Lama will harm the trade ties with China. Their results show that the countries that have received Dalai Lama at the highest political level have seen their export flows to China strongly and negatively affected. This indicates that those countries are punished through a reduction of their exports to China. The authors argue that the political relations may affect trade flows via country’s economic diplomacy. In Fuchs and Klann’s study, the reception of Dalai Lama is a very specific measure of political
15
tensions.
Du et al. (2017) study the relationship between political tensions and trade flows in the case of China and its major trading partners in the world. They argue that the political tensions may have only a relatively short-term impact on trade flows, so that using low frequency data (annually), may cause aggregation bias. By using the higher frequency monthly data, their results show that the political tensions have strong negative impact on China’s import flows from other counties. However, the political tensions have short-term impact on China’s import, the negative impact will vanish within two months. Du et al. (2017) develop a complicated coding program. The coding program allows them to go through the events reported by Renmin Ribao (People’s daily China), and also the information from China’s Foreign Ministry. However, by using the system, one has to set up several key words, such as demonstration, military conflicts etc. This measurement of political conflicts is rather broad and going through all the events is very time consuming. Moreover, in Du et al. (2017)’s study, the dataset only captures the China’s most important trading partners in the world, but some of China’s neighboring regions are ignored. As showed in Figure 1, China gets involved in many political tensions with the neighboring countries, like South Korea, Taiwan, Philippines and Hong Kong, and these regions are excluded in their study, but they are captured in this thesis’s dataset. Due to data limitation, the frequency of data in this thesis follows Gawarkiewicz and Tang (2017), using quarterly data instead of monthly.
Similar to Du et al. (2017), Gawarkiewicz and Tang (2017) find that political conflict, measured by negative reports in Reuters’ articles, seems to only affect bilateral trade between countries that are not both members of the World Trade Organization (WTO). For these countries, a 1 per cent rise in the tension score results in a 0.05 per cent decline in trade volume. (But thesis’s results show that the common membership of WTO and regional trade organization can decrease the negative impact that is caused by political tensions.)
16
point out that although there are increasing numbers of international conflicts between countries, the scales of these conflicts are often relatively small and will not end up with war or sanction. However, these small international political tensions may still affect international trade flows through several channels (the country level, firm level and consumer level). They argue that for countries like China or Russia, with governments having relatively strong power and also direct and almost absolute control of the economy, trade can be used as a tool against other countries. These countries may avoid trading with those counties which they have conflicts with, in order to uphold their governments’ security and their power. From the firm level point of view, when the political tension occurs, firms will face a higher risk of war or sanction. Under such situation, firms tend to choose a safer strategy in order to avoid a bigger loss. On the other hand, firms may stop importing or decrease the amount of imports from firms in another country, due to the pressure from the public and society.
The effect of political tensions on trade flows may also be generated at the individual level, as consumers may refuse to consume the products that are produced in the country which consumers’ home country has tension with. Individuals may take this action as a support to their home country and against the other country. During the period when China and Japan were arguing about the sovereignty over the Diaoyu Islands, several big demonstrations happened across China, and the movement resulted in anti-Japanese boycotts, with the sales of Japanese vehicles dropping significantly. Similarly, Chavis and Leslie (2009) show that the export volume of French wine from France to the U.S. decreased during the period when Americans criticized France’s lack of support in Iraq war, which indicates that the political tensions have impact on consumers’ choice of goods, and as a result, affect the trade volume between countries at the aggregated level.
3.5. The Economic Mechanisms
3.5.1. Producer Behavior
Johanson (1977) argues that when firms enter a new market, they will face a high uncertainty, and this uncertainty may be caused by the lack of knowledge about the new market. Establishing a new export market is associated with gathering new knowledge
17
and information and attracting new customers and distributors. The new market has its own specific geographical characteristics and domestic products, and for new enterers, it is very costly to gather all the information. The international markets differ from each other and have different consumer preferences. This special condition of foreign markets indicates that the individual firm’s knowledge about the new market might affect the firm’s cost by entering the new market. Vahlne (1990) argues that entering a new market is full of uncertainty and costly, but by the process of building the new link and operating in the new market, individual firm will accumulate more information and knowledge to decrease this uncertainty for introducing new product to the market in the future. This may indicate that the more internal information and knowledge the firms have about foreign market, the lower fixed entry cost to build a new export link. Aitken et al. (1997) have done the case study of export behavior, and their results indicate that firms that enter the foreign markets can decrease the cost for other firms to entry, via knowledge spillovers. Johansson (2010) also suggests that there is a significant positive effect of firm’s former export experience on the probability that a firm becomes a permanent exporter in the current period. Melitz (2003)’s framework argues that once firms became the permanent exporters, they face a fixed cost of production and a fixed cost of exporting. Moreover, by selling the products to a new market, firms can expand their market, increase the sails and hence get higher revenue. Once they enter the market, the exporters will only face decreasing entry costs until they became permanent exporters, when they will still face fixed costs. Based on these arguments, the more firms export, the higher revenues it will get. With the decreasing entry costs and the gains from doing exports, it is unlikely that when exporters’ home country gets involved in a political tension, the firms will stop exporting to the “enemy country”. Particularly, in this thesis the political tension is defined as China’s official statement, one can argue that only China treats the certain event as political tension. Hence, Chinese firms’ exporting behavior will unlikely be affected by the political tensions.
3.5.2. Consumer Behavior
Several studies have argued that the countries’ import flows can be affected by the shift of consumers’ preference. Mayda and Rodrik (2005) use individual level data to study the impact of individual preferences on international trade flows. Their results suggest
18
that individuals’ preference have significant impact on trade flows, but it also depends on individual’s education level and economic status. More specifically, income and education level are positively correlated with pro-trade attitude, the higher income and education level, the less change of personal preference. Chinese consumers’ average income and education level is lower than most of the developed countries (World Bank, 2017). Hence, their preferences of goods are relatively easy to change under external shocks. Disdier and Mayer (2007) study the relationship between bilateral trade patterns and individuals’ opinions of trading countries. After analyzed the trade flows with EU 15 countries, their results show that consumers’ opinions of the trading countries have statistically strong robust effect on international import flows. Similarly, Guiso et al. (2009) study the relationship between trust and countries’ trade behaviors. Trust in their paper is measured as the similarity in culture, religious, genetic and history of conflicts. And their results indicate that the low trust level between countries will lead to low trade flows. Fuchs and Klann (2013) argue that China’s import behavior is strongly affected by the Chinese consumers opinions of the trading countries. Through media (newspaper, tv, internet), Chinese consumers’ opinion of China’s trading partners might get affected by Chinese government. When Chinese government releases negative statement about a foreign trading partner, Chinese consumers may have negative opinions to that country as well, hence, their preferences of products shift. A political tension occurs in China, the demand of consumption goods which from the country China is having tension with, will be expected to decrease, particularly the goods which China largely imported from the country. Hence, the hypothesizes of this paper are:
Hypothesize 1: The political tensions may have negative impact on China’s import
flows from its neighboring countries.
Hypothesize 2: The political tensions are unlikely to affect China’s export patterns with
19
4. Research Methodology and Data Description
___________________________________________________________________________________
This section will describe the research methodology including empirical model which is applied to test the main hypothesises, and the data that is used for the estimation.
_____________________________________________________________________ For the political tensions variable Tension is measured as the official protest or accusation regarding country j in quarter t from China’s Foreign Ministry. In the case of Hong Kong, the statements of protests and accusations are announced by Hong Kong, Macao Affairs Office, and due to 1992 Consensus, Taiwan affairs are considered as China’s domestic affairs, hence, they are released by Taiwan Affairs Office. The data of trade flows between China and country j is obtained from the Customs Information of China. One concern is that the measure does not exploit the possibility of multiple tensions happening in the same quarter with the same trading partner to measure the intensity of political tensions. However, such event happens only three times during the sample period of this thesis. This does not leave enough data variation to exploit the intensity of political tensions in a systematic way.
Following Gawarkiewicz and Tang’s work (2017), this paper uses the geometric mean of population of China and its trading partner to analyze the impact of size of the market (POP). But due to the limitation of the frequency of the population data (no quarterly data of population at country level), the yearly population data is used for each quarter within the year (Gawarkiewicz and Tang, 2017; and Fuchs and Klann, 2013). The population data is provided by IMF Economic Outlook database and covers the period from the year 2007 to 2017 for all sample countries.
20 Table 2 The list of variables in the baseline gravity model
Variable Explanation Data source
𝑙𝑛𝑇𝑟𝑎𝑑𝑒𝑖,𝑗,𝑡
The dependent variable is measured as the level of flows between country i (China) and
j, calculated asln( 𝑇𝑟𝑎𝑑𝑒𝑡
𝑇𝑟𝑎𝑑𝑒𝑡−1)
The Customs-information of China
𝑙𝑛𝑃𝑂𝑃𝑖,𝑗,𝑡
Economic size of the markets, geometric mean of the country i (China) and j’s
population
IMF
𝑙𝑛𝐷𝐺𝐷𝑃𝑃𝑖,𝑗,𝑡
The economic distance, is measured as the distance of GDP per capita between country i and j, calculated asln(𝐺𝐷𝑃𝑃𝑒𝑟𝐶𝑎𝑝𝑖𝑡𝑎𝐶𝑜𝑢𝑛𝑡𝑟𝑦𝑖
𝐺𝐷𝑃𝑃𝑒𝑟𝐶𝑎𝑝𝑖𝑡𝑎𝐶𝑜𝑢𝑛𝑡𝑟𝑦𝑗)
IMF and Statistic China
𝑇𝑒𝑛𝑠𝑖𝑜𝑛𝑖,𝑗,𝑡
The main variable of interests, the political tensions between country i and j, Dummy
equals to 1 if there was political tension happened in quarter t.
Statements from Foreign Ministry of China, Taiwan Affairs Office and Hong Kong Macao
Affairs office
𝐴𝑔𝑟𝑒𝑒𝑚𝑒𝑛𝑡𝑖,𝑗,𝑡
A dummy variable that equals to 1 if country i and j belong to at least one common trade
agreement except for the common membership in the (WTO)
Ministry of Commerce of China
𝑙𝑛𝑅𝐸𝐸𝑅𝑖,𝑗,𝑡
The real effective exchange rate between country i and j at time t, increase in REER indicates the appreciation of foreign currency (year 2010 = 100)
Federal Reserve Bank of St. Louis
Interaction𝑖,𝑗,𝑡
The interaction dummy of 𝐴𝑔𝑟𝑒𝑒𝑚𝑒𝑛𝑡𝑖,𝑗,𝑡
and 𝑇𝑒𝑛𝑠𝑖𝑜𝑛𝑖,𝑗,𝑡
∅𝑖,𝑗, 𝜃𝑡 The Fixed Effects
𝜀𝑖,𝑗,𝑡 The error term
𝛽0,𝛽1…𝛽7 The coefficient for each estimated variable
The information about Trade Agreement is used as a control variable for tariffs, all the sample countries in the sample period are the members of WTO. China’s custom only reports the average bilateral tariffs, hence, this thesis cannot control for tariffs at aggregated level directly (does not vary across country). But as Gawarkiewicz and Tang (2017) argued, the membership of WTO (the Most-Favored-Nation-Treatment) and common membership of trade agreement can limit the discriminatory tariffs at
21
aggregated level. The data of Trade Agreement is obtained from Ministry of Commerce of China, this dummy variable equals to 1 if both China and country j belongs to at least one common regional trade agreement. The real exchange rates (REER) are obtained from the Federal Reserve Bank of St. Louis. And the Interaction is an interaction dummy of Tension and Trade Agreement, in Gawarkiewicz and Tang (2017), they use this term to test whether the common membership of regional trade agreement and WTO can limit the negative impact of the political tensions. Based on Le (2017), the difference in GDP per capita can be used to measure the economic distance. The quarterly GDP of China is obtained from Statistic China database, and the GDP of China’s trading partners are from the IMF database, but as mentioned before, due to the availability of population data, the quarterly GDP per capita is calculated as the quarterly GDP divided by yearly population.
Table 3 Data Description
The panel dataset covers the time period from 2007 to 2017, with quarterly frequency, all the sample countries are China’s top neighboring trading partners. The sample countries include Japan, South Korea, Taiwan, Philippines, Hong Kong, Singapore, India, Thailand, Indonesia and Malaysia. These countries count for over 90% of China’s total trade volume in Asia (Custom of China, 2017). Among the sample countries, Japan is China’s biggest trading partner, with the total trade volume of 3.2 trillion US dollars in the sample period, Hong Kong is the second biggest trading partner, with total trade volume 3.2 trillion US dollars, and Philippines is China’s smallest trading partner, with 0.41 trillion US dollars. Also, there were total 47 political tensions happened between China and its seven trading partners, Korea, India, Japan, Philippines, Taiwan, Hong
TRADE IMPORT EXPORT POP DIS TENSION AGREEMENT Mean 33333281 15483124 17850157 377.0458 1.308204 0.102273 0.529545 Median 19619210 7583343. 10081417 281.5156 1.177545 0.000000 1.000000 Maximum 1.14E+08 51528487 1.10E+08 1353.367 2.508719 1.000000 1.000000 Minimum 3933308. 1644972. 1477346. 77.86784 0.341596 0.000000 0.000000 Std. Dev. 25787166 14722113 19920895 337.2753 0.737830 0.303352 0.499694 Skewness 0.947036 1.007354 2.389072 1.876161 0.187141 2.625205 -0.118389 Kurtosis 2.715880 2.434097 8.785115 5.649444 1.579279 7.891702 1.014016 Jarque-Bera 67.25096 80.28711 1032.134 386.8237 39.57316 944.0852 73.33693 Probability 0.000000 0.000000 0.000000 0.000000 0.000000 0.000000 0.000000 Sum 1.47E+10 6.81E+09 7.85E+09 165900.2 575.6098 45.00000 233.0000 Sum Sq. Dev. 2.92E+17 9.51E+16 1.74E+17 49938269 238.9887 40.39773 109.6159 Observations 440 440 440 440 440 440 440
22
Kong and Singapore.
Figure 2 Political Tensions and Trade Flows
Source: Custom of China and Foreign Ministry of China & Hong Kong, Taiwan Affairs Offices
As discussed in the Background section, Figure 2 shows the changes of trade flows and political tensions between China and its trading partners. It is clear that most of the
23
political tensions are concentrated in the second half of the sample time period (2012-2017), which is under Xi Jinping’s presidency. Following the political tensions, China’s import flows generally show a sharp decrease. From the trade flow patterns, it is not clear whether there are seasonal changes of the import and export flows, hence, the data in the estimation is seasonally adjusted.
Following Gawakiwize and Tang (2017), this thesis also applies a gravity model to study the impact of political tensions on international trade flows. The baseline model for the quarterly bilateral trade is:
𝑙𝑛𝑇𝑟𝑎𝑑𝑒𝑖,𝑗,𝑡 = 𝛽1+ 𝛽2𝑙𝑛𝑃𝑂𝑃𝑖,𝑗,𝑡+ 𝛽3𝑇𝑒𝑛𝑠𝑖𝑜𝑛𝑖,𝑗,𝑡+ 𝛽4𝐴𝑔𝑟𝑒𝑒𝑚𝑒𝑛𝑡𝑖,𝑗,𝑡
+ 𝛽5𝑙𝑛𝑅𝐸𝐸𝑅𝑖,𝑗,𝑡 + 𝛽6𝐼𝑛𝑡𝑒𝑟𝑎𝑐𝑡𝑖𝑜𝑛𝑖,𝑗,𝑡+ 𝛽7𝑙𝑛𝐷𝐺𝐷𝑃𝑃𝑖,𝑗,𝑡+ ∅𝑖,𝑗+ 𝜃𝑡 + 𝜀𝑖,𝑗,𝑡(1) Variables from the baseline model in equation 1 are explained in Table 2. As argued by Frankel (1997) and Fuchs and Klann (2013), the trade flows are largely affected by geographical distance, common borders, common language and common culture. As these factors do not change over time, in order to capture these factors, most of the studies on international trade flows use Fixed Effects estimation (FE) instead of OLS estimation.
5. Empirical Results
___________________________________________________________________________________
This section presents the basic estimation results from basic OLS and provides several additional estimations to check for the robustness
_____________________________________________________________________
5.1. Basic Results
In order to test the hypothesizes, we run three regressions for China’s import flows, China’s export flows and bilateral trade flows separately. Table 4 presents the estimation results from the basic gravity equation with the political tension dummy. Following Gawarkiewicz and Tang (2017), this thesis also applies Fixed Effects (FE) estimation to analyze the data, also, White-Cross-Section method is used to control for
24
heteroskedasticity, and the data is adjusted for seasonality, this applies for all estimations in this thesis.
Table 4 Estimation of the Level of Trade Flows
Dependent Variables Bilateral Trade China's Import China's Export Variables LNPOP 1.200652*** -0.105711 2.639894 (0.0070) (0.9586) (0.4641) TENSION 0.013585 -0.06413** -0.027763 (0.5544) (0.0370) (0.3374) AGREEMENT 0.089220*** 0.102898* 0.107992 (0.0000) (0.0966) (0.1026) LNREER 0.184225 -0.020182 0.183313 (0.1005) (0.9261) (0.4670)
LNDGDPP 1.94E-07 3.76E-05 -2.51E-06
(0.9823) (0.1019) (0.9301) INTERACTION -0.089306 0.045672** -0.090184 (0.4531) (0.0301) (0.5011) R-squared 0.954303 0.969572 0.950792 Period 44 44 44 Cross-section 10 10 10 Observation 421 421 421 Notes:
All regressions with country and time fixed effects.
P-values in brackets; * significant at 10%; ** significant at 5%; *** significant at 1%.
White-Cross-Section standard errors & covariance Seasonally Adjusted
The results show no significant results of basic gravity model components (market size) for both China’s import or export patterns. However, the market size has positive impact on China’s bilateral trade flows. 1 per cent increase in the joint population size, the bilateral trade flows will increase by 1.2 per cent, the result is significant at 1 per cent level. The results from Table 4 also show that political tension has strong negative impact on China’s import flows, the result is statistically significant at 5 per cent level, and it indicates that the political tension between China and its trading partner will
25
decrease China’s import flows from that country by -6.21 per cent1. The political
tension thus has negative impact on China’s imports, supporting the Hypothesis 1. Moreover, the results from the estimation show that there is no relationship between political tensions and bilateral trade flows and China’s export flows. Even though the coefficient of political tension shows negative sign, but it is not statistically significant.
As argued above, the political tension may affect country’s trade flows through three channels. At the country level, Gawarkiewicz and Tang (2017) argue that Chinese government may use import as a tool to achieve its political purpose. By stopping import or decreasing the import volume, China can punish the corresponding country. Du et al. (2017) point out that when China is having a political tension with its foreign trading partners, the importing firms in China might be more concerned, about government pressure. Under such situation, firms will face higher uncertainty and higher risk. In order to avoid the additional losses and costs, firms may decrease the import volume from the foreign market. For consumer behavior, Disdier and Mayer (2007) argue that consumers’ preference for goods changes with their opinions of the origin of goods. With political tension, consumers may boycott the goods from the country China is having political tension with. And through these channels, it is very likely that political tensions have negative impact on China’s imports, and results from the estimation support this argument.
There is a possibility that the other country may decrease the import volume from China, hence harming China’s export due to the same political tension. However, the political tension in this thesis is measured as the official protests from China’s officials. Under this definition, one can argue that only China treats the certain event as a political tension. The reaction from another country is not measured in this thesis. Moreover, by exporting, firms can accumulate more information and knowledge of the foreign market, hence decreasing the entry cost and generating positive spillovers to other exporting firms. Thus, when China is having political tensions with other countries, it is unlikely that China’s exporter will stop exporting or decrease the exporting volume. And the
26
estimation shows that the political tensions have no impact on China’s export behavior, which support the Hypothesis 2.
The results in Table 4 show that the regional trade agreement has positive impact on China’s bilateral trade flows and imports. If the foreign country and China belongs to the same regional trade agreement, it will increase the flows of bilateral trade flows and imports by 9.33 and 10.8 per cent respectively. The results for the estimation suggest that the regional trade agreements have direct impact on China’s trade flows. Moreover, the interaction term (Tension*Agreement) shows significant positive results for China imports. As Gawarkiewicz and Tang (2017) point out, the interaction term should have the opposite sign of the political tension. It indicates that the regional trade agreement can decrease the negative impact from the political tension. The significant positive results from the interaction term suggest that for China’s neighboring countries, joining the same regional trade agreement with China can decrease the negative impact from political tensions on their exports. China’s trade flows with its neighboring countries does not affected by the changes of real exchange rate. Like the results are presented in Rose & Yellen (1989) and Rodrik (1994), the impact of the change in real exchange rate on China’s import and export flows remains unclear.
In the case of the estimation results using the level of trade flows as dependent variable, the R-squared values are high. The R-squared values are bigger than 95% for all three estimations for bilateral trade flows, both with regard to China’s import flows and export flows. This indicates that the data of trade flows in the estimations may have trend problem. The author is aware of the possible trend problem and in order to de-trend the data, this thesis applies the logged first difference(ln( 𝑇𝑟𝑎𝑑𝑒𝑡
𝑇𝑟𝑎𝑑𝑒𝑡−1)) instead of the
level of trade flows in Appendix 1-3. To solve the trend problem without resorting to the use of first differences instead of levels could be a subject for further research.). There is another possible explanation for the high R-squared value. Frankel (1997) argues that the trade flows are largely affected by common borders, common language, common cultures, and these factors are captured by the fixed effects in this thesis’s estimation.
27
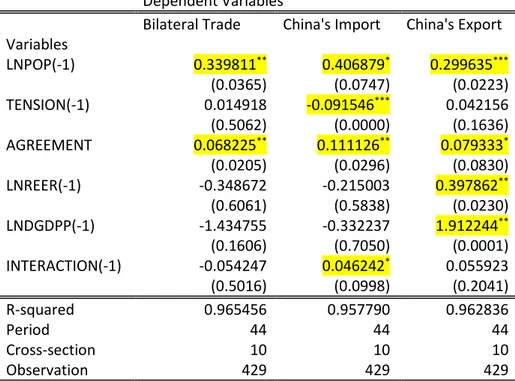
However, the estimations in Table 5 show more significant results for the control variables. Especially for the population variable. The market size has significant positive impact on China’s imports, exports and bilateral trade with its trading partners. In particular, the geometric mean of China and its trading partner’s population increases by 1 percent, China’s bilateral trade flows, import flows and export flows in the next quarter will increase by 0.34, 0.41 and 0.3 respectively. As argued by Krugman (1980), Karemera et al. (2009) and Cipkute (2016) the estimation results support that the market size has positive impact on international trade flows. As defined in the dataset, the increase in the real exchange rate indicates appreciation of the foreign currency. Based on the concept, the products from China are cheaper for foreign importers. Wang (1993) and Ghosh et al. (2008) argue that the depreciation of domestic currency will improve country’s export flows. The result presented in Table 5 shows that if the real exchange rate increase by 1 per cent (foreign currency appreciation), China’s export flows in the next quarter will increase by 0.4 percent. The result is statistically significant at 10 per cent level. For the economic distance variable, the distance in GDP per capita (DGDPP), the estimation shows significant positive results. 1 per cent increase in the distance of GDP per capita, China’s export flows in the following quarter will increase by 1.9 per cent, the results are significant at 5 per cent level. Although there are some classic trade theories such as Linder (1961) argue that the distance in GDP per capita can be used to measure the similarity in taste, the more similar they are in taste, the more trade between countries. However, Melitz (2007) and Le (2017) argue that the difference in GDP per capita might lead to opportunities for profitable trade. Their results show that the distance between North and South does have positive impact on trade flows.
5.2. Robustness Test
The estimation results in the previous subsection indicate that the political tensions have an immediate negative impact on China’s import behavior. Similar to the results in Fuchs & Klann (2013) and Davis & Meunier (2016), the political tensions can negatively affect country’s trade flow immediately. However, Heilmann (2016) and Du et al. (2017) argue that political tensions can affect country’s import flows not only immediately, but also for a longer time period.
28
Moreover, Gawarkiewicz and Tang (2017) point out that China has the highest number of political tensions with its biggest trading partners, the higher trade volume with China, the bigger number of political tensions happened in their data sample, it may indicate that there is a reversed causality between political tensions and trade flows.
Figure 1 shows the similar pattern, China has more political tensions with its bigger
trading partners (Japan, South Korea, Hong Kong and Taiwan).
In order to reduce the reversed causality issue, the estimation in this section will use lagged variables. By using lagged political tension variable, it can test the impact of political tensions for the next quarter, and also, using lagged tension variable is more likely to estimate the impact of political tension on trade flows, than another way round.
Table 5 presents the estimation results by using lagged data.
Table 5 With Lagged Variables
Dependent Variables
Bilateral Trade China's Import China's Export Variables LNPOP(-1) 0.339811** 0.406879* 0.299635*** (0.0365) (0.0747) (0.0223) TENSION(-1) 0.014918 -0.091546*** 0.042156 (0.5062) (0.0000) (0.1636) AGREEMENT 0.068225** 0.111126** 0.079333* (0.0205) (0.0296) (0.0830) LNREER(-1) -0.348672 -0.215003 0.397862** (0.6061) (0.5838) (0.0230) LNDGDPP(-1) -1.434755 -0.332237 1.912244** (0.1606) (0.7050) (0.0001) INTERACTION(-1) -0.054247 0.046242* 0.055923 (0.5016) (0.0998) (0.2041) R-squared 0.965456 0.957790 0.962836 Period 44 44 44 Cross-section 10 10 10 Observation 429 429 429 Notes:
All regressions with country and time fixed effects.
P-values in brackets; * significant at 10%; ** significant at 5%; *** significant at 1%.
Seasonally Adjusted
29
The results are similar to Gawarkiewicz & Tang (2017) and Heilmann (2016)’s findings. The political tensions can negatively affect China’s import for a longer time period. The political tension from the last quarter can decrease China’s imports by 8.74 per cent, and the result is highly significant at 1 per cent level. The common membership in a regional trade agreement has positive impact on China’s trade flows, and the interaction term (Tension*Agreement) shows significant positive result. The results indicate that the common membership with China in a regional trade agreement can decrease the negative impact caused by political tension on its export to China.
Following Fuchs and Klann (2013), this thesis also applies the System GMM estimation (Arellano and Bover, 1995) as a robustness test. System GMM estimation is used to deal with potential endogeneity issues. As Piper (2014) argues, the suitable instruments come from the dataset: The lagged difference and lagged level of dependent variable. They are likely to be correlated with the dependent variable but not with the error term. In System GMM estimation, the differences are instrumented by lagged levels, and the levels are instrumental by lagged differences. Results of GMM estimation are presented in Table 6
The results are similar to the results presented in Table 5. The GMM estimation confirms that political tensions have negative impact on China’s import behavior. The result is statistically significant at 5 per cent level. The results also show that the political tension variable has significant negative impact on China’s imports, but there is no evidence showing that there is relationship between political tension and China’s export flows. And the results provide strong and robust support to the Hypothesis 1 and Hypothesis 2. The regional trade agreement has no direct impact on China’s trade behavior, but the Tension*Agreement interaction term shows significant positive result. Which confirmed the basic findings in Table 4: belonging to a same regional trade agreement with China can decrease the negative impact on other countries export to China, under the political tension. For control variables, the results from System GMM estimation confirms that only the size of the market has significant impact.
30
Fuchs and Klann (2013) argue that in the case of China, the Chairman of the communist party can also affect the impact of political tension on China’s trade behavior. They find that only under Hu Jintao’s rule of China, the political tensions have significant negative impact on China’s import. The estimation results in this thesis have similar finding, the results are presented in Appendix 4. The political tensions that happened in both Hu Jintao’s era (2007-2012) and Xi Jinping’s era (2012-2017) have negative impact on China’s import, but the tensions happened in Xi Jinping’ era have stronger negative impact on China’s import behavior.
Table 6 System GMM regression
Dependent Variables
Bilateral Trade China's Import China's Export Variables LNPOP 0.586021** 0.514930 0.815222 (0.0337) (0.5775) (0.8650) TENSION -0.139441 -0.274324** 0.080828 (0.1246) (0.0371) (0.2326) AGREEMENT -0.020995 -0.042634 0.025589 (0.5222) (0.3783) (0.6767) LNREER -0.048424 -0.300091 0.079891 (0.8080) (0.2635) (0.8772) LNDGDPP 0.051252 -0.707877 0.181378 (0.9287) (0.3081) (0.9304) INTERACTION 0.253957 0.538911** -0.176565 (0.1100) (0.0249) (0.5154) R-squared 0.953739 0.965412 0.950792 Period 24 24 24 Cross-section 10 10 10 Observation 239 239 239
Notes: Method: Panel Generalized Method of Moments All regressions with country and time fixed effects. White cross-section standard errors & covariance Seasonally Adjusted
2SLS instrument weighting matrix
P-values in brackets; * significant at 10%; ** significant at 5%; *** significant at 1%.