AbstrAct
background A positive patient safety climate within teams has been associated with higher safety performance. The aim of this study was to describe and compare attitudes to patient safety among the various professionals in surgical teams in Swedish operating room (OR) departments. A further aim was to study nurse managers in the OR and medical directors’ estimations of their staffs’ attitudes to patient safety.
Methods A cross-sectional survey with the Safety Attitudes Questionnaire (SAQ) was used to elicit estimations from surgical teams. To evoke estimations from nurse managers and medical directors about staff attitudes to patient safety, a short questionnaire, based on SAQ, was used. Three OR departments at three different hospitals in Sweden participated. All licensed practical nurses (n=124), perioperative nurses (n=233), physicians (n=184) and their respective manager (n=22) were invited to participate.
results Mean percentage positive scores for the six SAQ factors and the three professional groups varied, and most factors (safety climate, teamwork climate, stress recognition, working conditions and perceptions of management), except job satisfaction, were below 60%. Significantly lower mean values were found for perioperative nurses compared with physicians for perceptions of management (56.4 vs 61.4, p=0.013) and working conditions (63.7 vs 69.8, p=0.007). Nurse managers and medical directors’ estimations of their staffs’ ratings of the safety climate cohered fairly well. conclusions This study shows variations and some weak areas for patient safety climate in the studied ORs as reported by front-line staff and acknowledged by nurse managers and medical directors. This finding is a concern because a weak patient safety climate has been associated with poor patient outcomes. To raise awareness, managers need to support patient safety work in the OR.
IntroductIon
Surgical care consists of multiple interactions among professionals, patients and healthcare departments, including the operating room (OR).1 The OR department is a complex
setting involving teamwork and advanced
technology together with a population of patients with multiple problems2 and high
productivity demands.3 Tension between
the conflicting goals of efficiency and safety may produce risks for adverse events.4
Multiple factors are critical to achieving patient safety, including organisational and managerial factors, teamwork, individual resources, cognitive skills and work envi-ronment.5 Patient safety is a leadership task
because the organisation is adherent to the manager’s priorities and level of commit-ment to patient safety and how patient safety information is spread, understood and imple-mented in clinical work.6 However, managers
are shown to have a more positive percep-tion of the patient safety climate than the front-line staff.7–9 This lack of coherence is a
concern as managers play a decisive role in promoting team performance and creating a culture of safety10 and thus, managers have
to be aware of their staffs’ attitudes to patient safety culture in their everyday leadership practice.7
Patient safety culture is a component of the organisational culture, defined as the shared values, norms and procedures related to patient safety within an organisation,
Interprofessional team assessments of
the patient safety climate in Swedish
operating rooms: a
cross-sectional survey
Camilla Göras,1,2,3 Maria Unbeck,4,5 Ulrica Nilsson,1 Anna Ehrenberg1,6
To cite: Göras C, Unbeck M, Nilsson U, et al. Interprofessional team assessments of the patient safety climate in Swedish operating rooms: a cross-sectional survey. BMJ Open 2017;7:e015607. doi:10.1136/ bmjopen-2016-015607 ► Prepublication history for this paper is available online. To view these files please visit the journal online (http:// dx. doi. org/ 10. 1136/ bmjopen- 2016- 015607).
Received 20 January 2017 Revised 15 May 2017 Accepted 21 June 2017
1School of Health Sciences,
Faculty of Medicine and Health, Örebro University, Örebro, Sweden
2Department of Anesthesia,
Intensive Care Unit, Falu Lasarett, Sweden
3Centre for Clinical Research,
Falun, Dalarna, Sweden
4Department of Orthopedics,
Danderyd Hospital, Stockholm, Sweden
5Department of Clinical
Sciences, Danderyd Hospital, Karolinska Institutet, Stockholm, Sweden
6School of Education, Health
and Social Studies, Dalarna University, Falun, Sweden correspondence to Camilla Göras;
camilla. goras@ outlook. com
strengths and limitations of this study
► This study is based on Safety Attitudes Questionnaire data from the whole surgical team and nurse managers and medical directors’ estimations of their staffs’ attitudes to patient safety in the operating room (OR).
► As the study was based on a convenience sample, generalisability of the results is limited although the sample represents a variety of OR departments based on size and location.
► The response rate was 61% and may imply bias. However, it is an expected and acceptable level in a Swedish context.
department or team.11 Patient safety climate is the
profes-sionals’ shared perceptions or attitudes about the priority of safety in the organisation.12 Concordance in
percep-tions of patient safety climate indicates positive interac-tions between professions while disparate scores may indicate a dysfunctional patient safety culture.13 A weak
patient safety climate has been associated with higher rates of surgical complications14 and poorer patient
outcomes, such as increased adverse events, medication errors, readmissions and longer length of stay.15 On the
other hand, a positive patient safety climate is associated with higher safety performance.16
Several tools exist for measuring patient safety climate.17 18 The Safety Attitudes Questionnaire (SAQ)
is one of the most recommended instruments.19 Studies
using SAQ have shown a relationship between positive attitudes among staff and positive patient outcomes such as reduced healthcare-associated infections,18 and SAQ
has been adapted for use in different settings.20 However,
perceptions of patient safety climate may vary. Differ-ences have been reported between countries,21 between
the sexes,22 and in hospital and professional ratings of the
overall patient safety climate.23 24
Teamwork is one factor in the patient safety climate. Today’s complex healthcare with increased specialisation makes interprofessional teamwork essential for effective and safe patient management. Previous studies in the OR have shown discrepancies among professionals’ percep-tions of teamwork,25–27 which may have a negative effect
on patient safety and quality of care. Hence, it is crucial to explore if diversity exists in the perception of other factors related to patient safety climate among profes-sionals within the surgical team, and how the perceptions of patient safety climate cohere between managers and front-line staff. Establishing and maintaining a safety culture is a leadership responsibility, so it is pertinent to explore how accurately managers perceive the patient safety climate in the surgical teams. This is an unexplored area within Swedish OR context. In addition, studies of patient safety climate within surgical teams in the OR are limited.28 Therefore, the aim of this study was to describe
and compare attitudes to patient safety among the various professionals in surgical teams in Swedish OR depart-ments. A further aim was to study nurse managers and medical directors’ estimations of their staffs’ attitudes to patient safety in the OR.
Methods
Settings and sample
The surgical team in Swedish ORs mostly consists of one senior (and sometimes one junior) surgeon, an anaes-thesiologist (junior or senior), a nurse anaesthetist, an OR nurse and a circulating nurse (commonly a licensed practical nurse; LPN). Since LPNs are team members of the surgical team and this paper aims to study surgical teams, LPNs were included in the sample. The nurse anaesthetist and OR nurse are defined in this paper as
perioperative nurses. Surgeons often are scheduled for work in the OR department, in parallel with other work tasks at their hospital departments. Anaesthesiologists, perioperative nurses and LPNs, on the other hand, work predominantly in the OR department.
To include a variety of Swedish hospitals and OR depart-ments, a convenience sample of hospitals of different sizes with a central OR department was made. Three hospi-tals consented to participate in the study: one university, one regional county and one local county hospital. The surgical teams consisted of the same professions regard-less of hospital size. The university hospital had one central OR department divided into two sections that serve different surgical specialties such as gynaecology, orthopaedic surgery, neurosurgery, thoracic surgery, plastic surgery, maxillofacial surgery and general surgery. The other two hospitals had one central OR department serving a variety of surgical specialties such as gynae-cology, orthopaedic and general surgery. The partici-pating hospitals were chosen from different geographical parts of Sweden. All operative members of the surgical team were included based on the inclusion criteria: at least 6 months of working experience in the OR and avail-ability during the data collection period. The physicians had to be junior or senior physicians in selected surgical specialties.
sample size calculation
The sample size was based on a calculation that demon-strates a mean difference of 0.5 between groups (3.0 for perioperative nurses and 3.5 for physicians) for safety climate (measured by the SAQ index) with a significance level (α) of 5% and a power (β) of 80%, based on previous studies in similar populations.7 29 Based on the
assump-tion, the calculated sample size was 134 perioperative nurses and 89 physicians. To cover for internal dropout, at least 187 perioperative nurses and 125 physicians had to be recruited based on the conservative assumption of a 60% response rate. In addition, 124 LPNs were recruited to include all professional groups in the surgical team.
Instruments
Data were collected through the SAQ-OR version.20 In a
previous study, the SAQ-OR version was translated into Swedish and tested for its psychometric properties.29 The
Swedish version of SAQ-OR comprises 57 items with 30 belonging to six factors: teamwork climate (six items), job satisfaction (five items), perceptions of management (four items), safety climate (seven items), working condi-tions (four items) and stress recognition (four items).29
The 27 items not included in the six factors are not presented in this paper. According to Sexton et al,20 these
items might be of use for independent diagnostic proce-dures or for research purposes.
The answers are based on respondent experiences in the OR department where they work, given on a 5-point Likert scale: 1=Disagree Strongly, 2=Disagree Slightly, 3=Neutral, 4=Agree Slightly and 5=Agree Strongly. To
allow calculation of mean scores of the SAQ factors, a conversion was made to a 100-point scale, in accordance with the recommendations of the developer and previous studies on the SAQ: 1=0, 2=25, 3=50, 4=75, 5=100.20 The
mean percentage of respondents having positive atti-tudes to patient safety (ie, ≥75 out of 100 agree slightly or strongly, equivalent to four to five points on the Likert scale) was calculated using the formula: (((Mean of the teamwork items)−1) * 25).30
Seven supplementary questions covered the demo-graphics of the respondents, including age, sex, profession and work experience. In this study, some minor changes of the wording of 17 items were made, where 13 belong to the six factors, to further refine the meaning of them. As an example to clarify management that may exist at different levels the unit level was referenced, not the overall hospital level. On this basis, the internal consistency for this study overall indicated acceptable values, except for perceptions of management and working conditions, which showed poor values. The confirmatory factor analysis and good-ness-of-fit indices showed acceptable model fit. Detailed results will be presented in a separate publication by the research team. Furthermore, the SAQ items emphasise atti-tudes of colleagues and the effect on patient safety climate except for the stress recognition scale, which captures atti-tudes about stress in the delivery of patient care, that is, how stressors are perceived to affect personal performance but not to which degree. According to the original SAQ, ‘not applicable’ is included as a response alternative and calculated as no score (ie, missing values).20 Two negatively
worded items, one measuring safety climate and one team-work climate, were reversed for the analysis. Cronbach’s alpha showed a variation in the six SAQ-OR factors between 0.51 and 0.76, indicating a range from poor to acceptable values.31
To elicit estimations from nurse managers and medical directors about staff attitudes to patient safety, a short questionnaire was used, derived and tested for intelligi-bility from the work of Huang et al.7 The items were based
on the six factor definitions in the SAQ. For example, the item ‘teamwork climate’ was described as ‘How do you esti-mate your staffs’ perception of teamwork cliesti-mate within the OR where they work?’ For stress recognition, the item was worded, ‘How do you estimate your staffs’ ability to recognize stress and the negative impact of fatigue on their performance?’ The six items were answered on a rating scale (1–10), nurse managers and medical direc-tors estimated their direct subordinate staffs’ mean score for each factor, where 1=the worst score, 5=middle score and 10=best score. The questionnaire was pilot tested for intelligibility by two nurse managers and one medical director in an OR department not included in the study, which resulted in no further changes.
data collection
Medical directors at OR and surgical departments at the three hospitals were asked for permission to conduct the investigation, and information about the study was given
to participants personally by one of the researchers (CG) during staff meetings. Within four surgical specialties, the respective medical director gave the information to the staff. A cover letter providing information about the study and a prepaid envelope accompanying the questionnaire were distributed to each employee’s internal mailbox. The short questionnaire was distributed to nurse managers and medical directors in the same way and at the same time as the other questionnaires. Study information was provided to all participants via email on the same day the questionnaire was distributed. Each participant was assigned a unique code number written on the question-naires to allow for sending reminders to non-responders. The questionnaire was estimated to take approximately 15 min to complete. The data collection lasted from 4 September until 17 November 2014 and three rounds of reminders were sent to all non-responders.
ethics
The study was conducted according to international research standards and was approved by the regional Ethical Review Board in Uppsala (No. 2014/211). Partici-pants were informed they could withdraw from the study at any time without having to justify their decision. Informed consent was adopted by the returned questionnaire.
statistical analyses
The SAQ index was treated as a continuous variable and presented with means and SD for the sake of compara-bility with previous research, although the questionnaire is based on an ordinal scale. To evaluate the internal consistency of the SAQ factors, Cronbach’s alpha was computed. Calculations of mean values and analysis of variance among the three groups were computed using the Kruskal-Wallis test to determine the difference among the three professional groups (perioperative nurses, physicians and LPNs). Differences in factor scores among these groups were analysed with the Mann-Whitney U test, and Bonferroni correction was used to adjust for multiple comparisons. A p value of <0.05 was considered statisti-cally significant. All statistical analyses were performed using SPSS V.21.0.
The estimations from the nurse managers and medical directors were transformed into a 100-point scale and divided by their staffs’ actual mean scores for the safety climate on the 100-point scale, by respective staff group. The relationship between nurse managers and medical directors’ estimations and their staffs’ actual mean safety climate scores was calculated by taking their estimates of the respective factor divided by their staffs’ actual mean factor scores. A ratio of >1.0 reflects overestimation and <1.0 reflects underestimation, which was calculated in Microsoft Excel 2011.
results
A total of 541 staff members within three central OR departments were eligible for participation, and 332 (61%) consented to participate. The internal attrition analysis
Table 1 Demographics and response rates for professions in the operating room
Profession Sample, n Response rate, n (%) AgeMean (SD) Female (%)
Years of professional experience Mean (SD) Years of specialty experience Mean (SD) Perioperative nurses 233 146 (62.7) 46 (10.3) 80.1 20 (10.9) 14 (10.7) Physicians 184 112 (60.9) 45 (9.7) 33.9 17 (9.5) 11 (8.4)
Licensed practical nurses 124 74 (59.7) 49 (9.7) 94.6 26 (10.3) –
Total 541 332 (61.4) 46 (10.1) 67.8 20 (10.8)
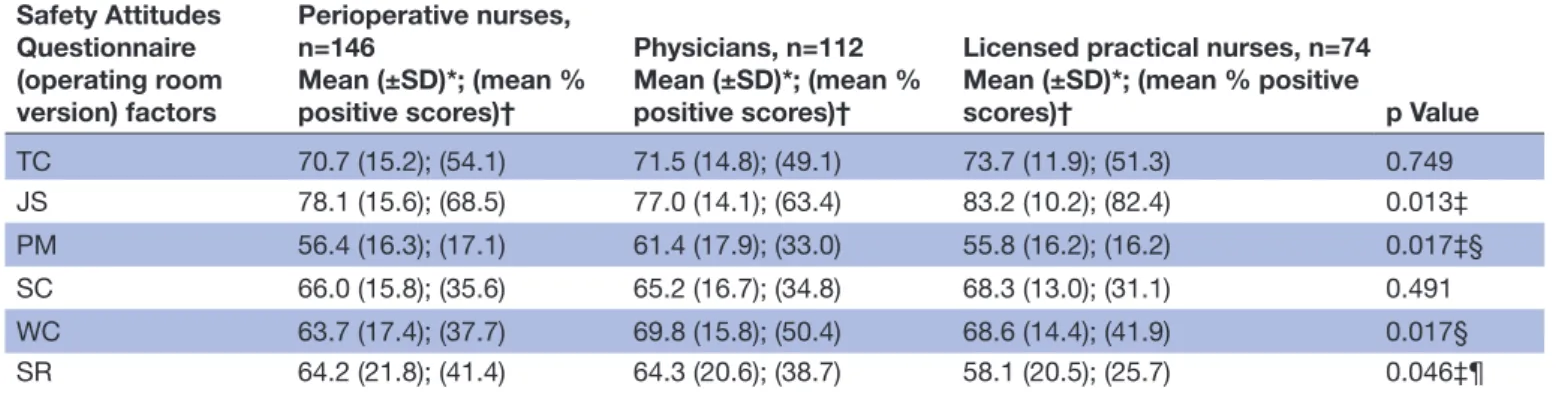
Table 2 Safety climate factors and differences in ratings among professions in the operating room Safety Attitudes Questionnaire (operating room version) factors Perioperative nurses, n=146 Mean (±SD)*; (mean % positive scores)† Physicians, n=112 Mean (±SD)*; (mean % positive scores)†
Licensed practical nurses, n=74 Mean (±SD)*; (mean % positive
scores)† p Value TC 70.7 (15.2); (54.1) 71.5 (14.8); (49.1) 73.7 (11.9); (51.3) 0.749 JS 78.1 (15.6); (68.5) 77.0 (14.1); (63.4) 83.2 (10.2); (82.4) 0.013‡ PM 56.4 (16.3); (17.1) 61.4 (17.9); (33.0) 55.8 (16.2); (16.2) 0.017‡§ SC 66.0 (15.8); (35.6) 65.2 (16.7); (34.8) 68.3 (13.0); (31.1) 0.491 WC 63.7 (17.4); (37.7) 69.8 (15.8); (50.4) 68.6 (14.4); (41.9) 0.017§ SR 64.2 (21.8); (41.4) 64.3 (20.6); (38.7) 58.1 (20.5); (25.7) 0.046‡¶
p Values in the table are based on Kruskal-Wallis analysis of variance by ranks, followed by Mann-Whitney U tests with Bonferroni correction. *Mean scores (100 scale) ± SD.
†Mean % positive scores (100 scale).
‡Differences between physicians and licensed practical nurses: JS, p=0.003; PM, p=0.016; SR, p=0.021; however, with Bonferroni correction, SR was non-significant (p=0.063).
§Differences between perioperative nurses and physicians: PM, p=0.013; WC, p=0.007.
¶Differences between perioperative nurses and licensed practical nurses: SR, p=0.029; however, with Bonferroni correction, SR was non-significant (p=0.087).
JS, job satisfaction; PM, perceptions of management; SC, safety climate; SR, stress recognition; TC, teamwork climate; WC, working conditions.
showed no significant difference between responders and non-responders regarding gender and profession. Demo-graphics and response rates for the surgical teams are presented in table 1. Ten nurse managers in the OR and 12 medical directors were eligible for participation, and 20 (91%) returned the questionnaire.
overall sAQ-or factor scores
The mean for members on the surgical team shows that respondents’ attitudes to patient safety were overall posi-tive regarding job satisfaction (78.9). Teamwork climate (71.7) showed almost favourable scores, but safety climate (66.2), working conditions (66.8) and stress recognition (62.9) had lower mean scores. Perceptions of manage-ment (57.9) showed the lowest scores. The assessmanage-ments of mean percentage positive scores for the six factors were all below 60% except for job satisfaction.
sAQ-or factors variability by profession
The results from comparing perioperative nurses and physicians’ SAQ-OR factor scores showed that mean scores from perioperative nurses for working conditions (p=0.013) and perceptions of management (p=0.007) were significantly lower. LPNs scored significantly higher
than physicians within the factor of job satisfaction (p=0.003). Within perceptions of management, physi-cians gave significantly higher mean scores than LPNs (p=0.016). LPNs had lower, but not significantly lower, mean scores for stress recognition; that is, they were less able to acknowledge that their performance may be influ-enced by stressors compared with physicians (p=0.063) and perioperative nurses (p=0.087), respectively. The results are shown in table 2.
nurse managers and medical directors’ estimations of their staffs’ safety climate ratings
Nurse managers and medical directors estimated their staffs’ ratings of safety climate fairly well. Their mean results showed a slight overestimation of their staffs’ ratings of stress recognition (1.13), safety climate (1.10), perceptions of management (1.07) and teamwork climate (1.05). Slightly underestimated factors were job satisfac-tion (0.94) and working condisatisfac-tions (0.89) (figure 1).
dIscussIon
The main results show that there were variations in atti-tudes towards patient safety of the various professionals
Figure 1 Means and ratios of the respective nurse managers and medical directors’ estimations of their staffs’ mean safety climate scores for respective staff group to the six actual factor scores in the Safety Attitudes Questionnaire Operating Room version index. A ratio of >1.0 reflects overestimation and <1.0 underestimation.
of the surgical teams, that job satisfaction was overall positive and that perceptions of management earned the lowest scores. Mean percentage positive scores were low in all groups except for job satisfaction. Physicians rated working conditions significantly higher than did periop-erative nurses and perceptions of management signifi-cantly higher than did perioperative nurses and LPNs. In turn, LPNs rated job satisfaction higher than physicians did. The nurse managers and medical directors’ estima-tions of their staffs’ ratings of safety climate cohered fairly well with the actual ratings of the staff.
The overall teamwork climate in this study showed no significant discrepancies between different professions and slightly higher scores than previous studies.25 27 This
finding might indicate the influence of several factors such as the introduction of the surgical safety check-list,32 with its focus on improving teamwork and
commu-nication,33 and increased awareness of patient safety in
general.34
It is notable that the results showed low scores for patient safety climate and that the managers estimated their staffs’ perception of this issue fairly well. In this study, similar to those in other clinical settings,7 24 35 the overall
mean percentage scores for working conditions and perceptions of management were low. To interpret what is acceptable, the mean percentage positive score is easy to understand for managers and front-line staff. Previous experience with the SAQ suggests that departments with
respondents reporting less than 60% positive scores are most suitable for quality improvements,21 36 but the goal
should be at least 80% positive scores to judge the climate as good.36 In this study, in line with findings by Profit et al,36 low mean percentage positive scores were identified
within all factors except for job satisfaction. This result may be an indication of problems in the work context of the OR.
Managers play an important role in creating and developing patient safety,37 but they also struggle
constantly with conflicting goals such as the balance between production and patient safety.38 Managers
can establish a positive patient safety climate by prioritising quality of patient care before administra-tive demands and providing work schedules that do not threaten recovery time or expose junior staff to work tasks with high demands.39 Staff shortage and
economic constraints make these goals a great chal-lenge for healthcare managers. In the present study, perioperative nurses reported significantly lower scores for working conditions compared with physicians, a finding similar to previous studies in intensive care7 35
and OR settings.22 Registered nurses (RNs) in medical
and surgical departments also report dissatisfaction with their working conditions. Nursing tasks are left undone because of a lack of time, and adverse events are not uncommon.40 European RNs working shifts of
a lower quality of care and patient safety and more care left undone.41 Even if these results cannot be directly
compared with the factor of working conditions in our study, working conditions represent an important aspect of patient safety that requires further investiga-tion. Nurse and physician shortages contribute to high workloads and may also force healthcare professionals to work closer to the margin of safety.42
Physicians within neonatal intensive care have reported lower scores for perceptions of management compared with other professions.43 However, in the present study,
compared with physicians, both perioperative nurses and LPNs showed significantly lower scores regarding perceptions of management. Comparisons between RNs and physicians in the intensive care unit have yielded similar patterns.7 These results may reflect that
physi-cians perceive more support from management and have a stronger influence on organisation and management. Physicians may work more closely with management and therefore be more aware of the quality and safety efforts at the management level.
To manage variations in pressure and rapid changes in the OR, strong networking among department managers that allows for distributed decision making may be a way to quickly and effectively adapt to various conditions. To improve patient safety culture, in this case a psychiatric department, a multicomponent lead-ership intervention consisting of academic input, exer-cises, reflections, discussions and action learning led to significant improvements.44 To learn from what goes
right, solve complex problems, elevate collaboration and improve the patient safety climate, strengthening leadership may be beneficial for managers in the OR context.
The patient safety climate influences professional behaviours and outcomes for patients; therefore, a low level of safety climate is a concern because it may indi-cate low safety awareness in the organisation. To improve the capacity for monitoring, adapting and responding, healthcare managers and surgical teams may use brief-ings and debriefbrief-ings to manage daily threats to patient safety. Briefings may be used to solve staffing and priori-tise the OR list and equipment issues before a procedure starts, and at the end of the day, debriefings will support reflective learning about what went well and what could be improved.45
study implications
Concepts that might explain the existing differences between managers and front-line staff are work as imag-ined and work as done.46 Managers, all distant from
clinical activities, base their assumptions on what front-line staff should do according to policies and proce-dures. Because of the complex nature of the healthcare system, demand and capacity are difficult to align, and unforeseen variance and interactions require front-line staff to adapt to various conditions. Work as done is what actually is experienced and done by front-line staff in
everyday clinical work. Hence, work as imagined cannot capture the varying circumstances, diversity of patients and goal conflicts that exist in everyday clinical work. The increasing complexity and pressure may imply that traditional leadership is not sufficient to tackle the complex demands of today’s healthcare. In contrast to traditional leadership where managers control changes and actions from outside the department, managers may work with staff to process budget data, patient flow and other metrics to reach a shared decision that takes variability and patient and staff needs into account, a so-called complexity leadership. Complexity leadership is also suggested to bridge cultural gaps in the organi-sation between clinical managers and front-line staff47
and to tackle rising costs, poor quality and increasing complexity of healthcare. Such a leadership model is characterised by strong networking, distributed deci-sion making and supportive organisational conditions that allow quick and effective adaptations to unex-pected conditions.48
strengths and limitations
All professionals in the surgical team were included, which is a strength in the study. However, there are also some limitations to be addressed. The response rate of 61% is low yet acceptable for a survey study.49 The
external validity is limited since the sample represents only three hospitals and their OR departments.
Compared with a previous study using SAQ-OR in a sample of Swedish perioperative nurses and LPNs,29 the
Cronbach’s alpha in the present study showed somewhat poorer values which could be due to several answers of ‘not applicable,’ analysed as missing values. Not appli-cable was over-represented in the sample of physicians which may indicate that the OR department was not considered as their main workplace leading to difficulties in answering questions such as how medical errors are discussed in the OR.
OR nurses, nurse anaesthetists, surgeons and anaesthe-siologists are different specialties performing care to the surgical patient yet dichotomised as perioperative nurses and physicians in the analysis. This dichotomisation may have limited the variation in results because increased specialisation may create subcultures within the profes-sional groups.50
conclusIon
This study shows variations in attitudes towards patient safety of the various professionals in the surgical teams. There are also some weak areas for patient safety climate in the studied ORs as reported by front-line staff which are acknowledged by nurse managers and medical direc-tors. This result is a concern because a weak patient safety climate has been associated with poor patient outcomes. Managers need to show a shared responsi-bility with front-line staff and provide support to raise awareness of patient safety in the OR. Future research
needs to focus on how to improve the safety climate in different contexts in the healthcare organisation.
Acknowledgements The authors wish to thank the Department of Anaesthesia and Intensive Care Unit, Falu Lasarett, for support and Jan Ifver at the Centre for Clinical Research Dalarna for statistical support and involved departments for their participation in this study.
contributors CG, MU, UN and AE contributed to the study design. CG was responsible for data collection and drafting of the manuscript and undertook the initial interpretation of the data, which was followed by discussions with MU, UN and AE. MU, UN and AE reviewed drafts of the manuscript. CG, MU, UN and AE read and approved the final manuscript.
Funding This work was supported by the Centre for Clinical Research Dalarna, but the funder had no involvement in the design and running of the study.
competing interests None declared.
ethics approval The regional Ethical Review Board in Uppsala approved the study (No. 2014/211).
Provenance and peer review Not commissioned; externally peer reviewed. data sharing statement No additional data are available.
open Access This is an Open Access article distributed in accordance with the Creative Commons Attribution Non Commercial (CC BY-NC 4.0) license, which permits others to distribute, remix, adapt, build upon this work non-commercially, and license their derivative works on different terms, provided the original work is properly cited and the use is non-commercial. See: http:// creativecommons. org/ licenses/ by- nc/ 4. 0/
© Article author(s) (or their employer(s) unless otherwise stated in the text of the article) 2017. All rights reserved. No commercial use is permitted unless otherwise expressly granted.
reFerences
1. Bergeur R. Bogner MS, ed. Misadventures in health care: inside stories. Misadventures in general surgery. 2004.
2. World Health Organization. Summary of the evidence in patient safety: Implications for research. 2008.
3. Gaba DM, Howard SK, Jump B. Production pressure in the work environment. California anesthesiologists' attitudes and experiences. Anesthesiology 1994;81:488–500.
4. Schimpff SC. Improving operating room and perioperative safety: background and specific recommendations. Surg Innov 2007;14:127–35.
5. World Health Organization. Patient safety A World Alliance for Safer Health Care. Human Factors in Patient Safety, Review of Topics and Tools 2009.
6. Vogus TJ, Sutcliffe KM, Weick KE. Doing no harm: enabling, enacting, and elaborating a culture of safety in health care. The Academy of Management Perspectives 2010;24:60–77. 7. Huang DT, Clermont G, Sexton JB, et al. Perceptions of safety
culture vary across the intensive care units of a single institution. Crit Care Med 2007;35:165–76.
8. Kristensen S, Túgvustein N, Zachariassen H, et al. The virgin land of quality management: a first measure of patient safety climate at the National Hospital of the Faroe Islands. Drug Healthc Patient Saf 2016;8:49–57.
9. Singer SJ, Falwell A, Gaba DM, et al. Patient safety climate in US hospitals: variation by management level. Med Care 2008;46:1149–56.
10. Kunzle B, Kolbe M, Grote G. Ensuring patient safety through effective leadership behaviour: A literature review. Saf Sci 2010;48:1–17. 11. Schein EH. Organizational culture and leadership. San Francisco:
Jossey-Bass, 2010.
12. Zohar D, Livne Y, Tenne-Gazit O, et al. Healthcare climate: a framework for measuring and improving patient safety. Crit Care Med 2007;35:1312–7.
13. Leonard M, Frankel AF. How can leaders influence a safety culture? The Health Foundation 2012.
14. Birkmeyer NJ, Finks JF, Greenberg CK, et al. Safety culture and complications after bariatric surgery. Ann Surg 2013;257:260–5. 15. DiCuccio MH. The relationship between patient safety culture
and patient outcomes: a systematic review. J Patient Saf 2015;11:135–42.
16. Singer S, Lin S, Falwell A, et al. Relationship of safety climate and safety performance in hospitals. Health Serv Res 2009;44(2 Pt 1):399–421.
17. Halligan M, Zecevic A. Safety culture in healthcare: a review of concepts, dimensions, measures and progress. BMJ Qual Saf 2011;20:338–43.
18. Robb G, Seddon M. Measuring the safety culture in a hospital setting: a concept whose time has come? N Z Med J 2010;123:68–78.
19. Kristensen S, Bartels S. European Union Network for Patient Safety. Use of patient safety culture instruments and recommendations. 2010.
20. Sexton JB, Helmreich RL, Neilands TB, et al. The Safety attitudes Questionnaire: psychometric properties, benchmarking data, and emerging research. BMC Health Serv Res 2006;6:44.
21. Schwendimann R, Zimmermann N, Küng K, et al. Variation in safety culture dimensions within and between US and Swiss Hospital Units: an exploratory study. BMJ Qual Saf 2013;22:32–41.
22. Carney BT, Mills PD, Bagian JP, et al. Sex differences in operating room care giver perceptions of patient safety: a pilot study from the Veterans Health Administration Medical Team Training Program. Qual Saf Health Care 2010;19:128–31.
23. de Wet C, Johnson P, Mash R, et al. Measuring perceptions of safety climate in primary care: a cross-sectional study. J Eval Clin Pract 2012;18:135–42.
24. Gabrani A, Hoxha A, Simaku A, et al. Application of the safety attitudes questionnaire (SAQ) in albanian hospitals: a cross-sectional study. BMJ Open 2015;5:e006528.
25. Flin R, Yule S, McKenzie L, et al. Attitudes to teamwork and safety in the operating theatre. Surgeon 2006;4:145–51.
26. Makary MA, Sexton JB, Freischlag JA, et al. Operating room teamwork among physicians and nurses: teamwork in the eye of the beholder. J Am Coll Surg 2006;202:746–52.
27. Sexton JB, Makary MA, Tersigni AR, et al. Teamwork in the operating room: frontline perspectives among hospitals and operating room personnel. Anesthesiology 2006;105:877–84.
28. Erestam S, Haglind E, Bock D, et al. Changes in safety climate and teamwork in the operating room after implementation of a revised WHO checklist: a prospective interventional study. Patient Saf Surg 2017;11:4.
29. Göras C, Wallentin FY, Nilsson U, et al. Swedish translation and psychometric testing of the safety attitudes questionnaire (operating room version). BMC Health Serv Res 2013;13:104.
30. SAQ Short form Scale items. The University of Texas at Houston – Memorial Hermann Center for Healthcare Quality and Safety Houston T. USA.
31. George D, Mallery P. SPSS for Windows step by step: a simple guide and reference 18.0 update. 2011.
32. World Health Organization. 2008. http://www. who. int/ patientsafety/ safesurgery/ tools_ resources/ SSSL_ Checklist_ finalJun08. pdf? ua=1 (accessed 1 March 2016).
33. Lyons VE, Popejoy LL. Meta-analysis of surgical safety checklist effects on teamwork, communication, morbidity, mortality, and safety. West J Nurs Res 2014;36:245–61.
34. The National Board of Health and Welfare. Injuries in healthcare. 2015.
35. Nguyen G, Gambashidze N, Ilyas SA, et al. Validation of the safety attitudes questionnaire (short form 2006) in Italian in hospitals in the northeast of Italy. BMC Health Serv Res 2015;15:284.
36. Profit J, Etchegaray J, Petersen LA, et al. Neonatal intensive care unit safety culture varies widely. Arch Dis Child Fetal Neonatal Ed 2012;97:F120–F126.
37. Sammer CE, Lykens K, Singh KP, et al. What is patient safety culture? A review of the literature. J Nurs Scholarsh 2010;42:156–65. 38. Rollenhagen C. Safety culture and safety quality. In: Oughton D,
Hansson SO, eds. Social and Ethical Aspects of Radiation Risk Management. Oxford: Elsevier, 2013.
39. Törner M, Eklöf M, Larsman P, et al. Safety climate in health care. underlying factors and the importance of staff safety and patient safety. In Swedish 2013.
40. Aiken LH, Sloane DM, Bruyneel L, et al. Nurses' reports of working conditions and hospital quality of care in 12 countries in Europe. Int J Nurs Stud 2013;50:143–53.
41. Griffiths P, Dall'Ora C, Simon M, et al. Nurses' shift length and overtime working in 12 European countries: the association with perceived quality of care and patient safety. Med Care 2014;52:975–81.
42. Rasmussen J. Risk management in a dynamic society: a modelling problem. Saf Sci 1997;27(2-3):183–213.
43. Zenere A, Zanolin ME, Negri R, et al. Assessing safety culture in NICU: psychometric properties of the Italian version of Safety
Attitude Questionnaire and result implications. J Eval Clin Pract 2016;22:275–82.
44. Kristensen S, Christensen KB, Jaquet A, et al. Strengthening leadership as a catalyst for enhanced patient safety culture: a repeated cross-sectional experimental study. BMJ Open 2016;6:e010180.
45. Vincent C, Amalberti R. Safer healthcare: Strategies for the Real World. Springer Open, 2016.
46. Hollnagel E, Wears RL, Braithwaite J. From I to Safety-II: a White Paper: National Library of Congress. 2015 http://
resilienthealthcare. net/ onewebmedia/ WhitePaperFinal. pdf (accessed 1 March 2016).
47. Kristensen S. Patient safety culture - Measurement - leadership - improvement. Aalborg University. 2016.
48. Weberg D. Complexity leadership: a healthcare imperative. Nurs Forum 2012;47:268–77.
49. Johnson TP, Wislar JS. Response rates and nonresponse errors in surveys. JAMA 2012;307:1805–6.
50. Hall P, Weaver L. Interdisciplinary education and teamwork: a long and winding road. Med Educ 2001;35:867–75.
rooms: a cross-sectional survey
patient safety climate in Swedish operating
Interprofessional team assessments of the
Camilla Göras, Maria Unbeck, Ulrica Nilsson and Anna Ehrenberg
doi: 10.1136/bmjopen-2016-015607
2017 7:
BMJ Open
http://bmjopen.bmj.com/content/7/9/e015607
Updated information and services can be found at:
These include:
References
#BIBL
http://bmjopen.bmj.com/content/7/9/e015607
This article cites 35 articles, 6 of which you can access for free at:
Open Access
http://creativecommons.org/licenses/by-nc/4.0/ non-commercial. See:
provided the original work is properly cited and the use is
non-commercially, and license their derivative works on different terms, permits others to distribute, remix, adapt, build upon this work
Commons Attribution Non Commercial (CC BY-NC 4.0) license, which This is an Open Access article distributed in accordance with the Creative
service
Email alerting
box at the top right corner of the online article.
Receive free email alerts when new articles cite this article. Sign up in the
Collections
Topic
Articles on similar topics can be found in the following collections (399)Surgery
Notes
http://group.bmj.com/group/rights-licensing/permissions
To request permissions go to:
http://journals.bmj.com/cgi/reprintform
To order reprints go to:
http://group.bmj.com/subscribe/